The Supreme Court: A Scorecard

The following table summarizes the frequency with which the justices disagreed with one another in non-unanimous cases during the recently completed 2019-2020 term (October Term 2019). (For a complete treatment of the terms during which John Roberts has been chief justice — OT2005-OT2019 — go here and scroll down past the three-part table that traces the Court’s lines of succession.) The use of non-unanimous cases highlights the degree of disagreement among justices, which would be blurred if all cases were included in the analysis.
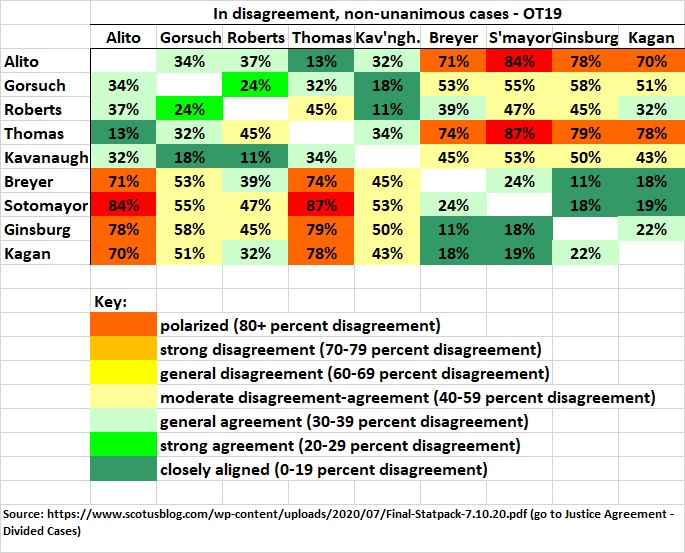
DEFECTIONS

I used the statistics that underlie the preceding table, and its counterparts for the preceding 14 terms, to construct the following index of defection (D) for each justice, by term:

D = percentage disagreement (in non-unanimous cases) with members of own wing/percentage disagreement (in non-unanimous cases) with members of opposite wing.

The “conservative” wing’s members during the 2005-2019 terms were and are Alito, Gorsuch, Kavanaugh, Kennedy, Roberts, Thomas, and Scalia. The “liberal” wings members in the period were and are Breyer, Ginsburg, Kagan, Sotomayor, Souter, and Stevens.

The lower the index, the more prone is a justice to vote with the other members of his or her wing; the higher the index, the more prone is a justice to vote with members of the opposing wing. Here’s a graph of the indices, by term:

Kennedy’s long-standing proneness to defect more often than his colleagues grew markedly in the 2014-2015 terms and receded a bit in the 2016 term. His turnaround in the 2017 term restored him to the Court’s “conservative” wing. Whereupon he retired and was succeeded by Kavanaugh.

Roberts’s slippage in the 2011-2015 terms has never been fully reversed, and his performance in the 2019 term bodes ill for the future of the “conservative” wing. Roberts’s transparent attempts to protect the Court from accusations of political bias (e.g., the Obamacare, census, and DACA cases), have rightly caused conservatives to be wary of him.

Gorsuch started out strongly in his abbreviated 2016 term (he joined the Court in April 2017), but he seems to be a fairly solid “conservative”, with some notable exceptions (e.g., LGBTQ rights).

Kavanaugh’s record in his second term aligns him with Gorsuch as somewhat of a “conservative” maverick — but not in the same league as Kennedy and Roberts.

What’s most striking about the preceding graphs, other than Kennedy’s marked departure from the “conservative” wing after the 2010 term and sudden return to it in his final term, is the increasing coherence (ideological, not logical) of the “liberal” wing. This graph captures the difference between the wings:

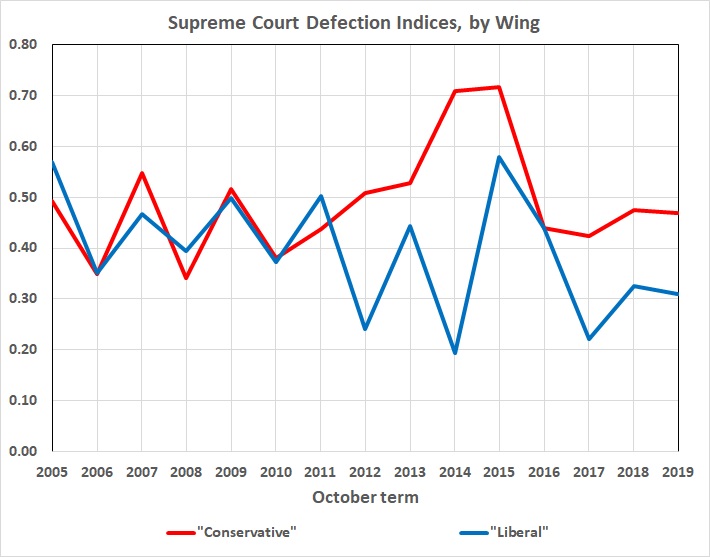
Despite Kennedy’s retirement, the presence of Roberts (and to a lesser extent, Gorsuch and Kavanaugh), ensures that the “conservative” wing will be less monolithic than the “liberal” wing.

POLARIZATION

The statistics also yield an index of polarization (P) for each justice, by term:

P = maximum percentage of non-unanimous cases in which a justice disagreed with any other justice during the term

Graphically:

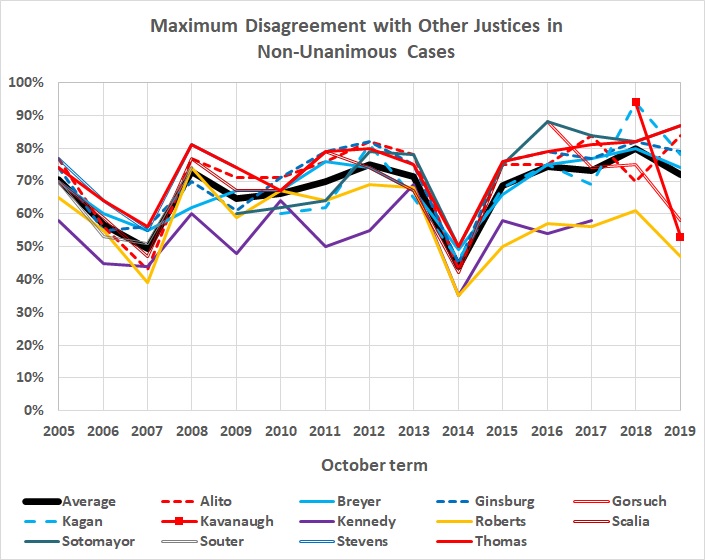
A slight upward trend over the past 15 terms? Perhaps. But there has been definite movement toward polarization since Kennedy’s peak defection terms (2014-2015). Trend or no trend, it’s clear that there is and has been a great deal of polarization among most of the justices. The exceptions are among the “conservatives”, namely Gorsuch, Kavanaugh, and Roberts — which is why the “liberal” wing is more monolithic.

THE THOMAS STANDARD

I would be pleased no end if the Supreme Court consisted of Clarence Thomas and eight clones of him. It seems to me that Justice Thomas has been the most faithful adherent of the Constitution among all of the justices who have served on the Court since I became interested in its doings more than 50 years ago. Taking Thomas as the standard for constitutional judging, it is possible to grade some of the other justices who have served with him, including all of his present colleagues.

Reversing the numbers discussed thus far, so that degree of disagreement becomes degree of agreement, and focusing on the extent to which other justices agree with Thomas non-unanimous cases, I obtain the following statistics:

Graphically:

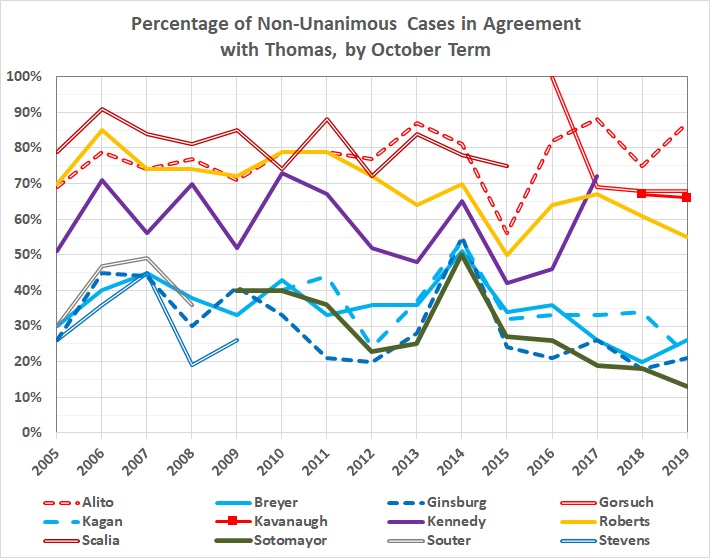
Scalia was a stalwart “conservative”, albeit somewhat quirky inn criminal cases, as is Gorsuch. Alito remains a stalwart, and Kavanaugh shows promise. Roberts continues to slip away. Breyer, Ginsburg, Kagan, and Sotomayor remain stalwart “liberals”. At the present rate, Sotomayor will find herself alone on the Court’s far-left fringe.

COVID-19 and Probability

This was posted by a Facebook “friend” (who is among many on FB who seem to believe that figuratively hectoring like-minded friends on FB will instill caution among the incautious):

The point I want to make here isn’t about COVID-19, but about probability. It’s a point that I’ve made many times, but the image captures it perfectly. Here’s the point:

When an event has more than one possible outcome, a single trial cannot replicate the average outcome of a large number of trials (replications of the event).

It follows that the average outcome of a large number of trials — the probability of each possible outcome — cannot occur in a single trial.

It is therefore meaningless to ascribe a probability to any possible outcome of a single trial.

Suppose you’re offered a jelly bean from a bag of 100 jelly bean, and are told that two of the jelly beans contain a potentially fatal poison. Do you believe that you have only a 2-percent chance of being poisoned, and would you bet accordingly? Or do you believe, correctly, that you might choose a poisoned jelly bean, and that the “probability” of choosing a poisoned one is meaningless and irrelevant if you want to be certain of surviving the trial at hand (choosing a jelly bean or declining the offer). That is, would you bet (your life) against choosing a poisoned jelly bean?

I have argued (futilely) with several otherwise smart persons who would insist on the 2-percent interpretation. But I doubt (and hope) that any of them would bet accordingly and then choose a jelly bean from a bag of 100 that contains even a single poisoned one, let alone two. Talk is cheap; actions speak louder than words.

Election 2020: Installment 2

It will be a while before there is some reliable polling about the presidential race. In the meantime, I’ll post about relevant issues, such as Trump’s popularity, the state of the economy, and the status of the COVID-19 outbreak.

POLLING

At this stage, it’s best to compare Trump’s standing against Obama’s when Obama was seeking reelection eight years ago. Trump’s relative standing has declined sharply in the past year, though it may (or may not) be on the rebound:


Derived from Rasmussen Reports Daily Presidential Tracking polls for Obama and Trump.

Voters’ perceptions of the state of the union is important, too. That perception has gone south with the rise of COVID-19 and domestic unrest. It may be irrational to blame an incumbent for matters beyond his control, but that’s what a lot of voters do. And Obama, by contrast, went into the election of 2012 with a rising tide to good feeling to buoy him.


Derived from Rasmussen Reports Right Direction/Wrong Track poll.

Trump’s numbers, by election day, will depend in large part on the perceived state of the economy. A robust turnaround will help him. A weak turnaround or new dip will hurt him.

STATE OF THE ECONOMY

The employment numbers are still bad, despite a sharp turnaround. The following graph shows the real vs. nominal unemployment rate (method explained here):

Uncertainty about COVID-19 and the state of the union has put a damper on investor’s resurgent optimism about the future of the economy:

COVID-19

Much attention is being give to the resurgence of confirmed COVID-19 cases; less is being given to the continued decline in the rate at which COVID-19 is producing deaths nationwide. Inasmuch as the response to COVID-19 has become politicized, the effect of the contagion on the outcome of election 2020 will depend, in part, on which piece of news takes center stage. Generally overlooked factors are the relative rarity of COVID-19 and the greater rarity of deaths caused by it. The following graphs sum it up:


Based on statistics recorded here. The projection of deaths is based on the rate at which deaths have declined since the peak rate on April 21, 2020.

Churchill’s “Divisiveness”

Sir Winston Churchill said many memorable things in his long and eloquent life. Nowadays, much of what he said would be considered “divisive”, that is, espousing the defense of liberty and reason. Here are some examples (drawn from this site):

The best argument against democracy is a five-minute conversation with the average voter.

We shall defend our island, whatever the cost may be, we shall fight on the beaches, we shall fight on the landing grounds, we shall fight in the fields and in the streets, we shall fight in the hills; we shall never surrender.

One ought never to turn one’s back on a threatened danger and try to run away from it. If you do that, you will double the danger. But if you meet it promptly and without flinching, you will reduce the danger by half. Never run away from anything. Never!

Courage is rightly esteemed the first of human qualities… because it is the quality which guarantees all others.

Courage is what it takes to stand up and speak; courage is also what it takes to sit down and listen.

Man will occasionally stumble over the truth, but most of the time he will pick himself up and continue on.

There is no such thing as public opinion. There is only published opinion.

A fanatic is one who can’t change his mind and won’t change the subject.

A lie gets halfway around the world before the truth has a chance to get its pants on.

An appeaser is one who feeds a crocodile, hoping it will eat him last.

Solitary trees, if they grow at all, grow strong.

All the great things are simple, and many can be expressed in a single word: freedom, justice, honor, duty, mercy, hope.

Socialism is a philosophy of failure, the creed of ignorance, and the gospel of envy, its inherent virtue is the equal sharing of misery.

Speaking of Cultural Appropriation …

… as I was here, I have a serious bone to pick with the parents of yore who broke the gender barrier by giving boy names to girl babies. There was a time when Ashley, Beverly, Evelyn, Leslie, Marion, Meredith, Merle, Shirley, and Vivian were boy names (exclusively or predominantly). The Brits even had girl-name equivalents for Leslie (Lesley) and Vivian (Vivien).

That was in the dim past. Naming has since gotten out of hand:

In 1910, just 5% of American babies named “Charlie” were girls. Over 100 years later, girl Charlies took over their male counterparts for the first time in 2016—making up 51% of the share.

With little fuss or fanfare, Charlie has gone gender-neutral….

Quartz analyzed the Social Security Administration’s public data on baby names to find out whether what happened with “Charlie” is an exception, or part of a wider trend. Our results show that, on average, the country is slowly moving toward using more gender-neutral names. And a few popular names are leading the way.

To analyze the trend, we calculated a “genderedness score” for every American baby name—and for the country on the whole. The score goes from zero to one. A zero means a name is perfectly non-gendered. That is to say, exactly half of the babies with that name are boys, and the other half are girls. A one, meanwhile, means the name is used exclusively for one gender. So a lower score means a name is more gender-neutral, and less biased.

“Biased”? What’s biased about calling a boy by a boy’s name and a girl by a girl’s name? The PC brigade to the contrary  notwithstanding, sex (a.k.a. gender) isn’t “assigned” at birth — it just is.

Anyway …

American parents have long had a strong preference for gendered names. The overall genderedness score was 0.97 in 1920, meaning nearly every kid had a name that was used almost exclusively for just boys or just girls. The score is falling, though. It hit 0.946 in 2016, the most recent year the SSA has name data for. The 1920 score is close to the historical average for names like “Billy,” “Selma,” and “Otis.” Names around the new—less gender-specific—number include “Jerry,” “Aden,” and “Orion.”

That’s another thing: Made-up names that have no historical roots. (And don’t get me started on “black” names.)

Continuing …

Several popular names, Charlie among them, are driving this trend [toward gender-neutrality]. No girls named “Blake” show up in the data at all until 1951. But today, one-quarter of American Blakes are female. And it’s not just boys’ names being given to girls, either. “Marion,” for example, has seen a major shift from girls to boys….

Many other popular names from the 2016 dataset are also gender-neutral, including “Finley,” “Justice,” and “Armani.” Here are the least-gendered 20, only including those with more than 500 babies with that name.

Name Gendered score Births
Charlie 0.02 3,448
Oakley 0.05 1,009
Justice 0.05 1,257
Landry 0.07 612
Armani 0.07 962
Skyler 0.09 1,667
Azariah 0.1 656
Finley 0.16 2,961
Royal 0.16 1,134
Lennon 0.19 1,095
Hayden 0.2 3,942
Casey 0.22 834
Emerson 0.23 3,163
Rowan 0.24 3,522
Baylor 0.24 548
Dakota 0.24 2,266
River 0.24 2,943
Remy 0.24 1,042
Emory 0.25 715
Phoenix 0.26 1,945

At the same time, some names are becoming more gendered. “Ashton” has gone from being pretty equal to primarily a boys’ name. “Harper” used to be more common for boys, but is now over 97% girls. And the most popular names from 2016 score high on the genderedness scale—Emma and Olivia at 0.99, and Scarlett and Victoria at 1.00, without a single boy.

Given that the average is moving the other way, though, it seems these mono-gendered choices are slowly becoming less popular. Gender-neutral options like Parker, Jordan, and Riley were among the top 100 in 2016.

Note the number of made-up names and names that (in saner times) would be thought of as masculine (e.g., Landry, Finley, Lennon, Casey, Emerson, Baylor, and Emory).

Unmentioned by the author is a phenomenon that would be obvious to an attentive reader: The appropriation of names (like cultural appropriation generally) is a one-way street. Girls get to do it (well, their parents do); boys just suffer in silence (or else) as their names become sissified.

You’ll know that the cultural revolution has succeeded when Emma, Scarlett, and Victoria become accepted as boys’ names.

Real vs. Nominal Unemployment Rate

The labor-force participation rate peaked in January 2000:

The business-cycle recession of 2008-2011 slammed full-time employment; the temporary closures of 2020 had the opposite effect:

The real vs. nominal unemployment rate (setting the real unemployment rate equal to the nominal rate in January 2000, and adjusting for subsequent changes in the labor-force participation rate and the fraction of employed persons working full-time):

Go here for an explanation of the method and the reasons for the decline in the labor-force participation rate from 2000 to 2016.

“Cultural Appropriation” Is a Stupid Concept

Just for the fun of it, let’s divide the world into the old racial categories — Caucasoid, Mongoloid, and Negroid — and stipulate that they are associated with broadly different cultural heritages. By cultural heritages, I mean not just such things as weird languages, funny dance steps, and peculiar ways of decorating oneself, but also such things as the STEM disciplines, the technologies resulting from their application, and various other refinements (or lack thereof) in the various arts (e.g., plastic, visual, musical, and terpsichorean).

Now, it is widely believed by those persons who are sensitive to such things that Caucasoids commit grievous social sins when they adopt and adapt (i.e., appropriate) the cultural artifacts of Mongoloids and Negroids. But Mongoloids and Negroids are free of sin when the appropriate the cultural artifacts of Caucasoids.

This is a good thing for Mongoloids and Negroids because, unlike Caucasoids who claim to detest cultural appropriation, they know where they would be without it. Where’s that? Living in primitive conditions without the following (and much more):

Computers (of all sizes)

Internet

Smart phones

Radio and TV

Movies

Automobiles (of all kinds), airplanes, and trains (including subways)

Mass production of myriad products, from foodstuffs to folderol

Complex and efficient distribution networks for the aforesaid products

The vast array of services that has accompanies, enabled, and evolved with the aforesaid artifacts (and other)

Classical music

Country music

Various sports (e.g., baseball, basketball, soccer, football)

That’s enough of that.

Now consider the number of Mongoloids and Negroids (billions, actually) who benefit from such things. And consider the number of Mongoloids and Negroids in the U.S. (millions, certainly) who are among the country’s top earners because of such things.

Where would those billions and millions be if cultural appropriation were banned by force of law?

A New Direction

Nothing that I say here will have any effect on the downward spiral of the United States into an anti-libertarian oligarchy, controlled by an academic-media-information technology-regulatory complex that is intent on the suppression of straight, white persons of European descent who aren’t members of the complex, and anyone (regardless of sex, race, ethnicity, or national origin) who dissents from the party line du jour.

The oligarchs themselves will do everything in their considerable power to control the narrative and keep their followers in line by using the contemporary equivalent of bread and circuses (tawdry entertainment; sensational, biased “news”; transfers of income and wealth; further erosion of the institutions that inculcate and enforce traditional morality; etc.).

You can read what I have said about such matters (e.g., here) — and much more — by consulting the list of categories and the tag cloud in the sidebar, and by reading selections from my (very long and semi-organized) list of favorite posts. I will say no more, having said more than enough, to no avail, in a blogging career that spans more than twenty years.

But, as an inveterate analyst, I will continue to produce statistical charts and tables that probe such matters as the status of the COVID-19 outbreak in the United States, Trump’s polling, the outlook for election 2020, climate data, economic indicators, and the ideological direction of the Supreme Court. So, from now on, I will publish posts on subjects that lend themselves to statistical treatment — without commentary. (Well, I may throw in an occasional bit of barbed humor.)

I will report, you may decide — or despair — as you wish.