I have treated intelligence many times; for example:
- Positive Rights and Cosmic Justice: Part IV
- Race and Reason: The Achievement Gap — Causes and Implications
- “Wading” into Race, Culture, and IQ
- The Harmful Myth of Inherent Equality
- Bigger, Stronger, and Faster — But Not Quicker?
- The IQ of Nations
- Some Notes about Psychology and Intelligence
- “Science” vs. Science: The Case of Evolution, Race, and Intelligence
- More about Intelligence
- Not-So-Random Thoughts (XXI), fifth item
- Intelligence and Intuition
- Intelligence, Personality, Politics, and Happiness
- “Intelligence” As a Dirty Word
- Why Race Matters
- The Learning Curve and the Flynn Effect
- Has Humanity Reached Peak Intelligence?
- Intuition vs. Rationality
These posts include and link to an abundance of supporting material. The additional material reproduced below consists of quotations from the cited sources. The quotations (and sources) are consistent with and confirm several points made in my earlier posts:
- Intelligence has a strong genetic component; it is heritable.
- Race is a real manifestation of genetic differences among sub-groups of human beings. Those subgroups are not only racial but also ethnic in character.
- Intelligence therefore varies by race and ethnicity, though it is influenced by environment.
- Specifically, intelligence varies in the following way: There are highly intelligent persons of all races and ethnicities, but the proportion of highly intelligent persons is highest among Ashkenazi Jews, followed in order by East Asians, Northern Europeans, Hispanics (of European/Amerindian descent), and sub-Saharan Africans — and the American descendants of each group.
- Males are disproportionately represented among highly intelligent persons, relative to females. Males have greater quantitative skills (including spatio-temporal aptitude) relative to females; whereas, females have greater verbal skills than males.
- Intelligence is positively correlated with attractiveness, health, and longevity.
- The Flynn effect (rising IQ) is a transitory environmental effect brought about by environment (e.g., better nutrition) and practice (e.g., learning and application of technical skills). The Woodley effect is (probably) a long-term dysgenic effect among people whose survival and reproduction depends more on technology (devised by a relatively small portion of the populace) than on the ability to cope with environmental threats (i.e., intelligence).
Researchers of group differences have pointed out until they are blue in the face that believing in equal rights is not contingent on believing all people are born with the same abilities and that merely by discussing the causes of group differences in mean IQ they are not intending to question the moral basis for sexual or racial equality. You can believe that there are between-group IQ differences – you can even believe that these differences are 80% heritable – and still remain committed to equal rights….
But anti-hereditarians seem to have extraordinary difficulty grasping this point – it is as if they want their opponents to be making this false inference even though, by imagining this sin, they are unconsciously committing it themselves. If you argue that any research into group differences is ‘dangerous’ because it threatens to undermine the basis for equal rights, you are implicitly accepting the twisted logic of the racist’s argument, namely, that if people aren’t equal in their capabilities, then we would be justified in denying some groups their civil rights. It is this inference that is racist, not any claim about group differences, whether true or not, and it is not one that most intelligence researchers are guilty of. No doubt some hereditarians are racists, but then the beliefs of some cultural determinists are pretty toxic too, such as Joseph Stalin, Chairman Mao and Pol Pot.
Source: Toby Young, “Liberal Creationism“,
Intelligence, January-February 2018
Where are we now, in the continuing story of the genetics of intelligence? Usually, one goes to a meta-analysis to discern the pattern of results.
A combined analysis of genetically correlated traits identifies 187 loci and a role for neurogenesis and myelination in intelligence. W. D. Hill, R. E. Marioni, O. Maghzian, S. J. Ritchie, S. P. Hagenaars, A. M. McIntosh, C. R. Gale, G. Davies & I. J. Deary
https://www.nature.com/articles/s41380-017-0001-5….
Seven novel biological systems associated with intelligence differences were found.
1 Neurogenesis, the process by which neurons are generated from neural stem cells.
2 Genes expressed in the synapse, consistent with previous studies showing a role for synaptic plasticity.
3 Regulation of nervous system development.
4 Neuron projection
5 Neuron differentiation
6 Central nervous system neuron differentiation.
7 Oligodendrocyte differentiation.
In addition to these novel results, the finding that regulation of cell development (gene-set size = 808 genes, P-value 9.71 × 10⁻⁷) is enriched for intelligence was replicated.
In summary, if further proof were needed that these bits of the genetic code were associated with brainpower, the list homes in on everything likely to be required for a fast-thinking powerful biological system.…
They canter to a conclusion:
We found 187 independent associations for intelligence in our GWAS, and highlighted the role of 538 genes being involved in intelligence, a substantial advance on the 18 loci previously reported.…
Source: James Thompson, “More Genes for Intelligence: A Pattern Emerges“,
The Unz Review, March 16, 2018
For the first time, scientists have discovered that smart people have bigger brain cells than their peers.
As well as being bulkier, the cells are better connected to their neighbours, allowing them to process more information at a faster rate….
The study is the first to ever show that the physical size and structure of brain cells is related to a person’s intelligence levels.
Christof Koch at the Allen Institute for Brain Science in Seattle told New Scientist: ‘We’ve known there is some link between brain size and intelligence. The team confirm this and take it down to individual neurons.”
Source: Joe Pinkstone, “Secret to Intelligence? New Link between Brain Cell Size and IQ May Help Scientists Find a Way to Enhance Human Intellect“,
DailyMail.com, May 2, 2018
I`ve accumulated recent data on the average scores by race for five exams: the GRE for grad school, the LSAT for law school, the MCAT for medical school, the GMAT for business school, and the DAT for dental school.
To make all the numbers comprehensible, I`ve converted them to show where the mean for each race would fall in percentile terms relative to the distribution of scores among non—Hispanic white Americans….
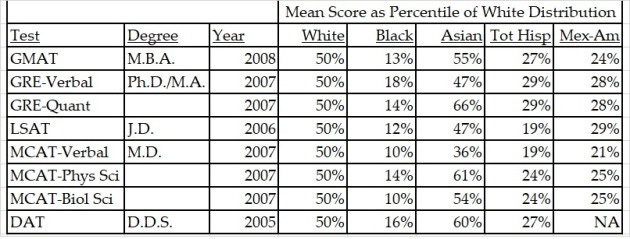
Thus, for example, on the Graduate Management Admission Test (GMAT), the gatekeeper for the M.B.A. degree, the mean score for whites falls, by definition, at the 50th percentile of the white distribution of scores. The mean score for black test—takers would rank at the 13th percentile among whites. Asians average a little better than the typical white, scoring at the 55th percentile….
If we look at how many people of each group take the test, we can understand the variations in average score a little better.
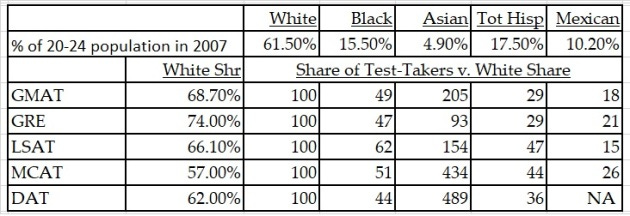
Thus, for example, whites, who in 2007 made up 61.5 percent of the 20—24—year—old cohort, took 68.7 percent of the GMATs. Blacks took the GMAT at a per capita rate just under half (49 percent) of the white rate. Asians are more than twice (205 percent) as likely as whites to sit the GMAT. Mexicans are only a fifth (18 per cent) as likely.
Source: Steve Sailer, “Graduate School Admissions, Race, and the White Status Game“, VDare.com, April 6, 2009
[R]ace IS a social construct. But race does exist. Saying something is a “social construct” can be true and still yet not be really meaningful.
Think of it, the periodic table of chemical elements is a social construct. Do chemical elements then not exist? Or, much more relevant – in fact, exactly like race – Linnaean taxonomy is a social construct. Do kingdoms, classes, species not exist? Race is merely an extension of this.
In reality, genetic analysis can separate human populations into distinct groups. This works at the level of continental groups or even ethnic groups within a continent (or even groups within an ethnicity). At times the progression is smooth, with each group gradually giving way to the next, and at other times, the transition is abrupt….
[F]or those that accept that genetic analysis can indeed separate humanity into distinct populations, they then claim that “race” doesn’t exist because human variation is “clinial”, that is, continuous. Across continents, neighboring groups don’t separate into sharply distinct races but slowly give way to from one group to the next, so they claim. Because of this, the claim is that different racial groups don’t exist….
[T]o say that a “smooth” clinial progression of human differences renders the individual groups non-existent is equivalent to looking at [the visible color spectrum] … and concluding that each individual color does not exist because they smoothly blend into one another. That’s clearly patently ridiculous. Even if the distribution of human groups is continuous (and it often is), that wouldn’t render each group along the distribution non-existent – nor would it render the differences between each group insignificant. That would be tantamount to saying yellow is equivalent to orange.
[Further] the claim that the distribution of human populations is always clinial is not even true. Razib Khan once addressed this….
[Regarding the claim that intelligence and behavioral traits can’t be in any way inherited, because no one has found a “gene for intelligence” or for any behavioral trait]: This is one of those things that’s not even wrong. It is a red herring, and reflects a fundamental misunderstanding of genetics and what the genes do. Firstly, the genome is not like a shopping list, where there is a 1-to-1 correspondence between each “gene” and some physiological feature. Rather, the genes are like a recipe, and it is only through the complex interaction of all the genes do physical (and hence behavioral) traits emerge….
[I]t is not necessary to know which genetic variants lead to variation in a trait to know that trait variation is affected by genetic variation. That’s like saying that you need to know the names of all the people who work in a factory to know that the people there produce widgets.
As we’ve seen, behavioral genetic methods confirm the very high heritability of intelligence and behavioral traits. “Classic” behavioral genetic methods, such as twin and adoption studies, were enough to establish this by themselves….
[Regarding the claim that non-whites score low on IQ tests because the tests are culturally biased]: No. Indeed, not all non-Whites score below “Whites” (as we’ve see above, hardly a monolithic category itself). East Asians, specifically those from China, Korea, and Japan, tend to outscore Northern Europeans on IQ tests, scoring in the 105 or so range, on average. Ashkenazi Jews also are found to outscore non-Jewish Whites, the former possessing an average IQ around 112. In the case of Blacks (that is, specifically, those of West African descent), they tend to do the best on culture-“loaded” IQ tests, and do significantly worse on more “culture-free” tests like the Raven’s Progressive Matrices (which use test questions like the one seen here). “Fresh off the boat” East Asian immigrants to the West don’t seem to have a problem with either IQ tests or eventual real-world performance….
[Regarding the claim that poverty and/or discrimination are the causes of racial gaps intelligence]: Partly true, mostly false. An adverse environment, especially when we’re talking severe poverty – of the type you find in sub-Saharan Africa today – likely does have a deleterious effect on IQ. Hence, average IQ in sub-Saharan Africa is likely quite a bit lower than it would be under optimum conditions. However, we can’t reduce all racial IQ differences to environmental deprivation.
For one, racial gaps in IQ and achievement persist even in developed countries. Interventions, like Head Start, meant to ameliorate any educational deficits do nothing for the gap, as a comprehensive study by the U.S. government showed. As well, while income is correlated with IQ and educational attainment for all races, the relationship between childhood SES and IQ is different for different racial groups….
[O]n the SAT (which is simply another IQ test), the poorest Whites collectively outscored the wealthiest Blacks. As well, as we see, Blacks whose parents have graduate degrees are matched by Whites whose parents are only high school grads.
Even more interestingly, the group IQ and achievement hierarchy visible in the U.S. is found all over the world. All across the world, Blacks, for example – as a group – generally do poorly versus Europeans. East Asians and Ashkenazi Jews collectively do well all around the world, better than Northern Europeans do. Across the globe and across very different societies and different economic systems, you see roughly the same pattern you do in the United States. One could attempt to piece together some “cultural” explanation for any particular society, but how to explain this global consistency, then? This is true with populations who have been in these respective countries for many generations, as is the case in Brazil, for instance.
Source: JayMan, “JayMan’s Race, Inheritance, and IQ FAQ (F.R.B.)“,
JayMan’s Blog, May 4, 2015 (This writer’s style is crude and sometimes ungrammatical, but I have includedthis excerpt because the writer has a good command of the relevant research and has summarized it well.)
Davide Piffer is a 34 year-old Italian anthropologist with a Master’s degree from England’s prestigious Durham University. He has an IQ of over 132. Piffer is currently studying for his PhD at Israel’s Ben Gurion University.
Piffer has written an analysis of a Genome Wide Association Study (GWAS). Putting it in lay terms, his “forbidden paper” explores the correlation between the percentage of people in a country who carry several dozen genetic variants that are significantly associated with very high educational attainment—based on this GWAS— and average national IQ.
National IQs are robust because they correlate very strongly, at about 0.8, with other national measures of cognitive ability, such as international assessment tests. (Intelligence: A Unifying Construct for the Social Sciences, by Richard Lynn and Tatu Vanhanen, 2012) Very high educational attainment is overwhelmingly a function of high IQ.
Piffer found that the correlation between the prevalence of the polygenic score (the average frequency of several genetic variants) in nations and national IQ was 0.9. This, of course, essentially proves that race differences in intelligence are overwhelmingly genetic.
Now, obviously, Piffer needs to get this in a high impact journal: because he deserves to, for his own career advancement, and also so that it can’t be fallaciously dismissed via an appeal to snobbery—not an insignificant factor in academic life.
And this is where the problems have arisen.
In late 2014, Piffer submitted his paper on this subject to the leading journal Intelligence. One would have assumed there’d be no problem, considering that the journal has published numerous articles on race differences in IQ and has even been condemned by SJWs for doing so [Racism is creeping back into mainstream science – we have to stop it, by Angela Saini, The Guardian, January 24, 2018]. But the editor, Doug Detterman, rejected the paper citing the reviews he received. In fact, only one of two reviewers recommended rejection; the other was extremely positive. Nevertheless, the decision letter read as if both reviews were negative.
In 2015, Piffer re-submitted the paper to Intelligence. He had successfully dealt with all the criticisms, and the paper should have been accepted for publication.
However, in 2016 Detterman stepped down as head of ISIR and was replaced by Richard Haier. With new reviewers and a new editor, it was rejected out of hand.
Piffer doesn’t give up easily, that’s for sure. Tiring of Intelligence, he improved the paper once more, in light of the critical reviews, and sent it to Frontiers in Psychology, another highly-respected journal. It passed the review process after three rounds, with reviewers recommending publication. However, Piffer tells me, “the editor, after sitting on the reviews for three weeks, decided to reject it, overturning the reviewers’ recommendation.”
Piffer adds: “This decision was kind of unprecedented and especially weird for a journal like Frontiers, whose philosophy is based on transparent review and less editorial power.”
Despairing of getting it in anywhere worthwhile, Piffer posted the “forbidden paper” on a pre-print archive [Polygenic Selection, Polygenic Scores, Spatial Autocorrelation and Correlated Allele Frequencies. Can We Model Polygenic Selection on Intellectual Abilities?, January 27, 2017]. Still, it’s already been cited by a serious researcher in the field. [Geographic centrality as an explanation for regional differences in intelligence. by Edward Miller, Mankind Quarterly, Spring 2018]
More recently, Piffer self-published another paper, this time on Rpubs, using data from the latest GWAS carried out on 1.1 million people [Correlation between PGS and environmental variables, ]. It confirms his earlier findings, extending them to 52 populations from all over the globe and showing what he calls “fascinating correlations with latitude and polygenic scores of other traits.”
The top place is occupied by East Asians, followed by Europeans and equatorial people further down. “Geographic or genetic distances don’t explain these findings,” stresses Piffer, “as Austronesians (e.g. Papuans and Melanesians) have scores comparable to Africans, despite being genetically more different from African than are Europeans.”
Similarly, Piffer observes that Native Americans score lower than Europeans, despite being genetically closer to East Asians. This suggests that, after the East Asian-Amerindian split, there were later selective pressures for cognitive abilities among Eurasians.
Nobody can fault the sample size. The latest GWAS boasts an army of 1.1 million people and 2400 genetic variants. Piffer has created a plot with scores for the populations from the Human Genome Diversity Project:

Piffer is now working on getting this into a good journal. He says: “It’s to be hoped that the next editor will have enough intellectual honesty to let my findings see the light of mainstream science.”
Let’s summarize: it has now been effectively proven that racial IQ differences in intelligence are fundamentally genetic. The only counter-argument from our SJW friends is an appeal to authority: “Why hasn’t it been published in a top peer-reviewed journal, then?”
The answer: editors are so frightened of SJWs that they daren’t publish it.
But that won’t suppress results like it used to. Brave academics can simply self-publish their results until an equally brave journal editor can be found.
Postscript: Absurdly, recent developments suggest it is acceptable to note that there is a genetic explanation of the higher incidence of prostate cancer among some populations e.g, West Africans than in others.
Just not for educational attainment.
Source: Lance Welton, “‘This Will Not Stand’: Academic Establishment Suppresses Italian Anthropologist’s Proof That Race IQ Differences Are Genetic — For Now“, VDare.com, May 5, 2018
If one accepts the theory that modern humans first evolved in Africa and began colonizing the rest of the world 50,000 to 60,000 years ago, it is obvious that there has been enormous evolutionary change since that time. Zulus and Danes presumably had a common ancestor about the time humans left Africa, but are now so different from each other that standard taxonomies might well classify them as separate species….
People consciously direct the evolution of plants and animals, but [Gregory Cochran and Henry Harpending, writing in The 10,000 Year Explosion,] point out that the process is no different from the rigors of natural selection — just quicker. Much as the race deniers hate to admit it, humans in different environments evolved in sharply different directions. As the authors conclude, “We expect that differences between human ethnic groups are qualitatively similar to those between dog breeds.”
What, however, caused human evolution suddenly to speed up ten to twelve thousand years ago? For Professors Cochran and Harpending, the short answer is “agriculture.” It did so in two ways: by sharply increasing the number of people and by radically changing the environment in which they lived.
More humans meant more children, and therefore more mutations. Most babies are born with about 100 mutations, all but one or two of which are in DNA that does not seem to do anything and therefore have no effect. Those that make a difference are usually harmful or neutral but it is the occasional helpful mutation that drives evolution. Sixty thousand years ago, before the expansion out of Africa, there were perhaps only about 250,000 humans. By the Bronze Age, 3,000 years ago, there were 60 million, so a mutation that would have taken 100,000 years to occur could appear in just 400 years. Evolution was painfully slow among Paleolithic proto-humans because beneficial mutations show up so rarely in tiny populations.
Large populations are therefore a reservoir of new mutations and their size hardly slows down the propagation of good genes. According to the authors, a genetic leg up is like the flu, and can sweep through a population of 100 million in only twice the time it takes to go through a population of just 10,000.
Agriculture also brought perhaps the most dramatic change in the biological and social environment our species has ever experienced. Farming meant that for the first time in their existence Homo sapiens stayed in one place, and could therefore own more things than they could carry with them. They could become wealthier than their neighbors, and had to guard possessions against theft. Farmers could produce more food than their families needed, and this gave rise to commerce, division of labor, artisans, and non-productive elites. This social environment was completely new.
Of particular significance from an evolutionary point of view were the change of diet, domestication of animals, and population densities….
Professors Cochran and Harpending point out that some groups took up farming long before others, and that this explains a lot. Australian aborigines never farmed, and the American Indians of Illinois and Ohio started farming only 1,000 years ago. Both groups never drank alcohol before the white man showed up, and are highly susceptible to alcoholism. Fetal alcohol syndrome is about 30 times more common in these groups than in whites.
Aborigines and American Indians suffer in other ways from only recently having adopted a farming diet. Type 2 diabetes is related to a sensitivity to carbohydrates and a metabolic tendency to obesity. It is four times more prevalent among Aborigines and 2.5 times more prevalent among Navajos than among whites.
Sub-Saharan Africa was also late to take up agriculture — 7,500 years after it arose in the Middle East — and this helps explain why intelligence differences alone do not explain differences in black and white behavior. When the two groups are matched for IQ, blacks are still more likely to be criminal, shiftless, or have illegitimate children. This is probably due in part to the persistence of the smash-and-grab mentality that suits hunters but is gradually bred out of farmers….
The brain has evolved differently among different groups just as have skin color, body type, and facial features. The authors write that there are recent variants of genes that affect synapse formation, axon growth, formation of the layers of the cerebral cortex, and brain growth. “Again, most of these new variants are regional,” they add. “Human evolution is madly galloping off in all directions.”
Sometimes, even what appear to be racial similarities are actually differences that merely resemble each other. The authors point out, for example, that although both Asians and Caucasians have much lighter skins than ancestral Africans, the genetic mechanisms that shut down melanin production are different in the two races. In both Asia and Europe it was useful to let in more sunlight for vitamin D synthesis, but evolution found different ways to do it….
The 10,000 Year Explosion has a long chapter that proposes an explanation for how Ashkenazi Jews became the smartest people in the world. Trading and money-lending were high-IQ jobs, and in 1,000 years, or about 40 generations, European Jews appear to have increased their average IQs by about 12 points.
Jewish intelligence seems to be genetically associated with such diseases as Tay-Sachs, Gaucher’s, and familiar dysautonomia, which are up to 100 times more common among Jews than European gentiles. People with one copy of these genes appear to have an IQ advantage whereas two copies cause the disease. Professors Cochran and Harpending write that over time, advantageous mutations with such dangerous side effects are usually replaced by more benign mutations. The persistence of these odd mutations in Jews suggests they are recent.
One highly speculative but stimulating chapter considers the possibility that Neanderthals might have made crucial genetic contributions to Homo sapiens. There is no doubt that something important happened 30 to 40 thousand years ago. New tools, improved weapons, art, sculpture, and more efficient use of fire made big changes in what was still a Stone Age existence. These changes took place only in Eurasia — nowhere else — and Professors Cochran and Harpending are convinced they would not have come about without some important genetic change.
As it happens, this Stone Age flowering took place during the 10,000 years or so during which modern man and Neanderthals competed against each other in the same territory. Neanderthals are gone and we are not, so it is safe to assume Homo sapiens were superior — perhaps in intelligence, language, or resistance to disease. However, the authors believe there must have been genetic mixing with Neanderthals, and explain that even if just a few Neanderthal genes were useful to modern man, they would have spread through populations while the useless ones were eliminated. “It is highly likely that out of some 20,000 genes, at least a few of theirs [Neanderthal’s] were worth having,” they write. The authors concede that the genetic evidence is inconclusive — Neanderthal DNA is hard to come by — but they cite cases of “introgression,” in which wild species have acquired useful mutations from other populations.
Source: Thomas Jackson, “Science Refutes Orthodoxy — Again“, American Renaissance, May 2009 (a review of The 10,000 Year Explosion)
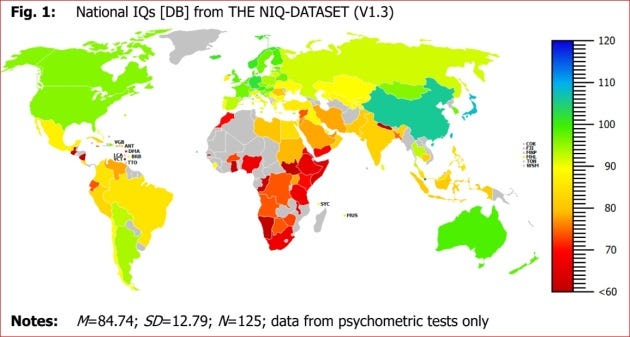
Source: James Thompson, “World IQ: Latest Update“, The Unz Review, May 15, 2018
[W]hat influence does intelligence measured at age 11 have on longevity? The good news is that a standard-deviation increase in IQ score is associated with a 24% decrease in mortality risk. So, at IQ 115 lifespan is 24% longer than average*. This is good news, together with the 60% increase in wages above the average level from an OECD study.
On the wages front, the effect of intelligence had already been shown by Charles Murray in his well-known 1998 “Income inequality and IQ” in which he compared the earnings of one child in a family with that of another sibling, showing that the effect of intelligence was powerful at creating later life differences even between siblings brought up within the same family environment.…
Iveson and colleagues have extended the within-family method by linking children in their 1947 national sample to younger siblings in a “Six day” sample, such that they had families tested at the same age with the same Moray House intelligence tests, and longevity measured up to November 2015…..
Here are the results of the contrast between the living and the dead.

These are scary figures, and worth showing to friends who doubt that IQ has any practical meaning.
Source: James Thompson, “Vita Brevis, Dignitatis Inutilis“, The Unz Revew, August 30, 2017
Digit Span must be one of the simplest tests ever devised. The examiner says a short string of digits at the rate of one digit a second in a monotone voice, and then the examinee repeats them. The examiner then tries a string which is one digit longer, and continues in this fashion with longer and longer strings of digits until the examinee fails both trials at that particular length. That determines the number of digits forwards.
Then the examiner explains that he will say a string of digits and the examinee has to repeat them backwards, that is, in reverse order. For example, 3 – 7 is to be said back to the examiner as 7 –3. This continues until the examinee fails two trials at a particular length which determines the number of digits backwards.…
The test is not only bereft of intellectual content, but is also low on cultural content. Once you have learnt digit names you are ready to do the test. I assume that forwards and backwards are concepts understood by all cultures worthy of the name.…
If any group defined in genetic or cultural terms has a particular difficulty with digits backwards this is a strong indicator that they have difficulty with tasks as they get more intellectually demanding. The higher the g loading the more they should differ from brighter groups.
Hence the great interest in the most recent scores, to see if they conform to the usual pattern described by Jensen in the G factor (p. 405, referring to work he did in 1975 with Figueroa, ref on p 614). Over at Human Varieties, Dalliard has tried to replicate those results using data from CNLSY (these are the children of the female participants in NLSY79). Incidentally, this is a great follow-up survey: “My Mummy did your tests before I was born”. Gradually we are getting to understand the transmission of intelligence through the generations.…
Dalliard says: “That the black-white gap on forward digits is substantially smaller than on backwards digits is a robust finding confirmed in this new analysis. This poses a challenge to the argument that racial differences in exposure to the kinds of information that are needed in cognitive tests cause the black-white test score gap. The informational demands of the digit span tests are minimal, as only the knowledge of numbers from 1 to 9 is required. Forward digits is a simple memory test assessing the ability to store information and immediately recall it. The informational demands of backwards digits are the same as those of forward digits, but the requirement that the digits be repeated in the reverse order means that it is not simply a memory test but one that also requires mental transformation or manipulation of the information presented.”
Source: James Thompson, “Digit Span: The Modest Little Bombshell“, The Unz Review, March 4, 2014
You may recall that I wrote with great enthusiasm about the wonders of digit span, describing it as a modest bombshell. It is a true measure: every additional digit you can remember is of equal unit size to the next, a scaled score with a true zero. Few psychometric measures have that property (a ratio scale level of measurement in SS Steven’s terms), so the results are particularly informative about real abilities, not just abilities in relation to the rubber ruler of normative samples. If there are any differences, including group differences, on such a basic test, then it is likely they are real.
Then last November Gilles Gignac dropped another bombshell. He found that if you looked at total digit span scores since 1923 there was not a glimmer of improvement in this very basic ability. This cast enormous doubt on the Flynn effect being a real effect, rather than an artefact of re-standardisation procedures. Gignac noted that digits forwards and backwards were in opposite directions, but not significantly so.…
[Michael A.] Woodley tells me that Gignac’s “substantial and impressive body of normative data on historical means of various measures of digit span covering the period from 1923 to 2008” reveals a hidden finding: the not-very-g-loaded digits forwards scores have gone up and the g-loaded digits backwards scores have gone down. This suggests that the fluffy forwards repetition task has benefitted from secular environmental gains, while the harder reversal task reveals the inner rotting core of a dysgenic society….
Woodley has proposed a co-occurrence model: losses in national IQ brought about by the higher fertility of the less intelligent exist at the same time as IQ gains brought about by more favourable social environments.
Source: James Thompson, “Digit Span Bombshell“, The Unz Review, April 3, 2015
Woodley argues that general ability is falling because of dysgenic effects, but also becoming more specialized, which he calls the Co-Occurrence model. Should it be called “Duller but specialized”?
How do these theories fare in the light of a massive new meta-analysis?…
The paper [Peera Wongupparaj et al., “The Flynn Effect for Verbal and Visuospatial Short-Term and Working Memory: A Cross-Temporal Meta-Analysis“, Intelligence, September 2017] is massive in scope, has more study samples than previous publications on this topic, is extremely large with circa 140,000 subjects and is also a massive confirmation of Woodley’s reworking of Gignac’s data, on a far larger scale. It seems that over the last 43 years we have become able to repeat a bit more but manipulate a bit less. We can echo more, and analyze less….
The authors add that the increase on the less g loaded forwards conditions suggests environmental causes including practice effects, while the decrease on the more g loaded backwards conditions suggests dysgenic effects, probably the reduced fertility of brighter persons, but perhaps also an effect of ageing populations….
So, Woodley’s “co-occurrence” model gets a strong confirmation.
Source: James Thompson, “Working Memory Bombshell“, The Unz Review, August 13, 2017
In a previous post, I show, using an American sample from the National Longitudinal Study of Adolescent Health, that physically more attractive people are more intelligent. As I explain in a subsequent post, the association between physical attractiveness and intelligence may be due to one of two reasons. Genetic quality may be a common cause for both (such that genetically healthier people are simultaneously more beautiful and more intelligent). Alternatively, the association may result from a cross-trait assortative mating, where more intelligent and higher status men of greater resources marry more beautiful women. Because both intelligence and physical attractiveness are highly heritable, their children will be simultaneously more beautiful and more intelligent. Regardless of the reason for the association, the new evidence suggests that the association between physical attractiveness and general intelligence may be much stronger than we previously thought….
The halo-effect explanation for the association between physical attractiveness and intelligence, however, runs into three different problems. First, it presumes that the judgment of physical attractiveness is arbitrary and subjective. As I explain in an earlier post, however, beauty is not in the eye of the beholder; it is an objective, quantifiable trait of someone like height or weight. Second, as I note in the previous post, the association between beauty and intelligence has been found in the American Add Health sample, where physical attractiveness of the respondents is assessed by the interviewer who is unaware of their intelligence.
Most importantly, however, the halo-effect explanation simply leads to another question: Where does the teachers’ belief that more intelligent students are more attractive come from? The notion that more intelligent individuals are physically more attractive is a stereotype, and, just like all other stereotypes, it is empirically true, as both the American and British data show. Teachers (and everyone else in society) believe that more intelligent individuals are physically more attractive because they are.
Source: Satoshi Kanazawa, “Beautiful People Really Are More Intelligent“,
Psychology Today, December 12, 2010
In this first whole population birth cohort study linking childhood intelligence test scores to cause of death, in a follow-up spanning age 11-79, we found inverse associations for all major causes of death, including coronary heart disease, stroke, cancer, respiratory disease, digestive disease, external causes of death, and dementia. For specific cancer types the results were heterogeneous, with only smoking related cancers showing an association with childhood ability. In general, the effect sizes were similar for women and men (albeit marginally greater for women), with the exception of death by suicide, which had an inverse association with childhood ability in men but not women. In a representative subsample with additional background data, there was evidence that childhood socioeconomic status and physical status indicators had no more than a modest confounding impact on the observed associations.
Source: Jan J. Deary et al., “Childhood Intelligence in Relation to Major Causes of Death in 68 Year Follow-Up: Prospective Population Study“, British Medical Journal, June 28, 2017
Sex differences are in the news. A male Google employee reviewed some of the literature on the topic in the context of his workplace practices, and got sacked. A book questioning the role of testosterone in sex differences, and more generally the veracity of innate biological sex differences, got the Royal Society Science Book prize, though it was not reviewed by Royal Society Fellows expert in that area of knowledge. More generally, there are frequent news items about the lack of women in STEM subjects, in technology jobs and in corporate boardrooms, and these discussions often blame a glass ceiling of misogyny impeding women’s progress. Meanwhile, with rather less publicity, Prof Richard Lynn has revisited his 1994 paper in the light of recent research, and invited critics to take his finding apart….
Prof Lynn begins with the following observation:
It is a paradox that males have a larger average brain size than females, that brain size is positively associated with intelligence, and yet numerous experts have asserted that there is no sex difference in intelligence. This paper presents the developmental theory of sex differences in intelligence as a solution to this problem. This states that boys and girls have about the same IQ up to the age of 15 years but from the age of 16 the average IQ of males becomes higher than that of females with an advantage increasing to approximately 4 IQ points in adulthood.
Source: James Thompson, “Men 4 Points Ahead?“, The Unz Review, October 5, 2017 (See also Toby Young, “Why Can’t a Woman Be More Like a Man?“,
Quillette, May 24, 2018.)
Which way do the fair sex incline: to matters verbal or mathematical? Verbal, it would seem, and all the more so as you go up the ability spectrum.…
The authors [of the study summarized in the post] highlight the following findings:
Sex differences in math-verbal ability tilt in the right tail were examined across 35 years. Sample included >2 million gifted adolescents across multiple measures in the U.S. and India. Ability tilt favored males for math > verbal and females for verbal > math. Sex differences in ability tilt remained fairly stable over time and replicated across measures….
[S]kipping a thousand words, here is the pictorial summary, which shows that sex differences increase as ability tilt increases:

To my eye, starting from the bottom for all students, these violin plots show the following: women are almost perfectly balanced between verbal and mathematical ability, but men incline towards being better at maths than at verbal tasks. Men are more likely to calculate….
At the higher intellectual level of the top 1 in a 100 of the population [middle part of the graphic] both men and women incline more to mathematical thinking, but men predominate more.
At the eminent level of the top 1 in 10,000 of the population [top part of the graphic], men outnumber women by about 2.5.
Source: James Thompson, “Tilting at Sex Differences“, The Unz Review, March 2, 2018
[From a review by Matt Ridley of Robert Plomin’s Blueprint: How DNA Makes Us Who We Are by Robert Plomin — Why Nature Always Trumps Nurture]
The evidence for genes heavily influencing personality, intelligence and almost everything about human behaviour got stronger and stronger as more and more studies of twins and adoption came through. However, the evidence implicating any particular gene in any of these traits stubbornly refused to emerge, and when it did, it failed to replicate.
Ten years ago I recall talking to Robert Plomin about this crisis in the science of which he was and is the doyen. He was as baffled as anybody. The more genes seemed to matter, the more they refused to be identified. Were we missing something about heredity? He came close to giving up research and retiring to a sailing boat.
Fortunately, he did not. With the help of the latest genetic techniques, Plomin has now solved the mystery and this is his book setting out the answer. It is a hugely important book — and the story is very well told. Plomin’s writing combines passion with reason (and passion for reason) so fluently that it is hard to believe this is his first book for popular consumption, after more than 800 scientific publications….
[M]ost measures of the “environment” show substantial genetic influence. That is, people adapt their environment better to suit their natures. For example, Plomin discovered that the amount of television adopted children watch correlates twice as well with the amount their biological parents watch rather than with the amount watched by their adoptive parents….
Our personalities are also influenced by the environment, but Plomin’s second key insight is that we are more influenced by accidental events of short duration than by family. Incredibly, children growing up in the same family are no more similar than children growing up in different families, if you correct for their genetic similarities. Parents matter, but they do not make a difference.
Plomin says these chance events can be big and traumatic things such as war or bereavement, but are mostly small but random things, like Charles Darwin being selected for HMS Beagle because Captain Robert Fitzroy believed in “phrenology” and thought he could read Darwin’s character from the shape of his nose. Environmental influences turn out to be “unsystematic, idiosyncratic, serendipitous events without lasting effects”, says Plomin….
… [H]eritability increases as we get older. The longer we live, the more we come to express our own natures, rather than the influences of others on us. We “grow into our genes”, as Plomin puts it. An obvious example is male-pattern baldness, which shows low heritability at 20 and very high heritability at 60.
Two other findings are that normal and abnormal behaviour are influenced by the same genes, and that genetic effects are general across traits; there are not specific genes for intelligence, schizophrenia or personality — they all share sets of genes.
Source: Matt Ridley, “The Genes That Contribute to Human Intelligence and Personality“, MattRidley Online, October 21, 2018
[Nicholas Nassim] Taleb has made sweeping assertions [about intelligence testing] with great confidence and surrounded by insulting language. Those assertions may well influence people who feel unsure about intelligence, and who assume that someone who is sure of themselves must know what they are talking about. That is understandable: an unsure person is aware they need to do more reading and thinking before feeling confident, and charitably assume that only a knowledgeable person who had done the necessary reading would dare speak with confidence.
Yet, far from giving scientific references at the end of his essay, Taleb confidently asserts that he does not need to do so, because the field is broken because…. Convexity. This is presented as if it were an essential ingredient of statistical analysis, rather than one of his interesting ideas about research strategies. This is amusing, because even in the area which Taleb calls his own, as a financial instruments trader, it is easy to find a careful, long term, large sample study that shows the beneficial effects of intelligence on investment behaviour. On his own home ground he is down 1-0.
The other lapse is to ignore the decades of debate carried out by intelligence researchers, notably Jensen, to improve measures of intelligence so that they conform to the requirements set out by SS Stevens. Digit Span is such a measure. So is Digit Symbol and, if measured extensively, Vocabulary. Simple and complex reaction times are other examples. Overall, Taleb is not providing new or original insights that advance the field. But his aim does not appear to be constructive or even informative.
I don’t know why an able man is so ill-disposed to measures of ability, but can only assume he is well aware of his abilities, and regards himself as above such mundanities. He does not give references, but mentions a book he is about to publish. Better to stick to the facts.
Does Taleb’s boastful dismissal of a field he palpably does not master mean that we should dismiss his contributions to other fields? Probably not. Public figures sometimes stray out of their field of competence. It is an occupational hazard brought on by public adulation, known since Roman times. However, if he can be so bombastic when out of his depth, then it would be prudent to go back to his other writings with a slightly more critical eye. When I read his thoughts on probability I made positive assumptions about some of his pronouncements on risk on the very prudent grounds that I could not contest his mathematical excursions. Perhaps I was Fooled by Algebra. Perhaps I was not the only one.
Taleb describes himself as a flaneur, which is a stroller, the sort of person who swans about. No problem with that. Swans are beguiling, but beautiful shapes can lead us astray.
Source: James Thompson, “Swanning About: Fooled by Algebra?“, The Unz Review, January 3, 2019
Thank you to all those who commented on the “Swanning About: Fooled by Algebra” blog and associated tweets. A number of themes came up, so here are individual responses I made to some comments, and also some general points.
Since Taleb thought he could dismiss a century of psychometry, there are rather a lot of references I needed to give in reply [listed below without surrounding text or ellipses]….
http://www.unz.com/jthompson/dettermans-50-years-of-seeking/
https://www.unz.com/jthompson/intelligence-all-that-matters-stuart/
https://www.unz.com/jthompson/intelligence-in-2000-words
https://www.unz.com/jthompson/the-7-tribes-of-intellect
http://www.udel.edu/educ/gottfredson/reprints/1997whygmatters.pdf
http://www.unz.com/jthompson/multiple-emotional-intelligence/
http://www.unz.com/jthompson/can-tests-predict-academic-outcomes/
http://www.unz.com/jthompson/the-comparative-advantage-of-eminence/
http://www.unz.com/jthompson/bright-folk-do-community-stuff/
https://www.unz.com/jthompson/intelligent-brains/
https://www.unz.com/jthompson/the-well-tempered-clavichord/
https://www.unz.com/jthompson/the-nature-of-human-intelligence-a-textbook
https://www.unz.com/jthompson/heave-half-brick-at-creativity/
https://www.unz.com/jthompson/another-half-brick-of-creativity/
https://www.unz.com/jthompson/the-tricky-question-of-rationality
http://www.unz.com/jthompson/social-class-and-university-entrance_28/
Source: James Thompson, “In the Wake of the Swan“, The Unz Review, January 5, 2019
Why was it that [Stephen Jay] Gould had such an impact when he argued [in The Mismeasure of Man] that the [intelligence] tests were biased against working class and minority racial groups? Morever, how did his views ever take hold when the issue of bias in intelligence testing had just been comprehensively evaluated in Arthur Jensen’s … Bias in Mental Testing. Jensen showed that, far from under-predicting African-American achievements, they perhaps slightly over-predicted them. I presume that Jensen’s volume was less often read, though it was written by an expert, not a polemicist. Perhaps precisely because it was written by an expert, in a restrained and far from folksy style, it had less impact on popular culture, which is what tends to determine public debates….
Gould’s book made a number of assertions. Two that stuck in people’s minds were: that measures of brain size derived from the study of skulls of different races had been biased, and that many items on the Army tests of intelligence were culturally biased.
The debate about the ancient skulls has raged to and fro for a long time, but it seems highly probable that the measures were taken correctly
Now the redoubtable Russell Warne has taken a detailed look at what Gould said about the Army Beta test, and finds that on that topic he has been unreliable and incorrect….
Warne says:
Given these results from our replication, it seems that Gould’s criticism of time limits and his argument that the Army Beta did not measure intelligence are without basis. Despite the short time limits for each Army Beta subtest, the results of this replication support the World War I psychologists’ belief that the Army Beta measured intelligence.
… Bluntly, Gould mis-represented the test, and misled his readers. Gould probably achieved his objective, which was to trash intelligence testing in the eyes of a generation of academics.
Warne has shown that the Beta test still works. It is a good predictor of intelligence, which correlates with current measures of scholastic attainment, shows a positive manifold and resolves into a common factor. In a standard which Gould never attempted, Warne pre-registered his prior assumptions so that the results of his experiment could be plainly seen by the reader, and so that the facts could prove him wrong.
Warne’s achievement is to have shown that Gould got it wrong. [See also Warne’s article, “The Mismeasurement of Stephen Jay Gould“, Quillette, March 19, 2019.]
Source: James Thompson, “Gould Got It Wrong“, The Unz Review, February 25, 2019
Teachers loom large in most children’s lives, and are long remembered. Class reunions often talk of the most charismatic teacher, the one whose words and helpfulness made a difference. Who could doubt that they can have an influence on children’s learning and future achievements?
Doug Detterman is one such doubter:
Education and Intelligence: Pity the Poor Teacher because Student Characteristics are more Significant than Teachers or Schools.
Douglas K. Detterman, Case Western Reserve University (USA)
The Spanish Journal of Psychology (2016), 19, e93, 1–11.
doi:10.1017/sjp.2016.88
https://pdfs.semanticscholar.org/2223/6c0ab2cee3dd9e25daa2236557b0912b799e.pdf
….
At least in the United States and probably much of the rest of the world, teachers are blamed or praised for the academic achievement of the students they teach. Reading some educational research it is easy to get the idea that teachers are entirely responsible for the success of educational outcomes. I argue that this idea is badly mistaken. Teachers are responsible for a relatively small portion of the total variance in students’ educational outcomes. This has been known for at least 50 years. There is substantial research showing this but it has been largely ignored by educators. I further argue that the majority of the variance in educational outcomes is associated with students, probably as much as 90% in developed economies. A substantial portion of this 90%, somewhere between 50% and 80% is due to differences in general cognitive ability or intelligence. Most importantly, as long as educational research fails to focus on students’ characteristics we will never understand education or be able to improve it.
Doug Detterman is a noble toiler in the field of intelligence, and has very probably read more papers on intelligence than anyone else in the world. He notes that the importance of student ability was known by Chinese administrators in 200 BC, and by Europeans in 1698.
The main reason people seem to ignore the research is that they concentrate on the things they think they can change easily and ignore the things they think are unchangeable.
Despite some experiments, the basics of teaching have not changed very much: the teacher presents stuff on a blackboard/projector screen which the students have to learn by looking at the pages of a book/screen, and then writing answers on a page/screen. By now you might have expected all lessons to have been taught by some computer driven correspondence tutorials, cheaply delivered remotely. There is some of that, but not as much as dreamed of decades ago.
Detterman reviews Coleman et al. (1966) and Jencks et al. (1972) which first brought to attention that 10% to 20% of variance in student achievement was due to schools and 80% to 90% due to students.He then look at more recent reviews of the same issue.
Gamoran and Long (2006) reviewed the 40 years of research following the Coleman report but also included data from developing countries. They found that for countries with an average per capita income above $16,000 the general findings of the Coleman report held up well. Schools accounted for a small portion of the variance. But for countries with lower per capita incomes the proportion of variance accounted for by schools is larger. Heyneman and Loxley (1983) had earlier found that the proportion of variance accounted for by poorer countries was related to the countries per capita income. This became known as the Heyneman-Loxley effect. A recent study by Baker, Goesling, and LeTendre (2002) suggests that the increased availability of schooling in poorer countries has decreased the Heyneman-Loxley effect so that these countries are showing school effects consistent with or smaller than those in the Coleman report.
The largest effect of schooling in the developing world is 40% of variance, and that includes “schooling” where children attend school inconsistently, and staff likewise.
After being destroyed during the Second World War, Warsaw came under control of a Communist government which allocated residents randomly to the reconstructed city, to eliminate cognitive differences by avoiding social segregation. The redistribution was close to random, so they expected that the Raven’s Matrices scores would not correlate with parental class and education, since the old class neighbourhoods had been broken up, and everyone attended the schools to which they had randomly been assigned. The authorities assumed that the correlation between student intelligence and the social class index of the home would be 0.0 but in fact it was R2= 0.97, almost perfect. The difference due to different schools was 2.1%. In summary, in this Communist heaven student variance accounted for 98% of the outcome.
Angoff and Johnson (1990) showed that the type of college or university attended by undergraduates accounted for 7% of the variance in GRE Math scores. Fascinatingly, a full 35% of students did not take up the offer from the most selective college they were admitted to, instead choosing to go to a less selective college. Their subsequent achievements were better predicted by the average SAT score of the college they turned down than the average SAT scores of the college they actually attended, the place where they received their teaching. Remember the Alma Mater you could have attended.
Twins attending the same classroom are about 8% more concordant than those with different teachers, which is roughly in line with the usual school effect of 10%.…
Given all that, why bother to chose a good school? Finding somewhere safe, friendly, and close to home could be important. Even if the particular school is not going to make a big scholastic difference, it can make a difference to satisfaction, belonging, and happiness. That is worth searching for.
Source: James Thompson, “Pity the Poor Teacher“, The Unz Review, July 1, 2019
Do bright people earn more than others? If not, it would strengthen the view that intelligence tests are no more than meaningless scores on paper and pencil tests composed of arbitrary items which have no relevance to real life.…
Dalliard argues that many of the low estimates for the correlation between intelligence and income are based on single year earning figures, and it is better to look at rolling averages over several years, and to note that very early in career and very late in career figures may be a poor reflection of overall career earnings. Better to calculate “permanent” earnings of the sort achieved between ages 25 and 55. He looks at NLSY79 data, wisely taking only earnings and wages (no welfare payments). Wages above the cutoff are set to the average of all wages above the cutoff. Using a log transform he shows that one additional IQ point predicts a 2.5% boost in income. The standardized effect size, or correlation, is 0.36 and the R squared is 13%.
Men’s income is more strongly related to intelligence:
For example, the expected permanent annual income of a man with an IQ of 100 is e^(8.004 + 0.027 * 100), or $44,530. The expected permanent annual income of a woman with the same IQ is e^(8.004 + 0.021 * 100), or $24,440.
Below, income by racial group, which should be compared with group differences in intelligence, with which there are close parallels.
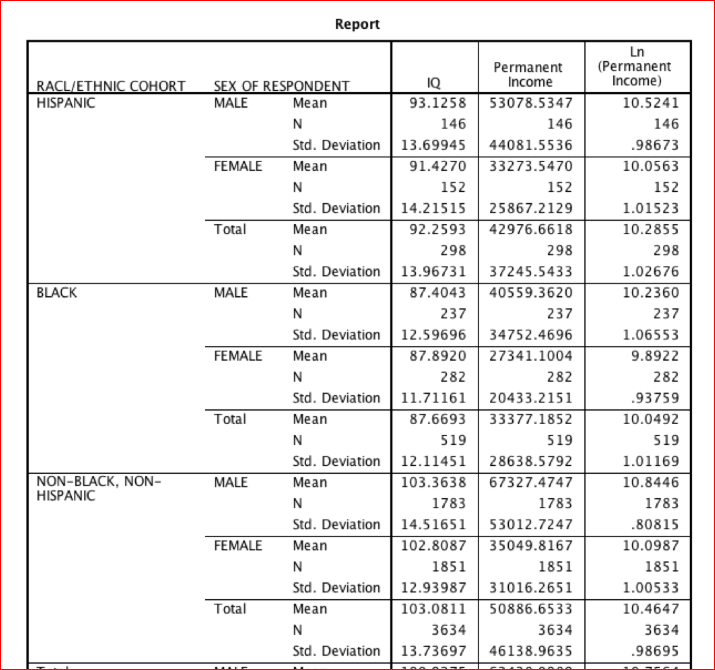
Looking at how to predict the effect of intelligence on each racial group, and interesting finding emerges:
Black men have a significantly lower intercept and a significantly higher slope coefficient: each additional IQ point predicts 3.6% (95% CI: 2.6%-4.5%) more income for black men.
This suggests that employers value intelligence, and pay higher wages for all brighter employees, an effect which is bigger in a group with a lower average ability level.
…
There are other studies which could be added, and more detail which can be explained in each of these sources, but I have picked a selection of studies to make a general point: I think it is pretty clear that intelligence has real-world implications.
Source: James Thompson, “The Wages of Intellect (2)“, The Unz Review, September 2, 2019 (See also Thompson’s “Family Fortunes” of September 9, 2019, and “Family Misfortunes” of September 17, 2019.)
Generational changes in IQ (the Flynn Effect) have been extensively researched and debated. Within the US, gains of 3 points per decade have been accepted as consistent across age and ability level, suggesting that tests with outdated norms yield spuriously high IQs. However, findings are generally based on small samples, have not been validated across ability levels, and conflict with reverse effects recently identified in Scandinavia and other countries. Using a well-validated measure of fluid intelligence, we investigated the Flynn Effect by comparing scores normed in 1989 and 2003, among a representative sample of American adolescents ages 13–18 (n = 10,073). Additionally, we examined Flynn Effect variation by age, sex, ability level, parental age, and SES. Adjusted mean IQ differences per decade were calculated using generalized linear models. Overall the Flynn Effect was not significant; however, effects varied substantially by age and ability level. IQs increased 2.3 points at age 13 (95% CI = 2.0, 2.7), but decreased 1.6 points at age 18 (95% CI = −2.1, −1.2). IQs decreased 4.9 points for those with IQ ≤ 70 (95% CI = −4.9, −4.8), but increased 3.5 points among those with IQ ≥ 130 (95% CI = 3.4, 3.6). The Flynn Effect was not meaningfully related to other background variables. Using the largest sample of US adolescent IQs to date, we demonstrate significant heterogeneity in fluid IQ changes over time. Reverse Flynn Effects at age 18 are consistent with previous data, and those with lower ability levels are exhibiting worsening IQ over time. Findings by age and ability level challenge generalizing IQ trends throughout the general population.
Jonathan M. Platt et al., “The Flynn Effect for Fluid IQ May Not Generalize to All Ages or Ability Levels: A Population-Based Study of 10,000 US Adolescents“,
Intelligence, Volume 77, November–December 2019
It takes a certain courage to title a paper: Genetic “General Intelligence,” Objectively Determined and Measured.
Javier de la Fuente, Gail Davies, Andrew D. Grotzinger, Elliot M. Tucker-Drob, Ian J. Deary
doi: https://doi.org/10.1101/766600
The authors … investigate the genetic contribution of g to variation in each of the cognitive tests. Genetic correlation is simply the correlation between the genetic contributors to each of the measured abilities. It is correlation at the level of genes, not test scores. If the brain is made up of modules, then one would expect such genetic correlations to be low. On the other hand, a brain largely based on general ability would have strong correlations. In fact, the genetic correlations range from .14 to .87, with a mean of .53 and the first principal component accounted for a total of 62.17% of the genetic variance. The genetics of intelligence is largely g based, it would seem….
So, have the authors “got away with” their combative title? The best way to answer would be to set the question “What else do you want?” The claim is that intelligence is real, and is a real aspect of the brain. To show that that is the case you can show a link between intelligence test scores and real life (this has been done many, many times, and some examples are shown below) and a link between intelligence test scores and implied measures of genetic heritability via twin and family studies (also done many times), and now finally a link between intelligence test scores broken up into general and specific factors and measures of heritability via actual genomic studies identifying locations for general and specific factors of intelligence.
Here are some correlations between intelligence and real life measures
https://archive.ph/PCvgk
…
In my view this is a very important advance. It shows an underlying reality, at a genetic level, between general and specific aspects of cognitive ability. It allows investigations to proceed at two levels: the test score level and the genomic code level. Further studies will drill down into yet more detail.
It is fair to say that this is an objective approach, and ought to answer any reasonable critic of the reality of cognitive ability being based on brains which are under substantial genetic control.
Source: James Thompson, “Intelligence, Objectively“, The Unz Review, September 25, 2019
You know the story, but here we go again. The standard account of sex differences in intelligence is that there aren’t any. Or not significant ones, or perhaps some slight ones, but they counter-balance each other. The standard account usually goes on to concede that males are more variable than females, that is to say, they are more widely dispersed around the mean. Although this is an oft-repeated finding, in some circles it is still referred to a merely a hypothesis. There is a standardisation sample in Ro mania which did not show this difference, and others epidemiological samples where the differences are slight, but usual finding is that men show a wider standard deviation of ability.
Against this orthodoxy, Irwing and Lynn (2006) have argued that boys and girls mature at different speeds, with girls ahead till about age 16 and with boys moving ahead thereafter, such that men are 2-4 IQ points ahead of women throughout adult life.
https://www.unz.com/jthompson/men-4-points-ahead/
Lynn further argues that if men are 4 points ahead, and have a standard deviation of 15 as opposed to women’s standard deviation of 14, those two findings almost fully explain the higher number of men in intellectually demanding occupations. There is no glass ceiling. Fewer women are capable of the higher levels required for the glittering prizes. Furthermore, this explains why men know more things. At the very highest levels of ability there are more men, and they have more knowledge, which is why they win general knowledge competitions.
https://www.unz.com/jthompson/sex-on-the-brain/
This, the seditious faction suggest, is just a fact of sexual dimorphism. Male brains are very, very much bigger than women’s, and each of the component regions of the male brain are bigger than the same regions in women, and also more variable in size.
Standardization samples ought to be good, and often are so, but they are not as good as birth cohorts or major epidemiological samples, so the latter are to be favoured when looking for reliable sex differences.
However, here is another paper on standardization samples confirming the same pattern of male advantage, though not greater male variability in one of the samples.
Sex Differences on the WAIS-III in Taiwan and the United States
Hsin-Yi Chen and Richard Lynn. Pages 324-328.
https://drive.google.com/file/d/1N3qokmbgctVMktN5pU8dUbrzMmHns1CJ/view?usp=sharing
Sex differences are reported in the standardization samples of the WAIS-III in Taiwan and the United States. In Taiwan, men obtained a significantly higher Full Scale IQ than women of 4.35 IQ points and in the United States men obtained a significantly higher Full Scale IQ than women of 2.78 IQ points. The sex differences on the 14 subtests are generally similar with a correlation between the two of .65. In the Taiwan sample there were no consistent sex differences in variability.
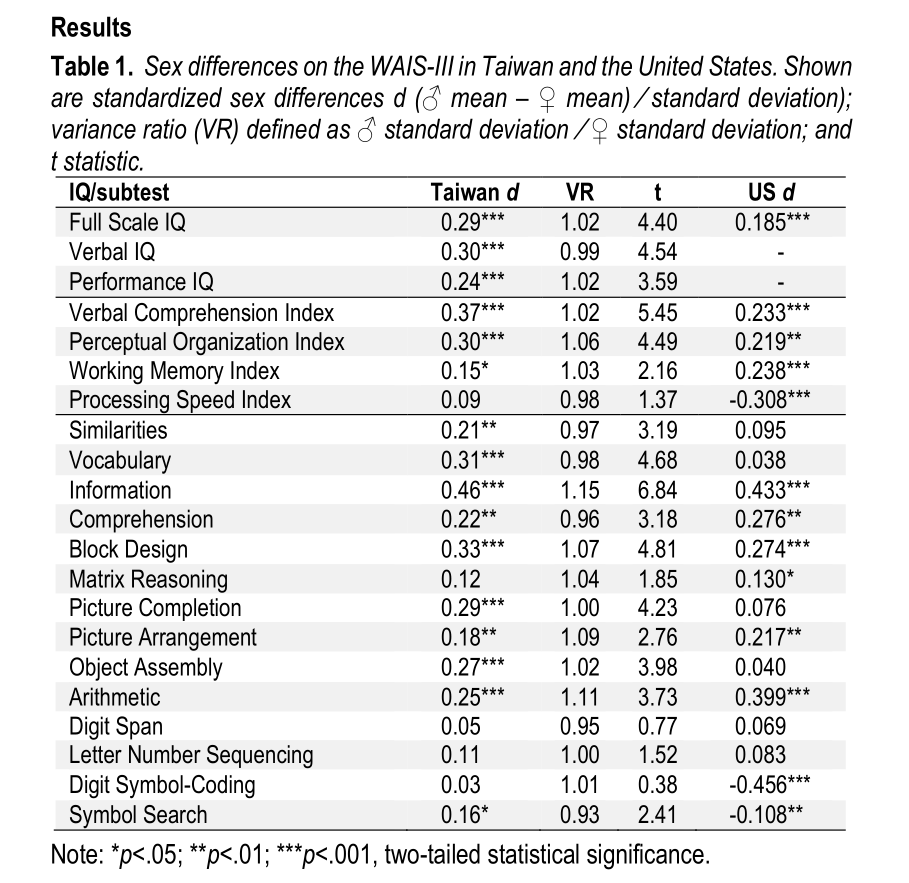
The authors say:
There are three points of interest in the results. First, in the Taiwan sample males obtained a higher Full Scale IQ of .29d, the equivalent of 4.35 IQ points. This confirms the thesis advanced by Lynn (1994, 1998, 1999) that in adults, males have a higher average IQ than females of around 4-5 IQ points. Males obtained a higher Full Scale IQ in the American standardization sample of the WAIS-III of .185d (2.78 IQ points). These two results disconfirm the assertions of Haier et al. (2004) and Halpern (2012) that “Comparisons of general intelligence assessed with standard measures like the WAIS show essentially no differences between men and women” (Halpern, 2012, p. 115).
Second, the sex differences in the Taiwan and American WAIS-III are generally similar. On the 14 subtests the correlation between the two is .65 (p <.001). Thus, in both samples men obtained their greatest advantage on Information and their lowest advantage on Digit Symbol – Coding.
Third, there was no consistent sex difference in variability. On the Taiwan Full Scale IQ the VR of 1.02 is negligible, and males had greater variability in 9 of the 14 subtests while females had greater variability in 5 of the subtests. These results do not confirm the greater variability of males reported in numerous previous studies e.g., Arden and Plomin (2006) and Dykiert, Gale and Deary (2009).
This study, on the gold standard Wechsler test, seems to confirm a male advantage in general intelligence. As discussed, standardisation samples are designed to be an excellent representation of the population on which the test will be used (with changes to make it culturally accurate), and there is no reason to believe that this balanced selection would favour males. Birth samples would be even better, but this is a good test of the male advantage proposal.
The Information subtest is a measure of very general General Knowledge, not requiring any specialist interests, but asking about the things which would generally be known in the general population. A .44 sd advantage on this subtest is enormous. The greater male representation in high level general knowledge competitions seems well founded. On the US sample there is almost as big a male advantage for Maths, and a large deficit for the digit symbol coding task, which measures simple processing speed.
The lack of a greater standard deviation in the Taiwanese sample goes against the general finding, as did the standardisation sample for Romania. Standardisation samples are not as representative as larger epidemiological surveys, but it is interesting nonetheless, in that it suggests some sampling restriction.
Source: James Thompson, “Sex Differences, Again“, The Unz Review, January 12, 2021
We know from twin studies that intelligence is heritable, and genome-wide association studies are trying to identify the genes responsible for this result. (We know that genetics is powerful in real life, now we need to show it in theory). Part of the problem is that larger studies have put together results from disparate tests, so [Robert Plomin’s] team has designed a 40 item intelligence game which produces a reliable (internal consistency = .78, two week retest reliability = .88) measure of g which they have given to 4,751 young adults from their twin study.
This very big sample of 4,751 25-year-olds shows significant sex differences in favour of men. The authors don’t comment on this, but it fits the emerging pattern of a male intellectual advantage in adulthood.…
The summary is that the team have created a good new 15-minute IQ test which correlates well with the many longer assessments used over the years on their very large sample of twins. It also has good predictive power. If more widely adopted, and the few bits of explanatory English language translated into other languages, it could be a very useful contribution to large GWAS investigation of the genetic basis of intelligence.
Source: James Thompson, “Game On: Pathfinder“, The Unz Review, August 14, 2021
Heritability studies cannot show definitively that race differences in intelligence have a genetic cause. It is always possible that there is some hidden environmental factor(s) – a so-called “X factor,” analogous to nitrates in the corn example – that explains differences between – but not within – races (an X factor that explains the Black–White IQ gap would have to affect all Blacks equally in order to preserve high heritability and shift the population mean downwards without changing the variance). Nevertheless, the high within-group heritability of IQ can be part of a package of evidence for between-group heritability. This point was made by Jensen (1969), who was widely misunderstood as naively inferring between- from within-group heritability (see Sesardic, 2005, pp. 128–138). Expounding on Jensen’s argument, Flynn (1980) writes that “the probability of a genetic hypothesis will be much enhanced if, in addition to evidencing high [heritability] estimates, we find we can falsify literally every plausible environmental hypothesis [i.e., X factor] one by one” (p. 40; quoted in Sesardic, 2005, p. 136). The obvious candidate X factor that could explain race differences is, of course, racism. If racism lowers IQ, this could explain why the mean is shifted downwards for victimized groups. However, as Flynn argues, attributing differences to racism
is simply an escape from hard thinking and hard research. Racism is not some magic force that operates without a chain of causality. Racism harms people because of its effects and when we list those effects, lack of confidence, low self-image, emasculation of the male, the welfare mother home, poverty, it seems absurd to claim that any one of them does not vary significantly within both black and white America. (Flynn, 1980, p. 60; quoted in Sesardic, 2005, pp. 141–142)
Now, after decades of intensive searching, the X factor remains elusive. The adult Black–White IQ gap has remained stubbornly constant at approximately one standard deviation (15 IQ points) among cohorts born since around 1970 (Murray, 2007). Dickens and Flynn (2006) report that “Blacks gained 4 to 7 IQ points on non-Hispanic Whites between 1972 and 2002” (p. 913), but these gains appear to be among Blacks born before the early seventies. Dickens and Flynn (2006, Figure 3) indicate that, in 2002, the Black–White IQ gap in among 20-year-olds was approximately one standard deviation, or 15 points. Nisbett (2017) writes that “Dickens and Flynn found [the Black–White gap in IQ to be] around 9.5 points,” but this is only the gap if we include children (as R. Nisbett confirmed in a personal communication, December 24, 2018). More recent evidence indicates that the gap has persisted or even widened. Frisby and Beaujean (2015, Table 8) find a Black–White IQ gap of 1.16 standard deviations among a population-representative sample of adults used to norm the Wechsler Adult Intelligence Scale IV in 2007. Intensive interventions can raise IQ substantially during childhood when the heritability of IQ is low. But despite some misleading claims about the success of early intervention programs, gains tend to dissolve by late adolescence or early adulthood (Baumeister & Bacharach, 2000; Lipsey, Farran, & Durkin, 2018; Protzko, 2015). Adoption by white families – one of the most extreme interventions possible – has virtually no effect on the IQ of black adoptees by adulthood. Black children adopted by middle- and upper-middle-class white families in Minnesota obtained IQ scores at age 17 that were roughly identical to the African American average. Adoptees with one black biological parent obtained IQ scores that were intermediate between the black and white means (Loehlin, 2000, Table 9.3).2
To reiterate, the high within-group heritability of IQ combined with the failure to find an environmental X factor to explain the IQ gap does not show decisively that race differences are genetic, because it is possible that an X factor will be discovered in the future. However, the environmentalist theory of race differences has not, by normal scientific standards, been an especially progressive research program (in the sense of Lakatos, 1970). Environmentalists never predicted that the Black–White IQ gap would, after reaching one standard deviation, remain impervious to early education, adoption, massive improvements in the socioeconomic status of Blacks, and the (apparent) waning of overt racism and discrimination. Commenting 45 years ago on environmentalist theories that appeal to an X factor, Urbach (1974) noted that “any data in the world can be made consistent with any theory by invoking nameless and untested factors” (p. 134). Nevertheless, we cannot technically say that the environmentalist explanation for the IQ gap has been falsified. The fact that the gap did narrow since the early twentieth century gives some credibility to the idea that environment is playing a role.
Let us turn to the second method for investigating the role of genes in development: genome-wide association studies (GWAS). Unlike heritability studies, GWAS can uncover specific genetic variants – or single-nucleotide polymorphisms (SNPs) – associated with IQ. In just the last couple years, GWAS has identified hundreds of such SNPs (Davies et al., 2018; Savage et al., 2018; Sniekers et al., 2017), which together explain around 11% of the variance in IQ (Allegrini et al., 2019).
If we find that the SNPs implicated in IQ are differentially distributed across racial groups, this would not necessarily imply that race differences in intelligence are genetic. SNPs might have different effects across races and environments due to gene–gene and gene–environment interactions. SNPs with no causal relation to intelligence can be genetically linked to SNPs that do have a causal relation in some populations but not others, so SNP–intelligence correlations may not always hold across races (Rosenberg, Edge, Pritchard, & Feldman, 2019). But if we find that many of the same SNPs predict intelligence in different racial groups, a risky prediction made by the hereditarian hypothesis will have passed a crucial test. Even then, however, GWAS will only establish a correlation between SNPs and IQ without revealing the causal chain linking SNP to phenotype. It would still be theoretically possible that these SNPs lead to differences in intelligence as a consequence of environmental factors (e.g., parenting effects) that can be manipulated so as to eliminate race differences. But if work on the genetics and neuroscience of intelligence becomes sufficiently advanced, it may soon become possible to give a convincing causal account of how specific SNPs affect brain structures that underlie intelligence (Haier, 2017). If we can give a biological account of how genes with different distributions lead to race differences, this would essentially constitute proof of hereditarianism. As of now, there is nothing that would indicate that it is particularly unlikely that race differences will turn out to have a substantial genetic component. If this possibility cannot be ruled out scientifically, we must face the ethical question of whether we ought to pursue the truth, whatever it may be.
Source: Nathan Cofnas, “Research on Group Differences in Intelligence: A Defense of Free Inquiry”, Philosophical Psychology, Volume 33 2020 — Issue 1
As you may have noticed, it is not popular to suggest that genetics is a possible cause of individual differences, and distinctly unpopular to even hint that it might be a cause of genetic group differences….
Well, if facts exist, someone will notice them and, if brave, find a way of letting people know what they have noticed.
A Multimodal MRI-based Predictor of Intelligence and Its Relation to Race/Ethnicity. Emil O. W. Kirkegaard and John G.R. Fuerst. The Mankind Quarterly · March 2023.
DOI: 10.46469/mq.2023.63.3.2
https://drive.google.com/file/d/1iVjNT1Uv9fC3uZzwBPpVQDRGWbmiPXoV/view?usp=sharing
What have they found?
They say:
We used data from the Adolescent Brain Cognitive Development Study to create a multimodal MRI-based predictor of intelligence. We applied the elastic net algorithm to over 50,000 neurological variables. We find that race can confound models when a multiracial training sample is used, because models learn to predict race and use race to predict intelligence.
When the model is trained on non-Hispanic Whites only, the MRI-based predictor has an out-of-sample model accuracy of r = .51, which is 3 to 4 times greater than the validity of whole brain volume in this dataset. This validity generalized across the major socially-defined racial/ethnic groupings (White, Black, and Hispanic). There are race gaps on the predicted scores, even though the model is trained on White subjects only.This predictor explains about 37% of the relation between both the Black and Hispanic classification and intelligence.
So, by looking at all the MRI measures they can predict IQ better than by using brain size alone. So, we should stop using the brain size measure (about 0.28) and move to this better measure (0.51) and eventually the even better ones that may be found later.
First of all, some summary data:
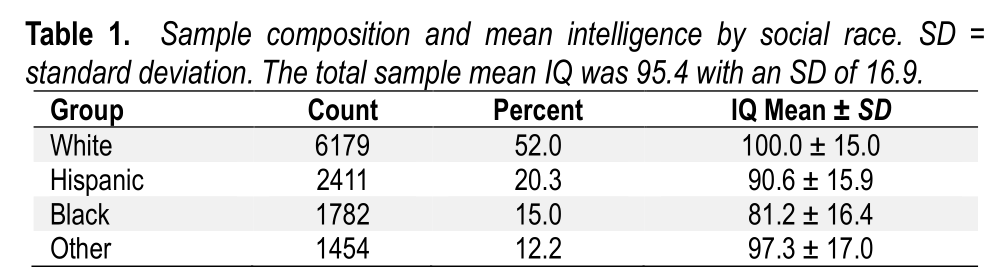
These are adolescents, so things may change a bit with age, but these are good sample sizes. Black adolescents have a somewhat lower than expected low score, and a high standard deviation, the latter surprisingly so, since many previous black samples have a standard deviation of 13. I don’t know how to interpret this, but it might be due to the subtests used.
The intelligence tests used were not the best sample of skills (where were Maths, or Wechsler Vocabulary or Block Design?) and they over-represented working memory tests, which I think are weak measures, though fashionable. It may account for the large standard deviation finding. I predict that a more representative range of tests would lead to even higher predictive accuracy overall, and perhaps lower standard deviations.
The learning algorithm they employed was one suitable for use in the tricky setting where there are far more variables than individual subjects. When you apply the algorithm to the whole sample, leaving aside race, then the correlation with IQ is 0.60 which is very high. Using this technique, a brain image gives a good guide to the power of the brain as a problem-solving organ.
Using an MRI-based predictive equation the authors did a better job of predicting a person’s IQ than was possible from knowing their parent-described race, despite the racial differences in intelligence being large. These “social race” labels were redundant for the purposes of predicting intelligence.
The correlations of MRI prediction with actual intelligence test results within each social race were pretty similar: white 0.51, black 0.53, Hispanic 0.54 and other 0.58.
They tried to see if their algorithm could use MRI data to predict the social race of the adolescents, and found they could do so with 73% accuracy. The distinction between blacks and whites could be drawn with almost complete accuracy, only a 2% error rate either way.
They then trained a model to predict genetic ancestry. You might want to call this race.
They say:
We find that MRI-based predictions of genetic ancestry are very accurate. The three correlations of interest are .91, .89, and .61, for European, African, and Amerindian ancestry, respectively. As expected, the correlations were higher for European and African ancestry than for White and Black social race, respectively.
So, you can study a brain image and predict the person’s race with very high accuracy.
A possible counter-argument is that the model has learned to spot race, and then sharpens its intelligence predictors. The authors decided to test a predictive equation for whites only, so as to cut out this possible confounder. In fact, it only goes down from 0.51 on the full dataset to 0.48 for whites only.
As usual, I have left out some of the additional tests carried out to make sure the findings were robust.
the model learned to predict subjects’ social race/genetic ancestry based on the MRI data, and then used this information to predict intelligence. This finding is consistent with those of Gichoya et al. (2022), who report that machine learning can recognize self-reported race/ethnicity from a wide variety of medical imaging data. This is unsurprising because in the USA, socially identified race closely tracks continental genetic ancestry (Kirkegaard et al., 2021; Tang et al., 2005), which certainly is not “only skin deep”.
We further analyzed which aspects of MRI data were most useful in the prediction of intelligence. We found that functional MRI (fMRI) task data, which measures blood flow while performing tasks, had the highest validity for predicting intelligence. Additionally, MRI datasets which had more variables, which showed larger race differences, and which had higher correlations with polygenic scores, had higher validities.
So, what can we conclude here? Using a statistical technique to study the many scores produced by magnetic resonance images, it is possible to predict the subject’s intelligence and their race with high accuracy. The predictive equations work for all races, so they have not been damaged by some presumed test bias. Some of the MRI measures are more predictive than others, (these tasks are not used to calculate IQ scores), which are measuring something about brain flow in the brain as tasks are carried out.
All this is brain deep, not skin deep.
Is there anywhere left for blank slate-ists to hide? They had trouble accepting that intelligence was heritable within genetic groups. After many decades of research some (but by no means all) made a grudging admission that heredity accounted for something. Then they argued that heredity was weaker in lower socio-economic-status groups. That was eventually shown to be unlikely, though the debate has been long and hard, so not all researchers accept that finding. Throughout, blank slate-ists denied that genetics could explain genetic group differences. They argued that each race showed the effects of heredity within race, but none between races (or not more than a bare 5%). They claimed that observed differences must (95% of them) be due to environmental differences, including those which are hard to detect, but have powerful effects. Will this paper change their minds? I think not. Not for 50 years, anyway.
This paper makes a simple point: brains differ between races, and these differences relate to differences in intelligence.
Source: James Thompson, “Not Unreasonable: Racial Differences Are Brain Deep”, The Unz Review, March 31, 2023
