“Not-So-Random Thoughts” is an occasional series in which I highlight writings by other commentators on varied subjects that I have addressed in the past. Other entries in the series can be found at these links: I, II, III, IV, V, VI, VII, VIII, IX, X, XI, XII, XIII, XIV, XV, XVI, XVII, XVIII, XIX, XX, XXI, XXII, XXIII, and XXIV. For more in the same style, see “The Tenor of the Times” and “Roundup: Civil War, Solitude, Transgenderism, Academic Enemies, and Immigration“.
CONTENTS
The Real Unemployment Rate and Labor-Force Participation
There was much celebration (on the right, at least) when it was announced that the official unemployment rate, as of November, is only 3.5 percent, and that 266,000 jobs were added to the employment rolls (see here, for example). The exultation is somewhat overdone. Yes, things would be much worse if Obama’s anti-business rhetoric and policies still prevailed, but Trump is pushing a big boulder of deregulation uphill.
In fact, the real unemployment rate is a lot higher than official figure I refer you to “Employment vs. Big Government and Disincentives to Work“. It begins with this:
The real unemployment rate is several percentage points above the nominal rate. Officially, the unemployment rate stood at 3.5 percent as of November 2019. Unofficially — but in reality — the unemployment rate was 9.4 percent.
The explanation is that the labor-force participation rate has declined drastically since peaking in January 2000. When the official unemployment rate is adjusted to account for that decline (and for a shift toward part-time employment), the result is a considerably higher real unemployment rate.
Arnold Kling recently discussed the labor-force participation rate:
[The] decline in male labor force participation among those without a college degree is a significant issue. Note that even though the unemployment rate has come down for those workers, their rate of labor force participation is still way down.
Economists on the left tend to assume that this is due to a drop in demand for workers at the low end of the skill distribution. Binder’s claim is that instead one factor in declining participation is an increase in the ability of women to participate in the labor market, which in turn lowers the advantage of marrying a man. The reduced interest in marriage on the part of women attenuates the incentive for men to work.
Could be. I await further analysis.
Is Partition Possible?
Angelo Codevilla peers into his crystal ball:
Since 2016, the ruling class has left no doubt that it is not merely enacting chosen policies: It is expressing its identity, an identity that has grown and solidified over more than a half century, and that it is not capable of changing.
That really does mean that restoring anything like the Founders’ United States of America is out of the question. Constitutional conservatism on behalf of a country a large part of which is absorbed in revolutionary identity; that rejects the dictionary definition of words; that rejects common citizenship, is impossible. Not even winning a bloody civil war against the ruling class could accomplish such a thing.
The logical recourse is to conserve what can be conserved, and for it to be done by, of, and for those who wish to conserve it. However much force of what kind may be required to accomplish that, the objective has to be conservation of the people and ways that wish to be conserved.
That means some kind of separation.
As I argued in “The Cold Civil War,” the natural, least stressful course of events is for all sides to tolerate the others going their own ways. The ruling class has not been shy about using the powers of the state and local governments it controls to do things at variance with national policy, effectively nullifying national laws. And they get away with it.
For example, the Trump Administration has not sent federal troops to enforce national marijuana laws in Colorado and California, nor has it punished persons and governments who have defied national laws on immigration. There is no reason why the conservative states, counties, and localities should not enforce their own view of the good.
Not even President Alexandria Ocasio-Cortez would order troops to shoot to re-open abortion clinics were Missouri or North Dakota, or any city, to shut them down. As Francis Buckley argues in American Secession: The Looming Breakup of the United States, some kind of separation is inevitable, and the options regarding it are many.
I would like to believe Mr. Codevilla, but I cannot. My money is on a national campaign of suppression, which will begin the instant that the left controls the White House and Congress. Shooting won’t be necessary, given the massive displays of force that will be ordered from the White House, ostensibly to enforce various laws, including but far from limited to “a woman’s right to an abortion”. Leftists must control everything because they cannot tolerate dissent.
As I say in “Leftism“,
Violence is a good thing if your heart is in the “left” place. And violence is in the hearts of leftists, along with hatred and the irresistible urge to suppress that which is hated because it challenges leftist orthodoxy — from climate skepticism and the negative effect of gun ownership on crime to the negative effect of the minimum wage and the causal relationship between Islam and terrorism.
There’s more in “The Subtle Authoritarianism of the ‘Liberal Order’“; for example:
[Quoting Sumantra Maitra] Domestically, liberalism divides a nation into good and bad people, and leads to a clash of cultures.
The clash of cultures was started and sustained by so-called liberals, the smug people described above. It is they who — firmly believing themselves to be smarter, on the the side of science, and on the side of history — have chosen to be the aggressors in the culture war.
Hillary Clinton’s remark about Trump’s “deplorables” ripped the mask from the “liberal” pretension to tolerance and reason. Clinton’s remark was tantamount to a declaration of war against the self-appointed champion of the “deplorables”: Donald Trump. And war it has been. much of it waged by deep-state “liberals” who cannot entertain the possibility that they are on the wrong side of history, and who will do anything — anything — to make history conform to their smug expectations of it.
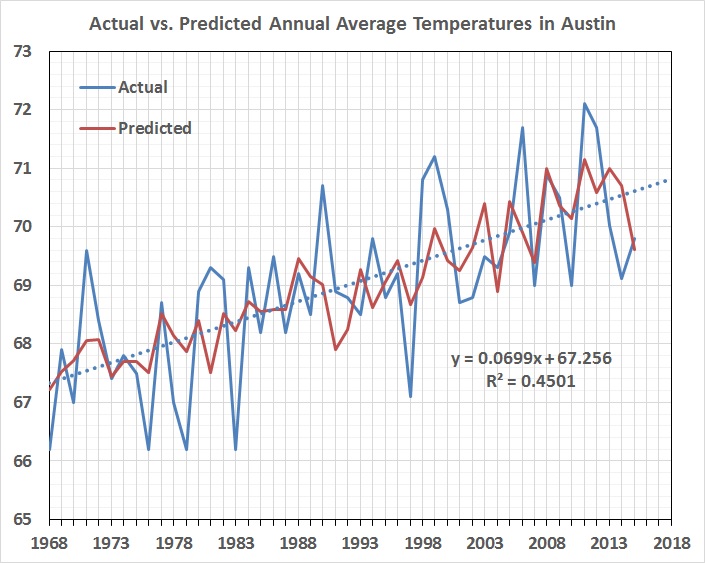
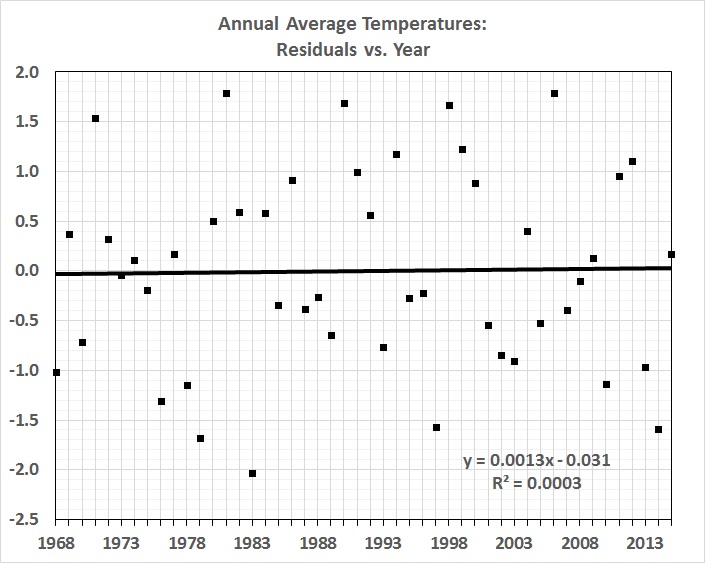
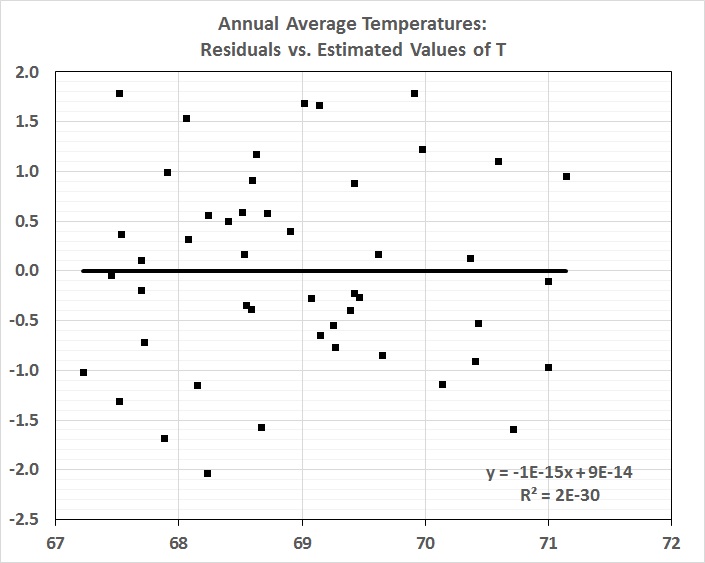
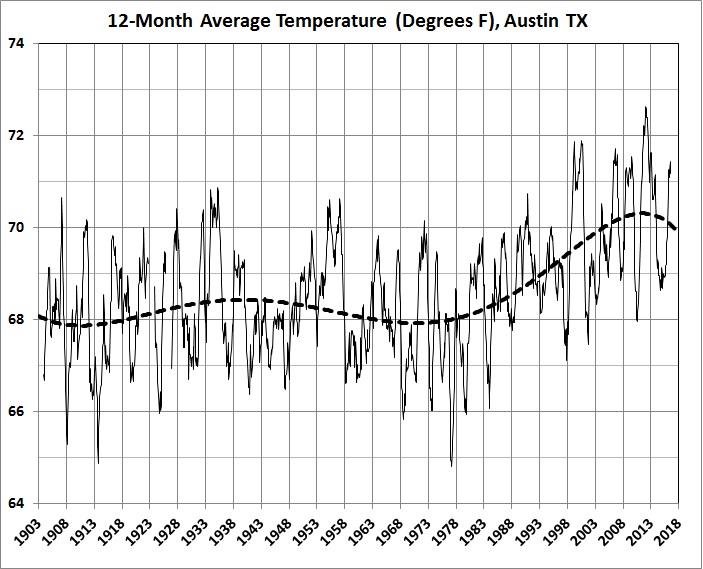
Still More Evidence for Why I Don’t Believe in “Climate Change”
This is a sequel to an item in the previous edition of this series: “More Evidence for Why I Don’t Believe in Climate Change“.
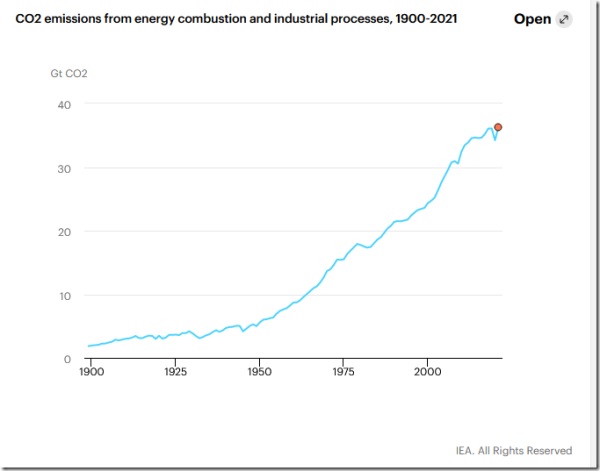
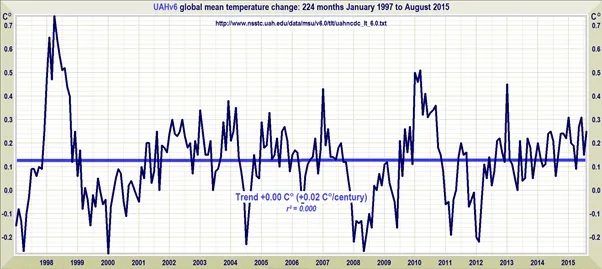
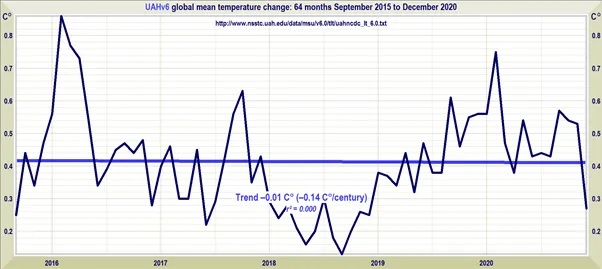
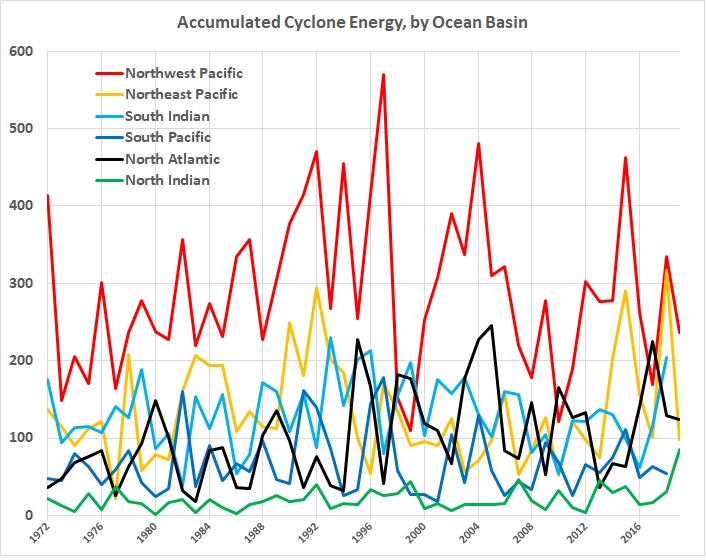
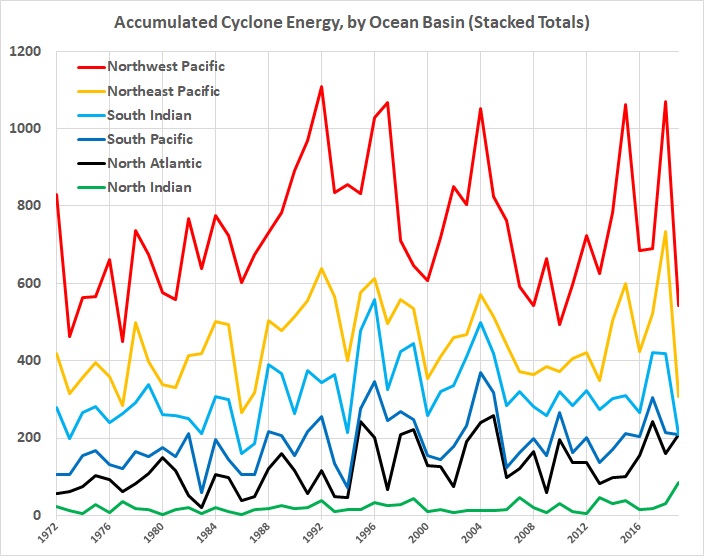
Dave Middleton debunks the claim that 50-year-old climate models correctly predicted the susequent (but not steady) rise in the globe’s temperature (whatever that is). He then quotes a talk by Dr. John Christy of the University of Alabama-Huntsville Climate Research Center:
We have a change in temperature from the deep atmosphere over 37.5 years, we know how much forcing there was upon the atmosphere, so we can relate these two with this little ratio, and multiply it by the ratio of the 2x CO2 forcing. So the transient climate response is to say, what will the temperature be like if you double CO2– if you increase at 1% per year, which is roughly what the whole greenhouse effect is, and which is achieved in about 70 years. Our result is that the transient climate response in the troposphere is 1.1 °C. Not a very alarming number at all for a doubling of CO2. When we performed the same calculation using the climate models, the number was 2.31°C. Clearly, and significantly different. The models’ response to the forcing – their ∆t here, was over 2 times greater than what has happened in the real world….
There is one model that’s not too bad, it’s the Russian model. You don’t go to the White House today and say, “the Russian model works best”. You don’t say that at all! But the fact is they have a very low sensitivity to their climate model. When you look at the Russian model integrated out to 2100, you don’t see anything to get worried about. When you look at 120 years out from 1980, we already have 1/3 of the period done – if you’re looking out to 2100. These models are already falsified [emphasis added], you can’t trust them out to 2100, no way in the world would a legitimate scientist do that. If an engineer built an aeroplane and said it could fly 600 miles and the thing ran out of fuel at 200 and crashed, he might say: “I was only off by a factor of three”. No, we don’t do that in engineering and real science! A factor of three is huge in the energy balance system. Yet that’s what we see in the climate models….
Theoretical climate modelling is deficient for describing past variations. Climate models fail for past variations, where we already know the answer. They’ve failed hypothesis tests and that means they’re highly questionable for giving us accurate information about how the relatively tiny forcing … will affect the climate of the future.
For a lot more in this vein, see my pages “Climate Change” and “Modeling and Science“.
Transgenderism, Once More
Theodore Dalrymple (Anthony Daniels, M.D.) is on the case:
The problem alluded to in [a paper in the Journal of Medical Ethics] is, of course, the consequence of a fiction, namely that a man who claims to have changed sex actually has changed sex, and is now what used to be called the opposite sex. But when a man who claims to have become a woman competes in women’s athletic competitions, he often retains an advantage derived from the sex of his birth. Women competitors complain that this is unfair, and it is difficult not to agree with them….
Man being both a problem-creating and solving creature, there is, of course, a very simple way to resolve this situation: namely that men who change to simulacra of women should compete, if they must, with others who have done the same. The demand that they should suffer no consequences that they neither like nor want from the choices they have made is an unreasonable one, as unreasonable as it would be for me to demand that people should listen to me playing the piano though I have no musical ability. Thomas Sowell has drawn attention to the intellectual absurdity and deleterious practical consequences of the modern search for what he calls “cosmic justice.”…
We increasingly think that we live in an existential supermarket in which we pick from the shelf of limitless possibilities whatever we want to be. We forget that limitation is not incompatible with infinity; for example, that our language has a grammar that excludes certain forms of words, without in any way limiting the infinite number of meanings that we can express. Indeed, such limitation is a precondition of our freedom, for otherwise nothing that we said would be comprehensible to anybody else.
That is a tour de force typical of the good doctor. In the span of three paragraphs, he addresses matters that I have treated at length in “The Transgender Fad and Its Consequences” (and later in the previous edition of this series), “Positive Rights and Cosmic Justice“, and “Writing: A Guide” (among other entries at this blog).
Big, Bad Oligopoly?
Big Tech is giving capitalism a bad name, as I discuss in “Why Is Capitalism Under Attack from the Right?“, but it’s still the best game in town. Even oligopoly and its big brother, monopoly, aren’t necessarily bad. See, for example, my posts, “Putting in Some Good Words for Monopoly” and “Monopoly: Private Is Better than Public“. Arnold Kling makes the essential point here:
Do indicators of consolidation show us that the economy is getting less competitive or more competitive? The answer depends on which explanation(s) you believe to be most important. For example, if network effects or weak resistance to mergers are the main factors, then the winners from consolidation are quasi-monopolists that may be overly insulated from competition. On the other hand, if the winners are firms that have figured out how to develop and deploy software more effectively than their rivals, then the growth of those firms at the expense of rivals just shows us that the force of competition is doing its work.
Why I Am Bunkered in My Half-Acre of Austin
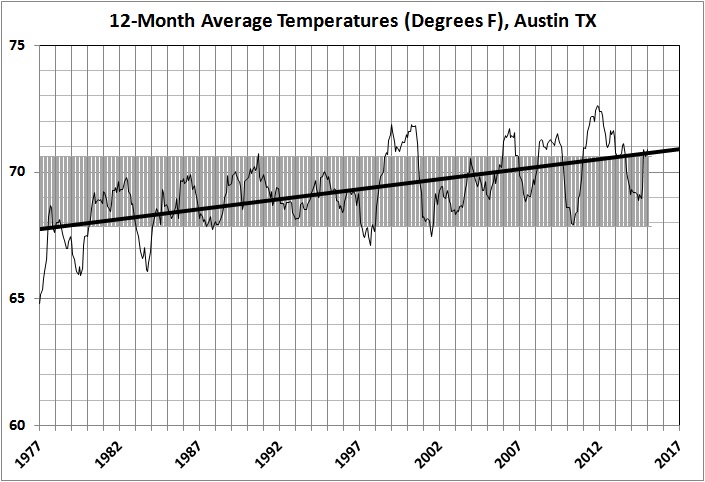
Randal O’Toole takes aim at the planners of Austin, Texas, and hits the bullseye:
Austin is one of the fastest-growing cities in America, and the city of Austin and Austin’s transit agency, Capital Metro, have a plan for dealing with all of the traffic that will be generated by that growth: assume that a third of the people who now drive alone to work will switch to transit, bicycling, walking, or telecommuting by 2039. That’s right up there with planning for dinner by assuming that food will magically appear on the table the same way it does in Hogwarts….
[W]hile Austin planners are assuming they can reduce driving alone from 74 to 50 percent, it is actually moving in the other direction….
Planners also claim that 11 percent of Austin workers carpool to work, an amount they hope to maintain through 2039. They are going to have trouble doing that as carpooling, in fact, only accounted for 8.0 percent of Austin workers in 2018.
Planners hope to increase telecommuting from its current 8 percent (which is accurate) to 14 percent. That could be difficult as they have no policy tools that can influence telecommuting.
Planners also hope to increase walking and bicycling from their current 2 and 1 percent to 4 and 5 percent. Walking to work is almost always greater than cycling to work, so it’s difficult to see how they plan to magic cycling to be greater than walking. This is important because cycling trips are longer than walking trips and so have more of a potential impact on driving.
Finally, planners want to increase transit from 4 to 16 percent. In fact, transit carried just 3.24 percent of workers to their jobs in 2018, down from 3.62 percent in 2016. Changing from 4 to 16 percent is a an almost impossible 300 percent increase; changing from 3.24 to 16 is an even more formidable 394 percent increase. Again, reality is moving in the opposite direction from planners’ goals….
Planners have developed two main approaches to transportation. One is to estimate how people will travel and then provide and maintain the infrastructure to allow them to do so as efficiently and safely as possible. The other is to imagine how you wish people would travel and then provide the infrastructure assuming that to happen. The latter method is likely to lead to misallocation of capital resources, increased congestion, and increased costs to travelers.
Austin’s plan is firmly based on this second approach. The city’s targets of reducing driving alone by a third, maintaining carpooling at an already too-high number, and increasing transit by 394 percent are completely unrealistic. No American city has achieved similar results in the past two decades and none are likely to come close in the next two decades.
Well, that’s the prevailing mentality of Austin’s political leaders and various bureaucracies: magical thinking. Failure is piled upon failure (e.g., more bike lanes crowding out traffic lanes, a hugely wasteful curbside composting plan) because to admit failure would be to admit that the emperor has no clothes.
You want to learn more about Austin? You’ve got it:
Driving and Politics (1)
Life in Austin (1)
Life in Austin (2)
Life in Austin (3)
Driving and Politics (2)
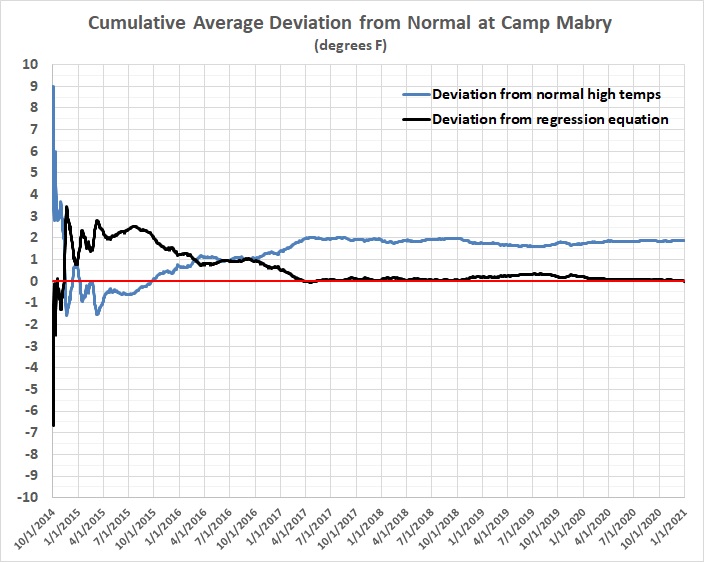
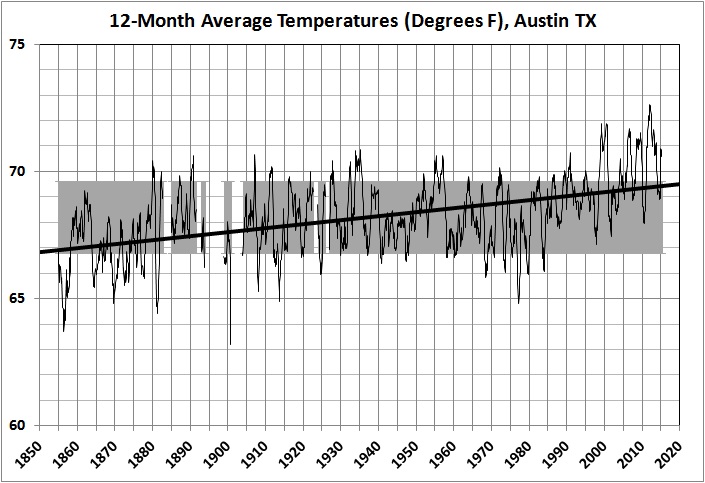
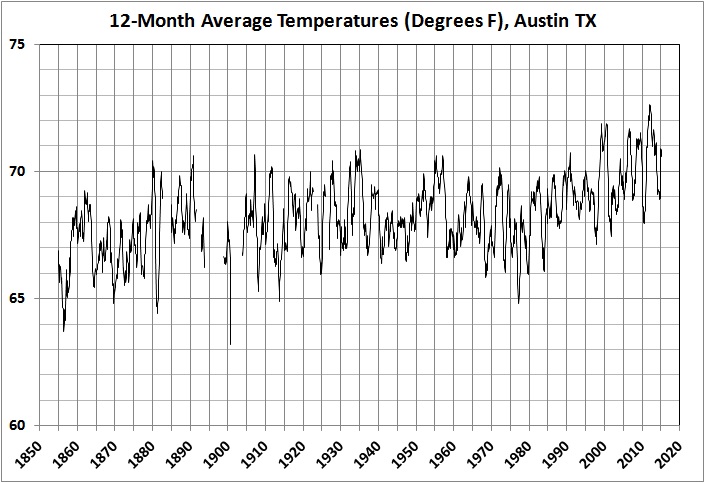
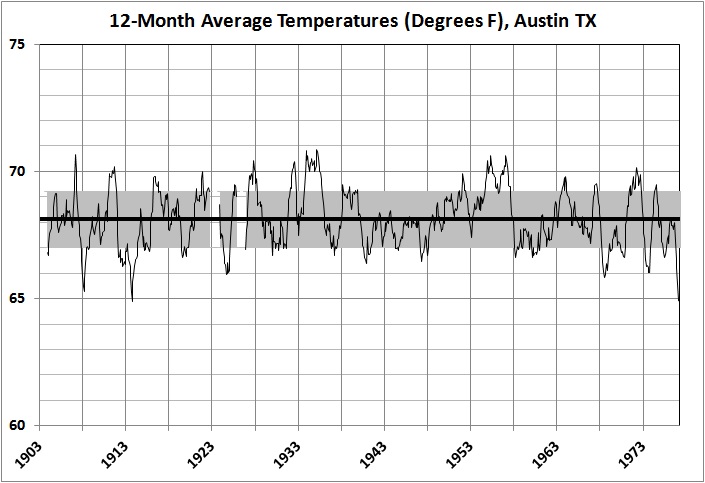
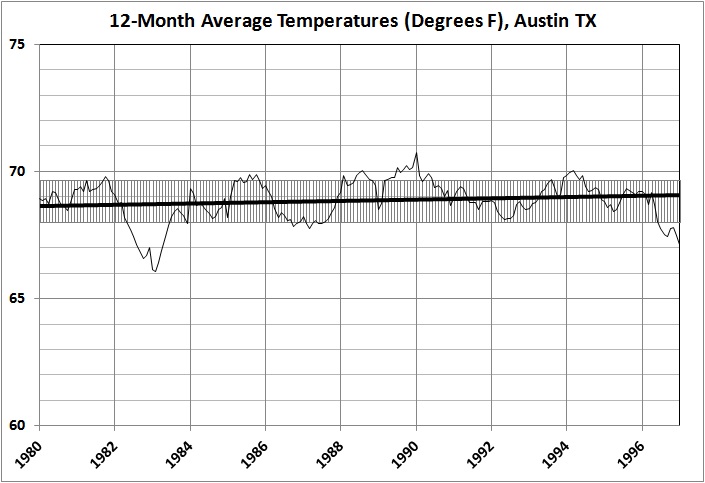
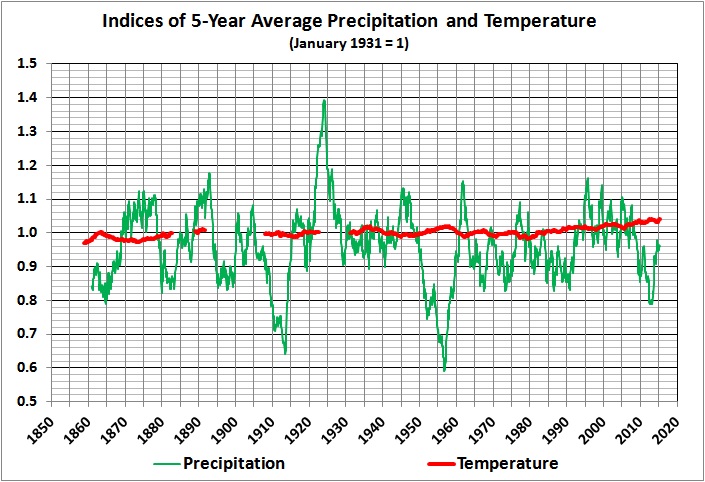
AGW in Austin?
Democracy in Austin
AGW in Austin? (II)
The Hypocrisy of “Local Control”
Amazon and Austin
“Government Worker” Is (Usually) an Oxymoron
In “Good News from the Federal Government” I sarcastically endorse the move to grant all federal workers 12 weeks of paid parental leave:
The good news is that there will be a lot fewer civilian federal workers on the job, which means that the federal bureaucracy will grind a bit more slowly when it does the things that it does to screw up the economy.
The next day, Audacious Epigone put some rhetorical and statistical meat on the bones of my informed prejudice in “Join the Crooks and Liars: Get a Government Job!“:
That [the title of the post] used to be a frequent refrain on Radio Derb. Though the gag has been made emeritus, the advice is even better today than it was when the Derb introduced it. As he explains:
The percentage breakdown is private-sector 76 percent, government 16 percent, self-employed 8 percent.
So one in six of us works for a government, federal, state, or local.
Which group does best on salary? Go on: see if you can guess. It’s government workers, of course. Median earnings 52½ thousand. That’s six percent higher than the self-employed and fourteen percent higher than the poor shlubs toiling away in the private sector.
If you break down government workers into two further categories, state and local workers in category one, federal workers in category two, which does better?
Again, which did you think? Federal workers are way out ahead, median earnings 66 thousand. Even state and local government workers are ahead of us private-sector and self-employed losers, though.
Moral of the story: Get a government job! — federal for strong preference.
….
Though it is well known that a government gig is a gravy train, opinions of the people with said gigs is embarrassingly low as the results from several additional survey questions show.
First, how frequently the government can be trusted “to do what’s right”? [“Just about always” and “most of the time” badly trail “some of the time”.]
….
Why can’t the government be trusted to do what’s right? Because the people who populate it are crooks and liars. Asked whether “hardly any”, “not many” or “quite a few” people in the federal government are crooked, the following percentages answered with “quite a few” (“not sure” responses, constituting 12% of the total, are excluded). [Responses of “quite a few” range from 59 percent to 77 percent across an array of demographic categories.]
….
Accompanying a strong sense of corruption is the perception of widespread incompetence. Presented with a binary choice between “the people running the government are smart” and “quite a few of them don’t seem to know what they are doing”, a solid majority chose the latter (“not sure”, at 21% of all responses, is again excluded). [The “don’t know what they’re doing” responses ranged from 55 percent to 78 percent across the same demographic categories.]
Are the skeptics right? Well, most citizens have had dealings with government employees of one kind and another. The “wisdom of crowds” certainly applies in this case.