The World Values Survey is
a worldwide investigation of sociocultural and political change….
… carried out by an international network of social scientists, with local funding for each survey (though in some cases, it has been possible to raise supplementary funds from outside sources). In exchange for providing the data from interviews with a representative national sample of at least 1,000 people in their own society, each participating group gets immediate access to the data from all of the other participating societies. Thus, they are able to compare the basic values and beliefs of the people of their own society with those of more than 60 other societies…..
“Society” here means “nation,” not “society” properly understood. Nevertheless, the cross-national comparisons yielded by the survey are revealing, and generally ring true.
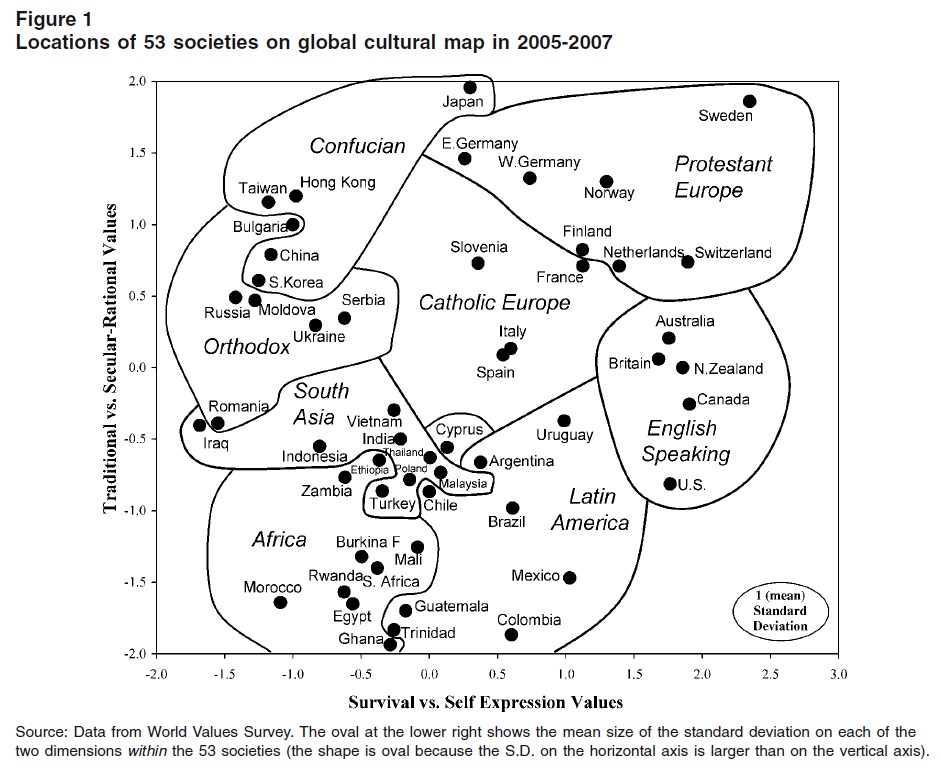
Let’s begin with a graph from an analysis of recent survey results, presented in Ronald Inglehart and Christian Wenzel’s “Changing Mass Priorities: The Link between Modernization and Democracy“:
What does it mean? Here are excerpts of the authors’ observations:
… The World Values Survey and EuropeanValues Study (hereafter referred to as the WVS/EVS) provide evidence that the transition from agrarian to industrial society produces one set of changes, and the rise of postindustrial societies produces another set of changes in peoples’ values and motivations. Analyses of WVS/EVS data reveal two major dimensions of cross-cultural variation: a traditional versus secular-rational values dimension and a survival versus self-expression values dimension.These two dimensions tap scores of attitudinal variables, and are robust enough that researchers obtain similar results using various combinations of these variables….
Factor analysis of data from the 43 societies in the 1990 WVS/EVS found that these two dimensions accounted for over half of the cross-national variance in scores of variables. When this analysis was replicated with data from the 1995–1998 surveys, the same two dimensions emerged—although the new analysis included 23 additional countries.12 The same two dimensions also emerged in analysis of data from the 2000–2001 surveys.
Figure 1 shows the locations of 52 countries on these two dimensions, using the data from the 2005–2007 WVS…. Relative scores on these two dimensions have been stable attributes of most countries throughout the period from 1981 to 2007.
Our revised version of modernization theory holds that rising levels of existential security are conducive to a shift from traditional values to secular-rational values, and from survival values to self-expression values. Accordingly, all of the high-income countries rank high on both dimensions, falling into the upper-right region of the chart—while all of the low and lower-middle-income countries rank low on both dimensions, falling into the lower-left region of the chart.
But the evidence also supports the Weberian view that a society’s religious values leave a lasting imprint. The publics of protestant Europe show relatively similar values across scores of questions—as do the publics of Catholic Europe, the Confucian-influenced societies, the Orthodox societies, the English-speaking countries, Latin America, and sub-Saharan Africa. The cross-national differences found in the large-N surveys reflect each society’s economic and socio-cultural history.
Cross-national differences are huge. Thus, the proportion saying that God is very important in their lives ranges from 98 percent in relatively traditional countries to 3 percent in secular-rational countries. Cross-national differences dwarf the differences within given societies….
… Thus, Italy is at the center of Figure 1, near Spain but a substantial distance from most other societies. Although individual Italians can fall anywhere on the map, there is surprisingly little overlap between the prevailing orientations of large groups of Italians and their peers in other countries: most nationalities are at least one or two standard deviations away from the Italians. The same holds true of Slovenians, Norwegians, Mexicans, Americans, Russians, British and other nationalities….
All of that is well and good, but the groupings drawn in Figure 1 are often tenuous.* To take a few examples:
- Japan is placed in the Confucian group, but it is closer to the Germanys than it is to other members of the Confucian group.
- China and South Korea are placed in the Confucian group, but they are sandwiched between members of the Orthodox group.
- Romania (Orthodox) is closer to Iraq (South Asia) than it is to other members of its assigned group.
- The conjunction of the South Asia, Latin America, and Africa groups is replete with countries that are closer to each other than they are to other members of their respective groups.
- The U.S. is lumped with other English-speaking countries. but on the vertical dimension there is a signficant distance (about 3 standard deviations) between the U.S. and Britain.
Further, Figure 1 covers a limited time span. Robustness and completeness would be served by showing comparisons over a longer span, and by showing trends (to the extent that there are any).
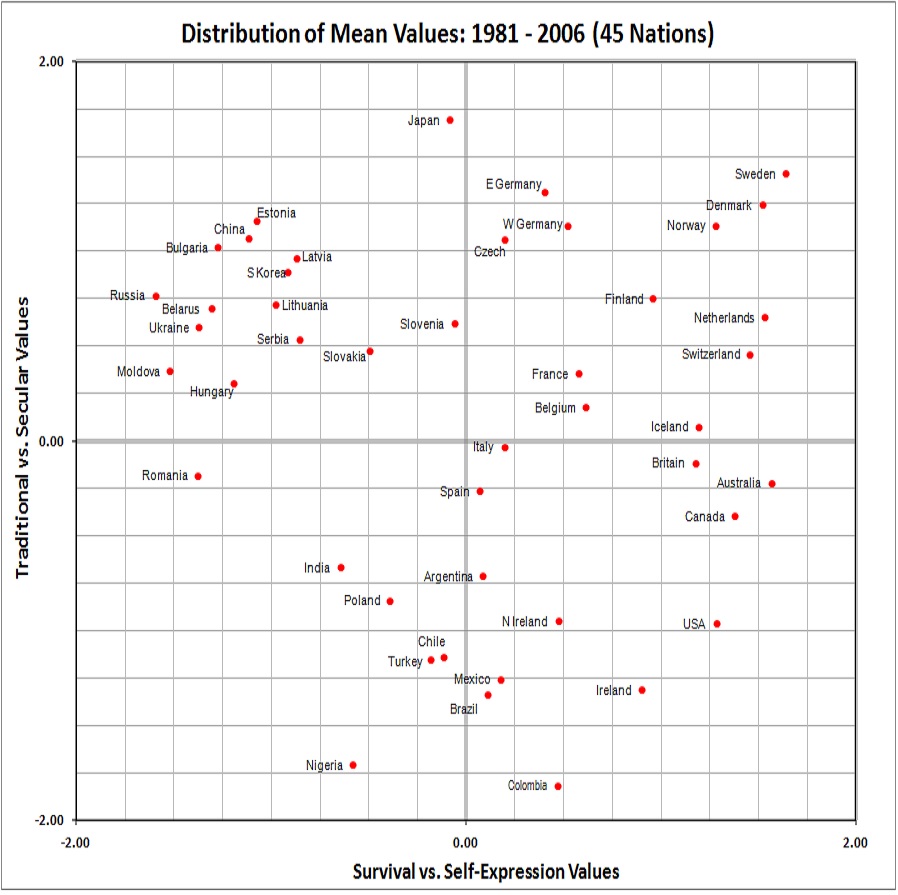
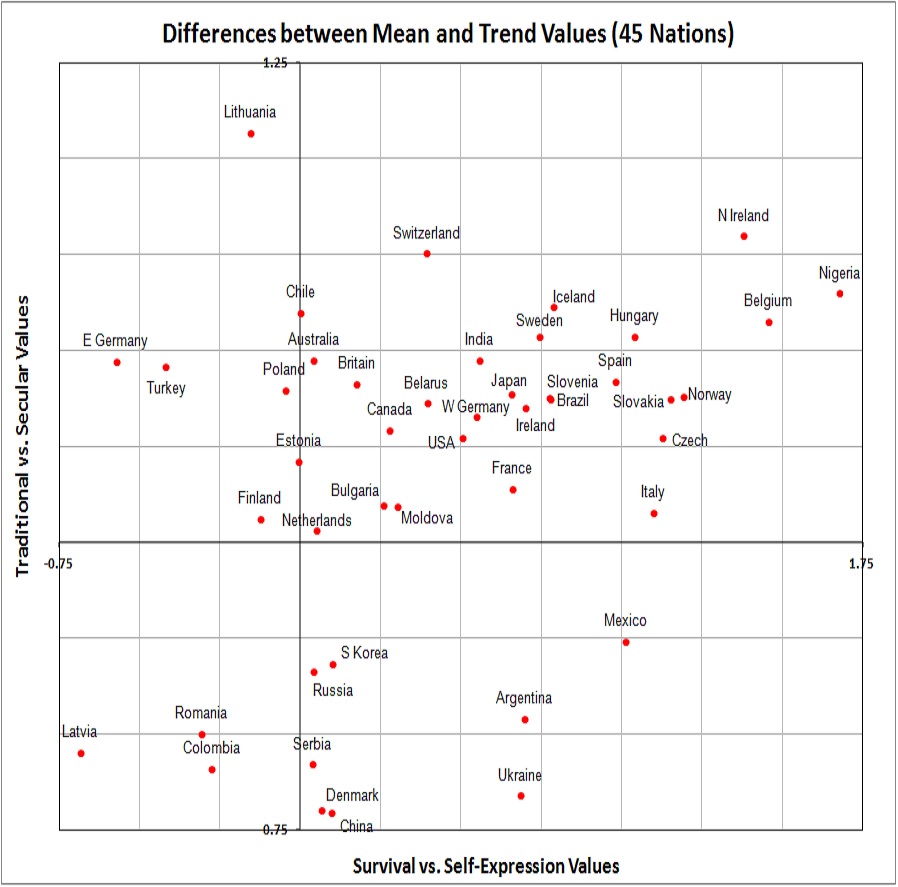
Accordingly, using data for 1981-2006 (“National-Level Value Scores on the Two Major Values Dimensions, for All Nations and Waves“), I constructed the graphs below. The first graph is a plot of the means for each country, where a country is included only if it appears in at least three of the five surveys (1981, 1990, 1995, 2000, 2006). The second graph is a plot of the difference between each country’s mean and its predicted position in 2013, as estimated by using the LINEST function of Excel. Although the two graphs are drawn to different scales, because of differences in the spread of plot points, the gridlines in both graphs are 0.25 standard deviations apart. Therefore, a vertical or horizontal distance of 4 gridlines represents 1 standard deviation.


In the first graph, the distance between points indicates degree of significance. Thus, for example, the vertical distance between Japan and Colombia is about 14 gridlines, or 2.5 standard deviations. That is, indeed, a significant difference. Similarly, Sweden is about 13 gridlines (2.25 standard deviations) from Russia in the horizontal dimension; another separation that I would consider significant. Make what you will of it; there are some unsurprising clusters; for example:
- Several formerly Communist countries are grouped in the northwest quadrant.
- Nordic countries (Sweden, Denmark, Norway) are grouped in the upper part of the northeast quadrant.
- Britain, Australia, and Canada form a fairly tight grouping.
On the other hand, here are some other examples:
- The Britain-Australia-Canada cluster is close to the point for Iceland, which (surprisingly) is fairly far from the the Sweden-Denmark-Norway cluster.
- Japan — perhaps unsurprisingly, as the most Westernized of Asian nations — stands well apart from China and South Korea, which are in a cluster with former Communist countries.
- Italy and Spain aren’t significantly far from France and Belgium, nor are the latter significantly far from Finland and Iceland.
The best that I can make of the first graph is a rough east-west split along the horizontal axis, and, of course, a rough less-religious to more-religious split along the vertical axis.
What about the trends that are indicated in the second graph? There, the relevant distance is from the 0,0 intersection of the axes. That is so because the graph depicts the predicted change (in 2013) from each country’s mean for 1981-2006. Only Lithuania is on a course to move vertically by 4 or more gridlines (1 or more standard deviations). Further, there’s a lot of downward movement.
The preceding observations suggest that, in general, there isn’t strong movement away from traditional values toward secular ones. That’s consistent with the Weberian view: religious values have a lasting effect. I would add that they have a lasting effect where they’re not suppressed — as they were in the former Communist countries, and as they are by the “thought police” of many Western European countries and Canada.
There is, however, a definite rightward movement, away from survival values. In fact, several countries are on a course to move horizontally by 4 or more gridlines: Spain, Hungary, Italy, Czech Republic, Slovakia, Norway, Northern Ireland, Belgium, and Nigeria. The movement away from survival values toward what the authors call self-expression values is consistent with the general rise of living standards in much of the world.
In sum, the groupings drawn by the authors in their Figure 1 are strained and uninformative. If you believe that the “values” surveys yield meaningful aggregations, look beyond the authors’ groupings to the data presented in my two graphs. And draw your own conclusions.
__________
* A similar but later mapping is found here. Similar criticisms apply to it.