Is a Reckoning at Hand?

If it is, it will arrive on two fronts: political and economic.

On the political front, Conrad Black and Victor Davis Hanson are (sort of) optimistic that the left’s audacious power-grab will fail. A recent op-ed by Black at Epoch Times ends with this:

But we are almost at the point where this administration’s attempt to revolutionize American elections by practically abolishing any verification process for ballots and turning election day into a weeks-long orgy of ballot-harvesting, while packing the Senate and the Supreme Court and gagging congressional minorities, will collide with public opposition to all of these measures.

In those circumstances, the Supreme Court, its attempt at appeasement of the Democrats by abdicating as head of a co-equal third branch of government having failed, might also reassert the legitimacy of the Constitution.

A turning in the road is almost at hand.

Hanson’s view complements Black’s:

We are becoming cynical 1980s Eastern Europeans who quietly scoffed at their daily government news. And this is step one to a repudiation of the lies we have been living with—that masks were necessary outdoors even for those fully vaccinated; that derelict, sexual harasser Andrew Cuomo is a noted author, Emmy-winner and national icon rather than a reckless sexual-harasser and responsible for needless death and misery by his unhinged long-term facilities policies; that Oprah, LeBron, and the Obamas are genuine voices of what it is like to be oppressed in America, and all the subsidiary untruths: the “brave” former intelligence officials who signed campaign-sensitive affidavits seconding Joe Biden’s insistence that Hunter’s laptop was a Russian disinformation trick; that Trump scoffed at “proof” that Russians put bounties on Americans in Afghanistan as they were appease;, and that Joe Biden has no cognitive issues and never did, at least of the sort that prompted his predecessor to take cognitive tests and draw the attention of a Yale psychiatry professor to diagnose him as unhinged in absentia.

In sum, the woke movement daily, hourly, second-by-second hinges on untruth, from the 1619 canard to America is systemically racist. And the number who spot the lies is beginning to outnumber the number who lives by them—which means the Revolution is likely to follow the Jacobin rather than Bolshevik fate.

On the economic front, the huge increase in government spending over the past two years — which Biden wants to perpetuate — will bear rotten fruit.

Here is the increase, in perspective:


Derived from Bureau of Economic Affairs, Table 1.1.5 Gross Domestic Product (billions of dollars, seasonally adjusted at annual rates) and Table 3.1. Government Current Receipts and Expenditures (billions of dollars, seasonally adjusted at annual rates)

As I have amply documented, government spending doesn’t “multiply”. If fact, it “divides”; that is, it causes real GDP to decline because government spending (and the regulatory activities funded by it) result in the transfer of resources from productive private uses to unproductive and counterproductive government uses, while also discouraging business expansion and productive investments in capital formation.

The bottom line is that a sustained increase in the share of GDP spent by government from about 33 percent (the average for the 10 years before the recent surge) to about 45 percent (the average for the recent surge) would cause a long-term reduction 4 percent of real GDP. If that doesn’t seem like a lot, consider that it would be the equivalent of a Great Recession that lasts for years on end instead of two or three years.

Voters flocked to the Democrat Party in the 1930s because they believed (mistakenly) that it — and especially FDR’s “New Deal” — would rescue them from the Great Depression. Voters will flock the the GOP in the 2020s if the Democrat Party remains stubbornly “woke” and persists in economic policies that impoverish them.

And if voters fail to switch in droves, it will prove the wisdom of the Framers’ (long-abandoned) Constitution, which was designed to prevent demagogues from pillaging the nation.


Related reading:

Victor Davis Hanson, “Are Americans Becoming Sovietized?“, The Daily Signal, May 6, 2021
Patricia McCarthy, “Aldous Huxley Foresaw Our Despots — Fauci, Gates, and Their Vaccine Crusaders“, American Thinker, May 5, 2021
Jeffrey A. Tucker, “Is the U.S. Economy a Virtual Reality?“, AIER, May 2, 2021

Related post: Turning Points

Revisiting the Laffer Curve

Among the claims made in favor of the Tax Cuts and Jobs Act of 2017 was that the resulting tax cuts would pay for themselves. Thus the Laffer curve returned briefly to prominence, after having been deployed to support the Reagan and Bush tax cuts of 1981 and 2001.

The idea behind the Laffer curve is straightforward. Taxes inhibit economic activity, that is, the generation of output and income. Tax-rate reductions therefore encourage work, which yields higher incomes. Higher incomes mean that there is more saving from which to finance growth-producing capital investment. Lower tax rates also make investment more attractive by increasing the expected return on capital investments. Lower tax rates therefore stimulate economic output by encouraging work and investment (supply-side economics). Under the right conditions, lower tax rates may generate enough additional income to yield an increase in tax revenue.

I believe that there are conditions under which the Laffer curve works as advertised. But so what? The Laffer curve focuses attention on the wrong economic variable: tax revenue. The economic variables that really matter — or that should matter — are the real rate of growth and the income available to Americans after taxes. More (real) economic growth means higher (real) income, across the board. More government spending means lower (real) income; the Keynesian multiplier is a cruel myth.

A new Laffer curve is in order, one that focuses on the effects of taxation on economic growth, and thus on the aggregate output of products and services available to consumers.

Let us begin at the beginning, with this depiction of the Laffer curve (via Forbes):

This is an unusually sophisticated depiction of the curve, in that it shows a growth-maximizing tax rate which is lower than the revenue-maximizing rate. It also shows that the growth-maximizing rate is greater than zero, for a good reason.

With real taxes (i.e., government spending) at zero or close to it, the rule of law would break down and the economy would be a shambles. But government spending above that required to maintain the rule of law (i.e., adequate policing, administration of justice, and national defense) interferes with the efficient operation of markets, both directly (by pulling resources out of productive use) and indirectly (by burdensome regulation financed by taxes).

Thus a tax rate higher than that required to sustain the rule of law1 leads to a reduction in the rate of (real) economic growth because of disincentives to work and invest. A reduction in the rate of growth pushes GDP below its potential level. Further, the effect is cumulative. A reduction in GDP means a reduction in investment, which means a reduction in future GDP, and on and on.

I will quantify the Laffer curve in two steps. First, I will estimate the tax rate at which revenue is maximized, taking the simplistic view that changes in the tax rate do not change the rate of economic growth. I will draw on Christina D. Romer and David H. Romer’s “The Macroeconomic Effects of Tax Changes: Estimates Based on a New Measure of Fiscal Shocks” (American Economic Review, June 2010, pp. 763-801).

The Romers estimate the effects of exogenous changes in taxes on GDP. (“Exogenous” meaning tax cuts aimed at stimulating the economy, as opposed, for example, to tax increases triggered by economic growth.) Here is their key finding:

Figure 4 summarizes the estimates by showing the implied effect of a tax increase of one percent of GDP on the path of real GDP (in logarithms), together with the one-standard-error bands. The effect is steadily down, first slowly and then more rapidly, finally leveling off after ten quarters. The estimated maximum impact is a fall in output of 3.0 percent. This estimate is overwhelmingly significant (t = –3.5). The two-standard-error confidence interval is (–4.7%,–1.3%). In short, tax increases appear to have a very large, sustained, and highly significant negative impact on output. Since most of our exogenous tax changes are in fact reductions, the more intuitive way to express this result is that tax cuts have very large and persistent positive output effects. [pp. 781-2]

The Romers assess the effects of tax cuts over a period of only 12 quarters (3 years). Some of the resulting growth in GDP during that period takes the form of greater spending on capital investments, the payoff from which usually takes more than 3 years to realize. So a tax cut of 1 percent of GDP yields more than a 3-percent rise in GDP over the longer run. But let’s keep it simple and use the relationship obtained by the Romers: a 1-percent tax cut (as a percentage of GDP) results in a 3-percent rise in GDP.

With that number in hand, and knowing the effective tax rate (33 percent of GDP in 20172), it is then easy to compute the short-run effects of changes in the effective tax rate on GDP, after-tax GDP, and tax revenue:


Effective tax revenue represents the dollar amount extracted from the economy through government spending at the stated percentage of GDP. (Spending includes transfer payments, which take from those who produce and give to those who do not.) Effective tax rate represents the dollar amount extracted from the economy, divided by GDP at the given tax rate. (GDP is based on the Romers’ estimate of the marginal effect of a change in the tax rate.)

It is a coincidence that tax revenue is maximized at the current (2017) effective tax rate of 33 percent. The coincidence occurs because, according to the Romers, every $1 change in tax revenue (or government spending that draws resources from the real economy) yields a $3 change in GDP, at the margin. If the marginal rate of return were lower than 3:1, the revenue-maximizing rate would be greater than 33 percent. If the marginal rate of return were higher than 3:1, the revenue-maximizing rate would be less than 33 percent.

In any event, the focus on tax revenue is entirely misplaced. What really matters, given that the prosperity of Americans is (or should be) of paramount interest, is GDP and especially after-tax GDP. Both would rise markedly in response to marginal cuts in real taxes (i.e., government spending). Democrats don’t want to hear that, of course, because they want government to decide how Americans spend the money that they earn. The idea that a far richer America would need far less government — subsidies, nanny-state regulations, etc. — frightens them.

It gets better (or worse, if you’re a big-government fan) when looking at the long-run effects of lower government spending on the rate of growth. I am speaking of the Rahn curve, which I estimate here. Holding other things the same, every percentage-point reduction in the real tax rate (government spending as a fraction of GDP) means an increase of 0.35 percentage point in the rate of real GDP growth. This is a long-run relationship because it takes time to convert some of the tax reduction to investment, and then to reap the additional output generated by the additional investment. It also takes time for workers to respond to the incentive of lower taxes by adding to their skills, working harder, and working in more productive jobs.

This graph depicts the long-run effects of changes in the effective tax rate, taking into account changes in the real growth rate from a base of 2.8 percent (the year-over-year rate for the most recent fiscal quarter):

Note that the same real tax revenue would be realized at an effective tax rate of 13 percent of GDP. At that rate, GDP would rise to 2.5 times its 2017 value (instead of 1.6 times as shown in Figure 1), and after-tax GDP would rise to 3.3 times its 2017 value (instead of 2.1 times as shown in Figure 1).

The real Laffer curve — the one that people ought to pay attention to — is the Rahn curve. Holding everything else constant, here is the relationship between the real growth rate and the effective tax rate:

Laffer revisited_3

At the current effective tax rate — 33 percent of GDP — the economy is limping along at about one-third of its potential growth. That is actually good news, inasmuch as the real growth rate dipped perilously close to 1 percent several times during the Obama administration, even after the official end of the Great Recession.

But it will take many years of spending cuts (relative to GDP, at least) and deregulation to push growth back to where it was in the decades immediately after World War II. Five percent isn’t out of the question.
__________

1. Total government spending, when transfer payments were negligible, amounted to between 5 and 10 percent of GDP between the Civil War and the Great Depression (Series F216-225, “Percent Distribution of National Income or Aggregate Payments, by Industry, in Current Prices: 1869-1968,” in Chapter F, National Income and Wealth, Historical Statistics of the United States, Colonial Times to 1970: Part 1). The cost of an adequate defense is a lot higher than it was in those relatively innocent times. Defense spending now accounts for about 3.5 percent of GDP. An increase to 5 percent wouldn’t render the U.S. invulnerable, but it would do a lot to deter potential adversaries. So at 10 percent of GDP, government spending on policing, the administration of justice, and defense — and nothing else — should be more than adequate to sustain the rule of law.

2. The effective tax rate on GDP in 2017 was 33.4 percent. That number represents total government government expenditures (line 37 of BEA Table 3.1), divided GDP (line 1 of BEA Table 1.15). The nominal tax rate on GDP was 30 percent; that is, government receipts (line 34 of BEA Table 3.1) accounted for 30 percent of GDP. (The BEA tables are accessible here.) I use the effective tax rate in this analysis because it truly represents the direct costs levied on the economy by government. (The indirect cost of regulatory activity adds about $2 trillion, bringing the total effective tax to 44 percent.)

Presidents and Economic Growth

There’s an old and recurring claim that Democrat presidents produce greater economic growth than Republican ones. I addressed and debunked such a claim nine years ago, saying this (in part):

Given the long, downward trend in the real rate of GDP growth, it is statistical nonsense to pin the growth rate in any given year to a particular year of a particular president’s term. It is evident that GDP growth has been influenced mainly by the cumulative, anti-growth effects of government regulation. And GDP growth, in any given year, has been an almost-random variation on a downward theme.

How random? This random:


Derived from Bureau of Economic Analysis, “Current dollar and ‘real’ GDP,” as of April 28, 2017.

The one-year lag (which is usual in such analyses) allows for the delayed effects (if any) of a president’s economic policies. The usual suspects are claiming, laughably, that the tepid growth rate in the first calendar quarter of 2017 is somehow Trump’s fault.

Anyway, here’s the real story:

This is an updated version of a graph in “The Rahn Curve Revisited.,” from which the following equation is taken:

Yg = 0.0275 – 0.347F + 0.0769A – 0.000327R – 0.135P , where

Yg = real rate of GDP growth in a 10-year span (annualized)

F = fraction of GDP spent by governments at all levels during the preceding 10 years

A = the constant-dollar value of private nonresidential assets (business assets) as a fraction of GDP, averaged over the preceding 10 years

R = average number of Federal Register pages, in thousands, for the preceding 10-year period

P = growth in the CPI-U during the preceding 10 years (annualized).

Random, short-run fluctuations in GDP growth have almost nothing to do with the policies of a particular president (see the first graph). But there’s nothing random about the steady growth of government spending, the steadier growth of the regulatory burden, and the combined investment-killing and inflationary effects of both (see the second graph).

The long-run trend in GDP growth reflects the cumulative effects of policies carried out by the “deep state” — the apparatus that churns on with little change in direction from president to president: the special interests represented in the many committees of Congress, the Social Security Administration (which also encompasses Medicare and Medicaid), and the entire alphabet soup of federal regulatory agencies. Most of those entities became committed, long ago, to the growth of government spending and regulation. It will take more than a slogan to drain the swamp.

John H. Arnold characterizes war as “long periods of boredom punctuated by short moments of excitement.” I would say that the economy of the United States has been on a long slide into stagnation punctuated by brief periods of misplaced optimism.

Not-So Random Thoughts (XIX)

ITEM ADDED 12/18/16

Manhattan Contrarian takes on the partisan analysis of economic growth offered by Alan Blinder and Mark Watson, and endorsed (predictably) by Paul Krugman. Eight years ago, I took on an earlier analysis along the same lines by Dani Rodrik, which Krugman (predictably) endorsed. In fact, bigger government, which is the growth mantra of economists like Blinder, Watson, Rodrik, and (predictably) Krugman, is anti-growth. The combination of spending, which robs the private sector of resources, and regulations, which rob the private sector of options and initiative, is killing economic growth. You can read about it here.

*     *     *

Rania Gihleb and Kevin Lang say that assortative mating hasn’t increased. But even if it had, so what?

Is there a potential social problem that will  have to be dealt with by government because it poses a severe threat to the nation’s political stability or economic well-being? Or is it just a step in the voluntary social evolution of the United States — perhaps even a beneficial one?

In fact,

The best way to help the people … of Charles Murray’s Fishtown [of Coming Apart] — is to ignore the smart-educated-professional-affluent class. It’s a non-problem…. The best way to help the forgotten people of America is to unleash the latent economic power of the United States by removing the dead hand of government from the economy.

*     *     *

Anthropogenic global warming (AGW) is a zombie-like creature of pseudo-science. I’ve rung its death knell, as have many actual scientists. But it keeps coming back. Perhaps President Trump will drive a stake through its heart — or whatever is done to extinguish zombies. In the meantime, here’s more evidence that AGW is a pseudo-scientific hoax:

In conclusion, this synthesis of empirical data reveals that increases in the CO2 concentration has not caused temperature change over the past 38 years across the Tropics-Land area of the Globe. However, the rate of change in CO2 concentration may have been influenced to a statistically significant degree by the temperature level.

And still more:

[B]ased on [Patrick[ Frank’s work, when considering the errors in clouds and CO2 levels only, the error bars around that prediction are ±15˚C. this does not mean—thankfully— that it could be 19˚ warmer in 2100. rather, it means the models are looking for a signal of a few degrees when they can’t differentiate within 15˚ in either direction; their internal errors and uncertainties are too large. this means that the models are unable to validate even the existence of a CO2 fingerprint because of their poor resolution, just as you wouldn’t claim to see DnA with a household magnifying glass.

And more yet:

[P]oliticians using global warming as a policy tool to solve a perceived problem is indeed a hoax. The energy needs of humanity are so large that Bjorn Lomborg has estimated that in the coming decades it is unlikely that more than about 20% of those needs can be met with renewable energy sources.

Whether you like it or not, we are stuck with fossil fuels as our primary energy source for decades to come. Deal with it. And to the extent that we eventually need more renewables, let the private sector figure it out. Energy companies are in the business of providing energy, and they really do not care where that energy comes from….

Scientists need to stop mischaracterizing global warming as settled science.

I like to say that global warming research isn’t rocket science — it is actually much more difficult. At best it is dodgy science, because there are so many uncertainties that you can get just about any answer you want out of climate models just by using those uncertianties as a tuning knob.

*     *     *

Well, that didn’t take long. lawprof Geoffrey Stone said something reasonable a few months ago. Now he’s back to his old, whiny, “liberal” self. Because the Senate failed to take up the nomination of Merrick Garland to fill Antonin Scalia’s seat on the Supreme Court — which is the Senate’s constitutional prerogative, Stone is characterizing the action (or lack of it) as a “constitutional coup d’etat” and claiming that the eventual Trump nominee will be an “illegitimate interloper.” Ed Whelan explains why Stone is wrong here, and adds a few cents worth here.

*     *     *

BHO stereotypes Muslims by asserting that

Trump’s proposal to bar immigration by Muslims would make Americans less safe. How? Because more Muslims would become radicalized and acts of terrorism would therefore become more prevalent. Why would there be more radicalized Muslims? Because the Islamic State (IS) would claim that America has declared war on Islam, and this would not only anger otherwise peaceful Muslims but draw them to IS. Therefore, there shouldn’t be any talk of barring immigration by Muslims, nor any action in that direction….

Because Obama is a semi-black leftist — and “therefore” not a racist — he can stereotype Muslims with impunity. To put it another way, Obama can speak the truth about Muslims without being accused of racism (though he’d never admit to the truth about blacks and violence).

It turns out, unsurprisingly, that there’s a lot of truth in stereotypes:

A stereotype is a preliminary insight. A stereotype can be true, the first step in noticing differences. For conceptual economy, stereotypes encapsulate the characteristics most people have noticed. Not all heuristics are false.

Here is a relevant paper from Denmark.

Emil O. W. Kirkegaard and Julius Daugbjerg Bjerrekær. Country of origin and use of social benefits: A large, preregistered study of stereotype accuracy in Denmark. Open Differential Psychology….

The high accuracy of aggregate stereotypes is confirmed. If anything, the stereotypes held by Danish people about immigrants underestimates those immigrants’ reliance on Danish benefits.

Regarding stereotypes about the criminality of immigrants:

Here is a relevant paper from the United Kingdom.

Noah Carl. NET OPPOSITION TO IMMIGRANTS OF DIFFERENT NATIONALITIES CORRELATES STRONGLY WITH THEIR ARREST RATES IN THE UK. Open Quantitative Sociology and Political Science. 10th November, 2016….

Public beliefs about immigrants and immigration are widely regarded as erroneous. Yet popular stereotypes about the respective characteristics of different groups are generally found to be quite accurate. The present study has shown that, in the UK, net opposition to immigrants of different nationalities correlates strongly with the log of immigrant arrests rates and the log of their arrest rates for violent crime.

The immigrants in question, in both papers, are Muslims — for what it’s worth.

UPDATE 06/02/17: There’s new material of relevance at https://www.youtube.com/watch?v=jMSRZQ1usDc and http://buff.ly/2qyO2yy.

* * *

ADDED 12/18/16:

I explained the phoniness of the Keynesian multiplier here, derived a true (strongly negative) multiplier here, and added some thoughts about the multiplier here. Economist Scott Sumner draws on the Japanese experience to throw more cold water on Keynesianism.

America’s Financial Crisis Is Now

A REISSUE (WITHOUT UPDATES) OF THE ORIGINAL POST DATED MAY 1, 2011

*     *     *

INTRODUCTION

Three Economic Charts That Will BLOW YOUR MIND,” at RightWing News, offers some tantalizing statistics about the relationship between federal tax receipts and GDP. The bottom line:

The key thing to take away from this is that the amount of revenue the government can bring in via the income tax is, for whatever reason, more inelastic than most people think. That’s yet another reason to put more emphasis on balancing the budget via spending cuts as opposed to trying to fix the problem with tax increases.

Now, if Hauser’s law is as spot-on as it has been in the past … it’s going to be difficult to raise the government’s revenue level much beyond the 20% mark….

I have no quibble with the proposition that the U.S. government has made unaffordable, unilateral “promises” about Social Security, Medicare, and Medicaid benefits. But I must take issue with the focus on the income tax and Hauser’s law, which is

the proposition that, in the United States, federal tax revenues since World War II have always been approximately equal to 19.5% of GDP, regardless of wide fluctuations in the marginal tax rate.

It is necessary to step back from a myopic focus on the federal government and look at all government receipts and expenditures in the United States. The need to do so arises from two facts: (1) State and local spending is substantial, and (2) federal, State, and local finances have become tightly bound together since the advent of revenue sharing and block grants, and with the explosion of federal statutory and regulatory commands to the States.

I begin by looking at the historical record of government income and outgo. That leads me to the future, in which “entitlements” loom unaffordably large . There are three broad paths along which to proceed: cut “entitlements,” borrow considerably more, or tax considerably more. I explain why the second and third options are untenable and economically destructive. The only viable alternative is to cut “entitlements,” and to begin cutting now.

GOVERNMENT SPENDING AND RECEIPTS: THE HISTORICAL RECORD

Here is how State and local spending stacks up against federal spending:

Federal vs state and local spending pct GDP
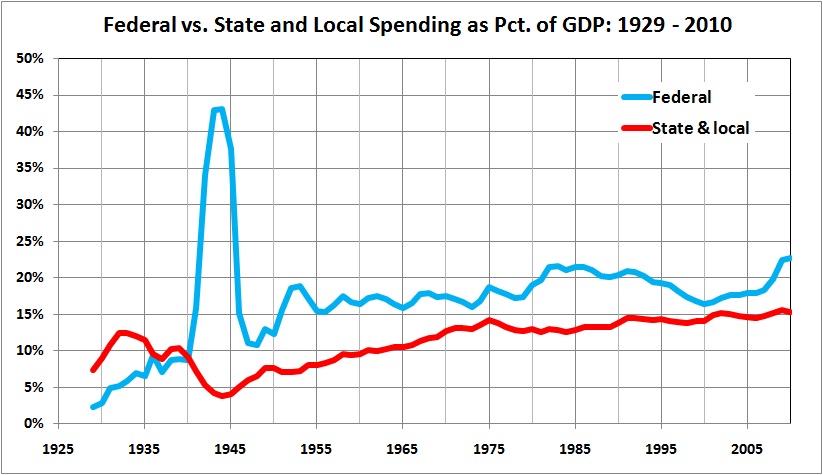
Sources: Derived from U.S. Department of Commerce, Bureau of Economic Analysis (BEA), National Income and Product Accounts (NIPA) Tables: Table 3.2 Federal Government Current Receipts and Expenditures (lines 26 and 40-45) and Table 3.3 State and Local Government Current Receipts and Expenditures (line 33).

State and local spending is not insubstantial, and has risen in recent decades, with a lot of help from the federal government. Federal grants to State and local governments have risen steadily from almost zero in 1929 to upwards of 4 percent of GDP in recent years. (I have excluded those grants from federal spending to avoid double-counting.)

Here is an aggregate picture of federal, State, and local spending and receipts.

Combined government spending and receipts
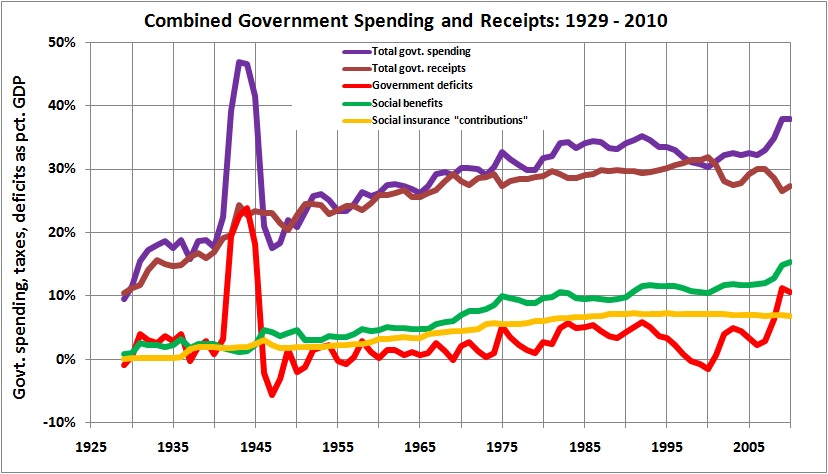
Source: Derived from NIPA Table 3.1 Government Current Receipts and Expenditures (lines 7, 19, 30, and 33-39).

Despite Hauser’s “law,” government receipts, as a percentage of GDP, rose steadily from 1929 until 2000, peaking at 32 percent. The post-2000 decline can be attributed to slow economic growth (capped by the recession of 2008-2010) and the so-called Bush tax cuts (which Congress approved initially and again in 2010). I have nothing against the tax cuts, except for the fact that they were not matched by spending cuts. The real burden of government is measured by spending, which diverts resources from productive uses to ones that are less-productive (e.g., public education), counter-productive (e.g., regulation), and downright destructive (i.e., growth-retarding and inflationary). The fact that lenders have increasingly borne the monetary cost of the burden of government has not offset its egregious economic effects. And, as I discuss below, without drastic spending cuts (relative to GDP) there will come a day when lenders will shrug off the burden or demand a much higher price for bearing it.

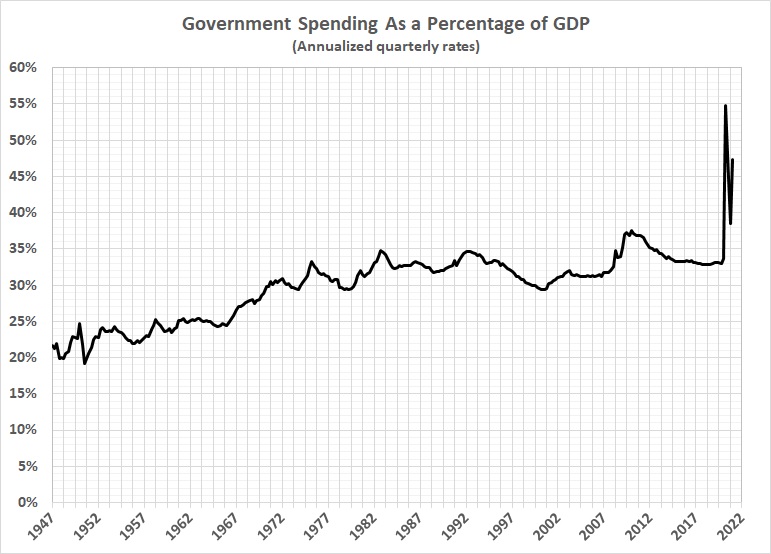
In any event, regardless of generally diminishing receipts in the first decade of the 21st century, government spending rose as a percentage of GDP, for several reasons. First, there was (and is) slower economic growth, due in no small part to the preceding decades of governmental interference in economic affairs. On top of that, there was Obama’s “stimulus package,” which was meant to end the recession of 2008-2010 but did not (because it could not); the recession ended in the normal way, through the recovery of “animal spirits” and consumer confidence. Then there was (and is) a growing population of persons eligible for Social Security, Medicare (supplemented by “free” or “cheap” prescription drugs), and Medicaid — a population made all the more eager to claim its “entitlements,” given the state of the economy. Finally, and almost incidentally, two foreign wars were fought simultaneously (though with varying degrees of intensity) throughout the decade.

To focus only on federal spending, as I say, is myopic because State and local governments have a habit of raising State and local taxes when so-called federal grants are cut back. (I say “so-called” because the money for those grants is provided largely by taxpayers who are, of course, denizens of the States and their political subdivisions.) In addition to the possibility of higher State and local spending in reaction to cuts in federal largesse, taxpayers — not public-sector unions — should be up in arms about the above-market compensation of government employees. A significant portion of that above-market compensation comes in the form of cushy pension plans, which allow “public servants” to receive high fractions of their salary (sometimes as much as 100 percent) for life, and to begin receiving those payments when they are in their 40s and 50s, after having held a government job for 20 years or so. As a result of these obligations and other undisciplined spending habits, State and local governments have liabilities of more than $7 trillion.

Which brings me to the 500-pound gorilla: the federal government.

“ENTITLEMENTS”: THE SOURCE OF OUR PRESENT AND PROSPECTIVE WOES

Perhaps the most interesting lines in the second graph (above) are the three at the bottom. The gap between the cost of social programs (green line) and “contributions” to those programs (gold line) has risen markedly since the late 1990s. By 2010, the size of that gap — 8.5 percent of GDP — accounted for most deficit spending (red line) — 10.6 percent of GDP. And that is but a hint of things to come. The internet abounds with graphs and tables that depict future federal spending and revenues under various assumptions. They all point to the same conclusion: Spending “commitments” must be cut — and cut drastically — in order to avoid (a) economically disabling tax increases and (b) a day of reckoning in credit markets.

The online offerings include these from the Congressional Budget Office (CBO): “Impact of the President’s Proposals on the Budget Outlook” (blog summary), and “Long Term Analysis of a Budget Proposal by Chairman Ryan” (blog summary). The CBO analyses are somewhat dense and must be read in juxtaposition. They are neatly conjoined by the Committee for a Responsible Federal Budget’s “Analyzing the President’s New Budget Framework.” Here is an informative graphic from that analysis:

Debt projections under various fiscal reform plans

Obama’s “framework,” as the report emphasizes, is short on details. It is obviously a slap-dash response to Paul Ryan’s detailed plan (labelled “House Republicans” in the graphic), which is a serious proposal for long-term deficit reduction. To understand the bankruptcy of Obama’s actual budget and current law, which are about the same, one must look beyond 2021.

Drawing on CBO’s work, Cato Institute’s Michael Tanner take the long view in “Bankrupt: Entitlements and the Federal Budget.” Tanner leads off with this:

The U.S. government is about to exceed its statutory debt limit of $14.3 trillion. But that actually underestimates the size of the fiscal time bomb that this country is facing. If one considers the unfunded liabilities of programs such as Medicare and Social Security, the true national debt could run as high as $119.5 trillion.

Moreover, to focus solely on debt is to treat a symptom rather than the underlying disease. We face a debt crisis not because taxes are too low but because government is too big. If there is no change to current policies, by 2050 federal government spending will exceed 42 percent of GDP. Adding in state and local spending, government at all levels will consume nearly 60 percent of everything produced in this country. Whether financed through debt or taxes, government that large would be a crushing burden to our economy and our liberties. (p. 1)

Government spending now consumes almost 40 percent of everything produced in this country. Imagine the lives of your children and their children if and when government spending consumes almost 60 percent of everything produced in this country. But wait — it can get worse. Here, Tanner projects federal spending under current law, through 2080:

Long-term spending projections (Tanner)

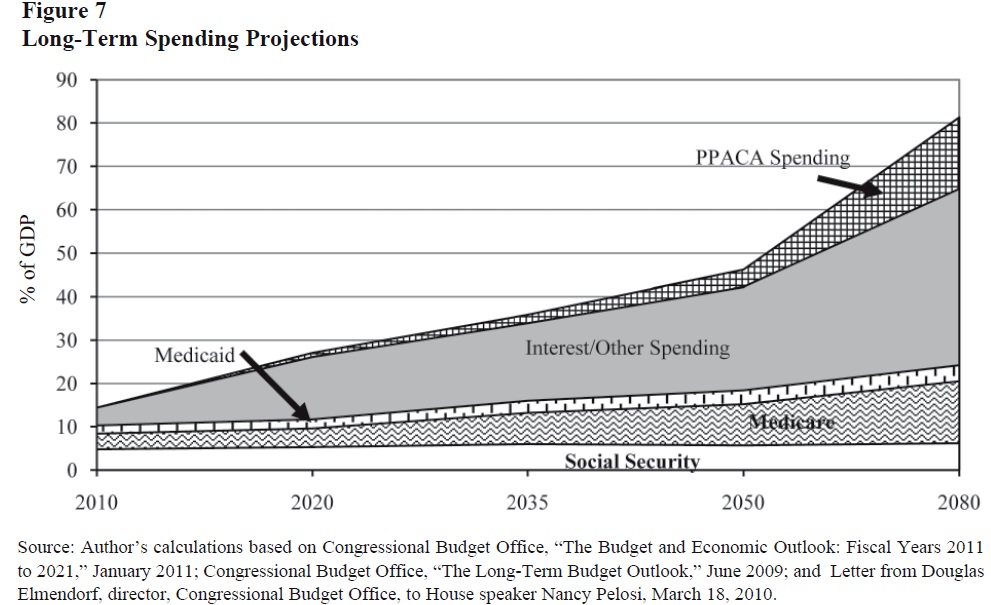
Add State and local spending and, by 2080, you have an economy whose entire output is claimed by government entities. Some of that output would be directed to individuals for their sustenance, of course. But the form of that sustenance — along with everything else — would be dictated and allocated by politicians and bureaucrats. They — and their favored intellectuals, artists, and athletes — would live reasonably well (though not nearly as well as they could in a free-market system), while the proles would lead lives of hard work, hard drink, and hard deaths. It would be the USSR all over again. And, as with the USSR, the misdirection of economic activity by politicians and bureaucrats would ensure economic stagnation.

It may not come to that, if there are enough voters who understand the consequences of unbridled government spending, and who put liberty and true prosperity above the illusory promises of security offered by the big-government crowd. But as time goes by and more voters become accustomed to handouts, they will become “European” in their embrace of the welfare state. Slippery slopes and death-spirals lead to the same slough of despond (second definition).

That said, is there a way to have “our” cake and eat it, too? Can the U.S. government raise enough money through borrowing or taxation to fend off the day of reckoning and attain the left’s dream of attaining “Europeanism”?

BORROWING A SEA OF TROUBLES

In fact, financial markets may help to reign in government spending by sending signals that cannot be ignored — if the U.S. government borrows money from willing lenders instead of just printing it. (Economist Karl Smith explains why printing money — deliberate inflation — is an unlikely course of action. He refers to “structured default,” which is explained here.) As government spending rises, and as voters and politicians (in the main) reject significant tax increases, government debt will rise to unprecedented heights. Here, from The Heritage Foundation’s 2011 Budget Chart Book, is a retrospective and prospective look at the size of the federal government’s debt in relation to GDP:

National debt set to skyrocket

Financial markets will reject U.S. government debt — or charge a lot for carrying it — long before it reaches the levels shown above. The events of year ago, when Greece’s financial bind came to a head, gave a hint of the likely reaction of markets to continued fiscal profligacy. Then, earlier this month, there was a sharp, brief stock-market sell off in response to an announcement by Standard & Poor’s about U.S. government debt (“‘AAA/A-1+’ Rating On United States of America Affirmed; Outlook Revised To Negative“):

  • We have affirmed our ‘AAA/A-1+’ sovereign credit ratings on the United States of America.
  • The economy of the U.S. is flexible and highly diversified, the country’s effective monetary policies have supported output growth while containing inflationary pressures, and a consistent global preference for the U.S. dollar over all other currencies gives the country unique external liquidity.
  • Because the U.S. has, relative to its ‘AAA’ peers, what we consider to be very large budget deficits and rising government indebtedness and the path to addressing these is not clear to us, we have revised our outlook on the long-term rating to negative from stable.
  • We believe there is a material risk that U.S. policymakers might not reach an agreement on how to address medium- and long-term budgetary challenges by 2013; if an agreement is not reached and meaningful implementation is not begun by then, this would in our view render the U.S. fiscal profile meaningfully weaker than that of peer ‘AAA’ sovereigns.

If there is no serious effort to control the growth of the U.S. government’s debt by scaling back “entitlements,” two things will happen: Interest rates will rise, thus compounding the problem, and lenders will back away. Megan McArdle outlines a plausible scenario:

Right now, when Treasury goes to sell new bonds, it enters a fairly robust market, with not just the Fed but a bunch of fairly price-inelastic Asian central banks who are willing to take on our bonds at whatever the market offers. If China exits the market, we will either need to borrow less, or attract new lenders by offering higher interest rates. Even a noticeable decrease in volume would force us to pay more for our deficits….

… A lot of people tend to assume that there will be warning signs telling us that we need to get our fiscal house in order: China will slow down its bond purchases, interest rates will gradually rise. But in fact, the lesson of fiscal crises is that the “warning signs” we’re watching for often are the crisis. Unless interest rates increase (or debt buying decrease–which is really the same thing) in a very gradual, orderly fashion, then by the time your interest rates rise, it is already too late to do anything easy; your debt service burden forces you into dramatic fiscal measures, or default.

According to economist Carmen Reinhart, who has made an intensive study of crises, there’s no reason to expect the change to be orderly and gradual. She says the lesson of history is pretty unequivocal: interest rates are not a good predictor of who is about to tip into a crisis. People are willing to lend at decent rates, until suddenly they’re barely willing to lend at all.

When you look at how much of our debt comes due by the end of 2012, it’s easy to see how fast higher interest rates could turn into a real problem for us. To be sure, we’re no Japan–but that’s not necessarily a happy thought, because Japan finances something like 95% of its debt from its pool of thrifty (and nationalistic) savers. Their stock of lenders probably isn’t going anywhere. Ours might.

Lawrence Kotlikoff agrees:

…CBO’s baseline budget updates suggest the date for reaching what Carmen Reinhart, Kenneth Rogoff and other prominent economists believe is a critical insolvency threshold — a 90 percent ratio of federal debt held by the public to gross domestic product — has moved four years closer, in just nine months!…

And if foreigners balk at buying U.S. debt, why would Americans fill the breach? Is there a patriotic duty to finance socialism?

In summary, it seems unlikely that the U.S. can erect a full-blown welfare state on the backs of lenders. Can it be done on backs of taxpayers?

TAXING “THE RICH” — AND A LOT OF OTHERS, TOO?

The short answer to the preceding question is “no.” In evidence, I return to Michael Tanner’s “Bankrupt: Entitlements and the Federal Budget“:

Many observers suggest that we can simply tax the rich. For example, the Center for American Progress has recommended, among other things, imposing a 5–7 percent surtax on households with incomes above $500,000 per year, eliminating the cap on Social Security payroll taxes, increasing the estate tax, and raising the top marginal tax rate on capital gains and dividends.60 That would potentially raise the total marginal tax burden on some people to well above 50 percent.

Setting aside the simple immorality of government taking such an enormous portion of anyone’s income, there are many reasons to be skeptical of such an approach, starting with the fact that it may not actually generate any additional revenue….

…[I]ncentives matter. At some point taxes become high enough to discourage economic activity and therefore produce less revenue than would be predicted under a more static analysis….

But even if one assumes that taxes can be raised without having any impact on economic growth, taxing the rich still wouldn’t get us out of our budget hole—because the hole is quite simply bigger than the amount of revenue we could raise from taxing the rich even if there were no disincentives. To put it in admittedly oversimplified perspective: our current obligations, including both implicit and explicit debt, total more than 900 percent of GDP. The combined wealth of everyone in the United States who earns at least $1 million per year equals roughly 100 percent of GDP…. Therefore, you could confiscate the entire wealth of every millionaire in the United States and still barely make a dent in the amount we will owe.

Clearly, therefore, any tax increases would have to extend well beyond “the rich.” In fact, the Congressional Budget Office said in 2008 that in order to pay for all currently scheduled federal spending both the corporate tax rate and top income tax rate would have to be raised from their current 35 percent to 88 percent, the current 25 percent tax rate for middle-income workers to 63 percent, and the 10 percent tax bracket for low-income workers to 25 percent. It is likely, given increased spending since then, that the required tax levels would be even higher today.

Regardless of how one feels about taxing the rich, taxes at those levels would be devastating to future economic growth.

Harvard economist Martin Feldstein points out that the actual loss from tax increases to the private sector is a combination of the confiscated revenue as well as a hidden cost of the actual increase, known as deadweight loss. This hidden cost can be very expensive. Feldstein calculates that “the total cost per incremental dollar of government spending, including the revenue and the deadweight loss, is . . . a very high $2.65. Equivalently, it implies that the marginal excess burden per dollar of revenue is $1.65.” This means that for every 1 percent of GDP needed to be raised in revenue, the equivalent of 2.65 percent of GDP needs to be extracted from the private sector first.

Clearly, tax increases required to finance an increase in spending of more than 40 percent of GDP would place an impossible burden on the private economy. (pp. 13-4, source notation omitted)

One more thing (from Table 1 of the Tax Foundation’s “Fiscal Facts“): For 2008, federal income tax returns with adjusted gross incomes in the top 1 percent accounted for 38 percent of income taxes; the top 5 percent, 59 percent; the top 10 percent, 70 percent; the top 25 percent, 86 percent; and the top 50 percent, 97 percent. Not only that, but the top 10 percent of American taxpayers is taxed more heavily than the top 10 percent in other developed countries, including those “advanced” European countries that American leftists would like to emulate. (See “No Country Leans on Upper-Income Households as Much as U.S.” at the Tax Foundation’s Tax Policy Blog.) And the left has the gall to claim that America’s “rich” aren’t paying enough taxes!

VIVE LA RÉSISTANCE

It will not do simply to put an end to the U.S. government’s spending spree; too many State and local governments stand ready to fill the void, and they will do so by raising taxes where they can. As a result, some jurisdictions will fall into California- and Michigan-like death-spirals while jobs and growth migrate to other jurisdictions. Contemporary mercantilists to the contrary, the “winners” are “losers,” too. Even if Congress resists the urge to give aid and comfort to profligate States and municipalities at the expense of the taxpayers of fiscally prudent jurisdictions, the high taxes and anti-business regimes of California- and Michigan-like jurisdictions impose deadweight losses on the whole economy. If you believe otherwise, you believe in the broken-window fallacy, wherein an economically destructive force (natural or governmental) is credited with creating jobs and wealth because it leads to the visible expenditure of effort and resources.

So, the resistance to economically destructive policies cannot end with efforts to reverse the policies of the federal government. But given the vast destructiveness of those policies — “entitlements” in particular — the resistance must begin there. Every conservative and libertarian voice in the land must be raised in reasoned opposition to the perpetuation of the unsustainable “promises” currently embedded in Social Security, Medicare, and Medicaid — and their expansion through Obamacare. To those voices must be added the voices of “moderates” and “liberals” who see through the proclaimed good intentions of “entitlements” to the economic and libertarian disaster that looms if those “entitlements” are not pared down to their original purpose: providing a safety net for the truly needy.

The alternative to successful resistance is stark: more borrowing, higher interest payments, unsustainable debt, higher taxes, and economic stagnation (at best).

Estimating the Rahn Curve: Or, How Government Inhibits Economic Growth

UPDATED 12/13/14 — This update consists of a comment about my estimate of the Rahn curve. I have just published a much better estimate of the curve for the post-World War II era.

UPDATED 12/28/11 — This update incorporates GDP and government spending statistics for 2010 and corrects a minor discrepancy in the estimation of government spending. Also, there are new, easier-to-read graphs. The bottom line is the same as before: Government spending and everything that goes with it (including regulation) is destructive of economic growth.

UPDATED 09/19/13 — This version incorporates two later posts “Estimating the Rahn Curve: A Sequel” (01/24/12) and “More Evidence for the Rahn Curve” (05/27/12).

*     *     *

The theory behind the Rahn Curve is simple — but not simplistic. A relatively small government with powers limited mainly to the protection of citizens and their property is worth more than its cost to taxpayers because it fosters productive economic activity (not to mention liberty). But additional government spending hinders productive activity in many ways, which are discussed in Daniel Mitchell’s paper, “The Impact of Government Spending on Economic Growth.” (I would add to Mitchell’s list the burden of regulatory activity, which accumulates with the size of government.)

What does the Rahn Curve look like? Daniel Mitchell estimates this relationship between government spending and economic growth:

Rahn curve (2)

The curve is dashed rather than solid at low values of government spending because it has been decades since the governments of developed nations have spent as little as 20 percent of GDP. But as Mitchell and others note, the combined spending of governments in the U.S. was 10 percent (and less) until the eve of the Great Depression. And it was in the low-spending, laissez-faire era from the end of the Civil War to the early 1900s that the U.S. enjoyed its highest sustained rate of economic growth.

Here is a graphic look at the historical relationship between government spending and GDP growth:

(Source notes for this graph and those that follow are at the bottom of this post.)

The regression lines are there simply to emphasize the long-term trends. The relationship between government spending as a percentage of GDP (G/GDP) and real GDP growth will emerge from the following graphs. There are chronological gaps because the Civil War, WWI, the Great Depression, and WWII distorted the relationship between G/GDP and economic growth. Large wars inflate government spending and GDP. The Great Depression saw a large rise in G/GDP, by pre-Depression standards, even as the economy shrank and then sputtered to a less-than-full recovery before the onset of WWII.

Est Rahn curve 1792 1861

Est Rahn curve 1866 1917

Est Rahn curve 1792 1917

Est Rahn curve 1946-2010

The graphs paint a consistent picture: Higher G/GDP means lower growth. There is one inconsistency, however, and that is the persistence of growth in the range of 2 to 4 percent during the post-WWII era, despite G/GDP in the range of 25-45 percent. That is not the kind of growth one would expect, given the relationships that obtain in the earlier eras. (The extrapolated trend line for 1946-2009 comes into use below.)

There are at least five plausible — and not mutually exclusive — explanations for the discrepancy. First, there is the difficulty of estimating GDP for years long past. Second, it is almost impossible to generate a consistent estimate of real GDP spanning two centuries; current economic output is vastly greater in volume and variety than it was in the early days of the Republic. Third, productivity gains (advances in technology, management techniques, and workers’ skills) may offset the growth-inhibiting effects of government spending, to some extent. Fourth, government regulations and active interventions (e.g., antitrust activity, the income tax) have a cumulative effect that operates independently of G/GDP. Regulations and interventions may have had an especially strong effect in the early 1900s (see the second graph in this post). The effects of regulations and interventions may diminish with time because of  adaptive behavior (e.g., “capture” of regulatory bodies).

Finally, and perhaps most importantly, there is the shifting composition of government spending. At relatively low levels of G/GDP, G consists largely of government programs that usurp and interfere with private-sector functions by diverting resources from productive uses to uses favored by politicians, bureaucrats, and their patrons. Higher levels of G/GDP — such as those we in the United States have known since the end of WWII — are reached by the expansion of the welfare state. Government spending (at all levels) on so-called social benefits accounted for only 7 percent of G and 0.8 percent of GDP in 1929; in 2009, it accounted for 36 percent of G and 15 percent of GDP. The provision of “social benefits” brings government into the business of redistributing income, which discourages work, saving, and capital formation to some extent, but doesn’t impinge directly on commerce. Therefore, I would expect G to be less damaging to GDP growth at higher levels of G/GDP — which is the message to be found in the contrast between the experience of 1946-2009 and the experience of earlier periods.

With those thoughts in mind, I present this empirical picture of the relationship between G/GDP and GDP growth in the United States:

Est Rahn curve 1792-2010

The intermediate points, unfortunately, are missing because of the chronological gaps mentioned above. But, as indicated by the five earlier graphs, it is entirely reasonable to infer from the preceding graph a strong relationship between GDP growth and changes in G/GDP throughout the history of the Republic.

It is possible to obtain a rough estimate of the downward sloping portion of the Rahn curve by focusing on two eras: the post-Civil War years 1866-1890 — before the onset of “progressivism,” with its immediate and strong negative effects — and the post-WWII years 1946-2009. Thus:

Est Rahn curve rough sketch

My rough estimate is appropriately “fuzzy” and somewhat more generous than Daniel Mitchell’s, which is indicated by the heavy black line. In light of my discussion of the shifting composition of G as G/GDP becomes relatively large, I  have followed the slope of the trend line for 1792-2010; that is, every 1 percentage-point increase in G/GDP yields a decrease in the growth rate of about 0.07 percent. That seemingly small effect becomes a huge one when G/GDP rises over a long period of time (as has been the case for more than a century, with no end in sight).

For the record, the best fit through the “fuzzy” area is:

Annual rate of growth = -0.066(G/GDP) + 0.054.

[A revised and more realistic estimate for the post-World War II era is

Real rate of growth = -0.372(G/GDP) + 0.067(BA/GDP) + 0.080 ,

where the real rate of growth is the annualized rate over a 10-year period, G/GDP is the fraction of GDP spent by government (including social transfers) over the preceding 10-year period, and BA/GDP represents business assets as a fraction of GDP for the preceding 10-year period.]

Again, it’s the annualized rate of growth over a 10-year span, as a function of G/GDP (fraction of GDP spent by governments at all levels) in the preceding 10 years. The new term, BA/GDP, represents the constant-dollar value of private nonresidential assets (i.e., business assets) as a fraction of GDP, averaged over the preceding 10 years. The idea is to capture the effect of capital accumulation on economic growth, which I didn’t do in the earlier analysis.

Maximum GDP growth seems to occur when G/GDP is 2-4  percent. That is somewhat less than the 7-percent share of GDP that was spent on national defense, public order, and safety in 2010. The excess represents additional “insurance” against predators, foreign and domestic. (The effectiveness of the additional “insurance” is a separate question, though I am inclined to err on the side of caution when it comes to defense and law enforcement. Those functions are not responsible for the economic woes facing America’s taxpayers.)

If G/GDP reaches 55 percent — which it will if present entitlement “commitments” are not curtailed — the “baseline” rate of growth will shrink further: probably to less than 2 percent. And thus America will remain mired in its Mega-Depression.

*     *     *

Source notes:

Estimates of real and nominal GDP, back to 1790, come from the feature “What Was the U.S GDP Then?” at MeasuringWorth.com.

Estimates of government spending (federal, State, and local) come from USgovernmentspending.com; Statistical Abstracts of the United States, Colonial Times to 1970: Part 2. Series Y 533-566. Federal, State, and Local Government Expenditures, by Function; and the Bureau of Economic Analysis (BEA), Table 3.1. Government Current Receipts and Expenditures (lines 34, 35).

I found the amount spent by governments (federal, State, and local) on national defense and public order and safety by consulting BEA Table 3.17. Selected Government Current and Capital Expenditures by Function.

The BEA tables cited above are available here.

*     *     *

ADDENDUM: THE RAHN CURVE: A SEQUEL

In the original post (above) I note that maximum GDP growth occurs when government spends two to four percent of GDP. The two-to-four percent range represents the share of GDP claimed by American governments (federal, State, and local) throughout most of the 19th century, when government spending exceeded five percent of GDP only during the Civil War.

Of course, until the early part of the 20th century, when Progressivism began to make itself felt in Americans’ tax bills, governments restricted themselves (in the main) to the functions of national defense, public order, and safety — the terms used in national-income accounting. It is those functions — hereinafter called defense and justice — that foster liberty and economic growth because they protect peaceful, voluntary activity. Effective protection probably would cost more than four percent of GDP in these parlous times. But an adequate figure, except in the rare event of a major war, is probably no more than seven percent of GDP — the value for 2010, which includes the cost of fighting in Iraq and Afghanistan.

In any event, government spending — even on defense and justice — is impossible without private economic activity. It is that activity which yields the wherewithal for the provision of defense and justice. Once those things have been provided, the further diversion of resources by government is economically destructive. Specifically, from “Estimating the Rahn Curve” (above):

It is possible to obtain a rough estimate of the downward sloping portion of the Rahn curve by focusing on two eras: the post-Civil War years 1866-1890 — before the onset of “progressivism,” with its immediate and strong negative effects — and the post-WWII years 1946-2009. Thus:

Est Rahn curve rough sketch

My rough estimate is appropriately “fuzzy” and somewhat more generous than Daniel Mitchell’s [in “The Impact of Government Spending on Economic Growth”], which is indicated by the heavy black line. In light of my discussion of the shifting composition of G as G/GDP becomes relatively large, I  have followed the slope of the trend line for 1792-2010; that is, every 1 percentage-point increase in G/GDP yields a decrease in the growth rate of about 0.06 percent. That seemingly small effect becomes a huge one when G/GDP rises over a long period of time (as has been the case for more than a century, with no end in sight).

The following graphs offer another view of the devastation wrought by the growth of government spending — and regulation. (Sources are given in “Estimating the Rahn Curve.”) I begin with the share of GDP which is not spent by government:

Est Rahn curve sequel_priv GDP as pct total GDP

A note about my measure of government spending is in order. National-income accounting purists would insist that transfer payments (mainly Social Security, Medicare, and Medicaid) should not count as spending, even though I count them as such. But what does it matter whether money is taken from taxpayers and given to retired persons (as Social Security) or to government employees (as salary and benefits) or contractors (as reimbursement for products and services delivered to government)? All government spending represents the transfer of claims on resources from persons who earned those claims to other persons, who either did something of questionable value for the money (government employees and contractors) or nothing (e.g., retirees).

In any event, it is obvious that Americans enjoyed minimal government until the early 1900s, and have since “enjoyed” a vast expansion of government. Here is a closer look at the trend from 1900 onward:

Est Rahn curve sequel_private GDP pct total GDP since 1900

This is a good point at which to note that the expansion of government is understated by the growth of government spending, which only imperfectly captures the effects of the rapidly growing regulatory burden on America’s economy. The combined effects of government spending and regulation can be seen in this “before” and “after” depiction of growth rates:

Est Rahn curve sequel_growth rate of private GDP

(I omitted the major wars and the Great Depression because their inclusion would give an exaggerated view of economic growth in the aftermath of abnormally suppressed private economic activity.)

The marked diminution of growth  after 1900 has led to what I call America’s Mega-Depression. Note the similarity between the downward path of private sector GDP (two graphs earlier) and the downward path of the Mega-Depression in the following graph:

Est Rahn curve sequel_mega-depression

What is the Mega-Depression? It is a measure of the degree to which real GDP has fallen below what it would have been had economic growth continued at its post-Civil War pace. As I explain here, the Mega-Depression began in the early 1900s, when the economy began to sag under the weight of Progressivism (e.g., trust-busting, regulation, the income tax, the Fed). Then came the New Deal, whose interventions provoked and prolonged the Great Depression (see, for example, this, and this). From the New Deal and the Great Society arose the massive anti-market/initiative-draining/dependency-promoting schemes known as Social Security, Medicare, and Medicaid. The extension and expansion of those and other intrusive government programs has continued unto the present day (e.g., Obamacare), with the result that our lives and livelihoods are hemmed in by mountains of regulatory restrictions.

Regulation aside, government spending — except for defense and justice — is counterproductive. Not only does it fail to stimulate the economy in the short run, but it also robs the economy of the investments that are needed for long-run growth.

*     *     *

ADDENDUM: MORE EVIDENCE FOR THE RAHN CURVE

Here:

[W]e have some new research from the United Kingdom. The Centre for Policy Studies has released a new study, authored by Ryan Bourne and Thomas Oechsle, examining the relationship between economic growth and the size of the public sector.

The chart above compares growth rates for nations with big governments and small governments over the past two decades. The difference is significant, but that’s just the tip of the iceberg. The most important findings of the report are the estimates showing how more spending and more taxes are associated with weaker performance.

Here are some key passages from the study.

Using tax to GDP and spending to GDP ratios as a proxy for size of government, regression analysis can be used to estimate the effect of government size on GDP growth in a set of countries defined as advanced by the IMF between 1965 and 2010. …As supply-side economists would expect, the coefficients on the tax revenue to GDP and government spending to GDP ratios are negative and statistically significant. This suggests that, ceteris paribus, a larger tax burden results in a slower annual growth of real GDP per capita. Though it is unlikely that this effect would be linear (we might expect the effect to be larger for countries with huge tax burdens), the regressions suggest that an increase in the tax revenue to GDP ratio by 10 percentage points will, if the other variables do not change, lead to a decrease in the rate of economic growth per capita by 1.2 percentage points. The result is very similar for government outlays to GDP, where an increase by 10 percentage points is associated with a fall in the economic growth rate of 1.1 percentage points. This is in line with other findings in the academic literature. …The two small government economies with the lowest marginal tax rates, Singapore and Hong Kong, were also those which experienced the fastest average real GDP growth.

My own estimate (see above) for the United States, is that

every 1 percentage-point increase in G/GDP yields a decrease in the growth rate of about 0.07 percent. That seemingly small effect becomes a huge one when G/GDP rises over a long period of time (as has been the case for more than a century, with no end in sight).

In other words, every 10 percentage-point increase in the ratio of government spending to GDP causes a not-insignificant drop of 0.7 percentage points in the rate of growth. That is somewhat below the estimate quoted above (1.1 percentage points), but surely it is within the range of uncertainty that surrounds the estimate.

Keynesianism: Upside-Down Economics in the Collectivist Cause

A recent post, “Government in Macroeconomic Perspective,” is dauntingly long and replete with equations. The equations are simple ones, but may be off-putting to readers who are allergic to mathematical notation. Herewith is an abridged version of the post. Please refer to the original for details of the argument and references to supporting material.

A nation’s aggregate economic activity usually is measured by its Gross Domestic Product (GDP). I accept GDP as an aggregate, monetary measure of national output. But it is impossible to sum the true value of the myriad economic transactions that GDP is supposed to represent because each transaction means something different to the participants in the transaction; that is, the true value of economic goods is subjective.

GDP, nevertheless, affords a rough measure of the general level of a nation’s material output, that is, the rate at which goods and services are being produced (exclusive of such important things as “household production”). All things being the same, a large fraction of a nation’s citizens — but certainly not all of them — will be better off materially if GDP is growing and worse off if it is shrinking. Governmental activities have led to an economy that produces a small fraction of its potential output. And yet, the true believers in big government seek to make it larger and ever more destructive.

Government spending – beyond a certain level — does not increase GDP, but generally redistributes and decreases it. Government spending is beneficial up to the point where it becomes a drain on GDP; that is, at the point where government exceeds a minimal, protective role and acts in ways that discourage productive effort.

Government spending enables governmental activities of five types:

  1. transfer payments to individuals (e.g., Social Security), which impose costs because the payments transfer income to those who did not earn from those who did;
  2. de facto transfer payments, namely, the compensation of government employees, and the compensation that flows to the employees, shareholders, and creditors of government contractors – all of which must be financed by private-sector entitites;
  3. purchases of consumables and capital that are used directly by government in the provision of government services (e.g., fuel for government vehicles, electricity for government buildings, government vehicles, and government buildings);
  4. the continuation, initiation, modification, and enforcement of tax codes, regulations, administrative procedures, statutes, ordinances, executive orders, and judicial decrees; and
  5. the financing of items 1 – 4.

The net effect of items 1 and 2 is almost certainly a reduction of GDP. Why? The diversion of income to the unproductive (e.g., persons on Social Security) and counterproductive (e.g., government employees who write and enforce regulations) – by whatever means (taxing or borrowing) is bound to disincentivize work, saving, innovation, and investment. That causes GDP to be lower than it otherwise would be, but the effect is multiplicative, not merely a matter of addition or subtraction. (A Keynesian would argue that the actions encompassed in item 1 tend to raise GDP because the recipients of nominal transfer payments probably have higher marginal propensities to consume than do the persons from whom the transfer payments are exacted. This facile claim overlooks the disincentivizing effects of taxation on the more productive components of an economy, and on the resulting reduction in work effort and growth-producing investment.)

Similarly, the diversion of resources to items 3 and 4 cannot be thought of as additions to or subtractions from GDP, but as multiplicative, because of the same kind of disincentivizing leverage. For example, one effect of item 4 is the unobserved but very real burden placed on the private sector by federal regulations. It has been estimated, reliably, that those regulations impose a hidden cost greater than 15 percent of GDP.

Then there is item 5: financing. In the end, it matters not whether governmental activities are financed by borrowing or taxation, and if by borrowing, whether the lenders are domestic or foreign. This is because it is government spending that diverts resources from private uses, and it is government spending that enables destructive governmental activities (e.g., the writing and enforcement of regulations).

Government long ago became larger than necessary to perform its minimal protective functions. Consider what has happened since 1890, when the early legislative “accomplishments” of the Progressive Era – the establishment of the Interstate Commerce Commission in 1887 and the passage of the Sherman Antitrust Act in 1890 – began to weigh on the economy.

Real GDP (in year 2005 dollars) was $319 billion in 1890; it had risen to $13.3 trillion in 2011 — a compound growth rate of about 3.1 percent. But real GDP in 2011 would have been more than $104 trillion had growth continued at an annual rate of 4.9 percent after 1890 (the rate of growth from 1866 through 1890). What happened? The heavy hand of government (at all levels) — especially after 1929 — made itself felt by discouraging work, discouraging the saving that makes investment possible, discouraging innovation, and (even to the extent that innovation persists) discouraging the investments required to bring innovation on line. How? It begins with the diversion of resources to governmental activities, and is compounded by the cumulative disincentivizing effects of taxes, regulations, administrative procedures, statutes, ordinances, executive orders, and judicial decrees.

Defenders of big government will say that the rate of growth could not have been sustained at something like 5 percent. But such an assertion, if it is based on anything other than ignorance, is based on a simple, sub-exponential model of growth, where returns on investment are diminishing. This model overlooks the effects of innovation and recombination (the use of previous innovations in new ways). If the model of ever-diminishing growth were correct, the U.S. economy would not have experienced rising growth in the first 20 to 25 years after the end of World War II. No, the defenders of sub-exponential growth must look to the Great Society — and to the continuous expansion of the regulatory-welfare state — if they wish to understand the artificially low rate at which the economy is growing: currently about 2 percent a year.

Despite what I have said here about the deleterious effects of bigger-than-minimal government, there are true believers who maintain that the greater the scope and scale of government, the better and richer America will be. These true believers evidently have not considered the cumulative effect  of big government on the incomes and wealth of Americans. As the preceding analysis suggests, those relatively few Americans who would not be better off with minimal government would be the beneficiaries of a pool of charitable giving that is vastly greater than the present pool.

That big government might be harmful, even to the “little people” who are its supposed beneficiaries, is of no account to its worshipers – as long as they run it, advise in the running of it, profit by it, or simply enjoy watching it run roughshod over the lives and fortunes of others. Power and the vicarious enjoyment of power are habit-forming drugs.

The ranks of true believers are peopled such left-wing economists as Brad DeLong, James K. Galbraith, and Paul Krugman. They adhere to and popularize two major rationalizations of big government — the Keynesian fallacy and the myth that government is the same as community.

In “A Keynesian Fantasy Land” I discuss six reasons for the ineffectiveness of Keynesian “stimulus”; in summary:

1. The “leakage” to imports

“Part of the extra spending stimulus fails to stimulate domestic income because as much as 0.3 of the multiplier might leak out through extra imports.” (Anthony de Jasay, “Micro, Macro, and Fantasy Economics,” Library of Economics and Liberty, December 6, 2010)

2. The disincentivizing effects of government borrowing and spending

Even if additional debt does not crowd out private-sector borrowing to finance business expansion, it will nevertheless inhibit investments in business expansion. This inhibiting effect is compounded by the reasonable expectation that many items in a “stimulus” package will become permanent fixtures in the government’s budget

3. The timing-targeting problem

The lag between the initial agitation for “stimulus” and its realization. In the extreme, the lag can be so great as to have no effect other than to divert employed resources from private to government uses. But even where there is a relatively brief lag, “stimulus” spending is essentially wasted if the result is simply to divert already employed resources from private to government uses.

4. Inadequate Aggregate Demand (AD) is a symptom, not a cause

A drop in AD usually is caused by an exogenous event, and that exogenous event usually is a credit crisis. Pumping money into the economy — especially when it results in the bidding up the prices of already employed resources — does not reinflate the punctured credit bubble that caused the slowdown.

5. Inequity, moral hazard, and their consequences

Favorable treatment of defaulters and failing companies generates considerable popular resentment, which — in the present instance — has found a vocal and politically potent outlet in the Tea Party movement. Favorable treatment of defaulters and failing companies also creates moral hazard; that is, it encourage unwise risk-taking that can (and probably will) spark future crises, leading the government to assume more obligations and impose more regulations, in a futile effort to change human nature.

6. The human factor

Those who cling to the Keynesian multiplier would like the world to comply with it. But the world does not because it is filled with people, whose behavior is not determined (or described) by a simplistic model but by their responses to incentives, their political predispositions, their informed and reasonable skepticism about the consequences of government intervention in economic matters, and — above all else — their fallibility.

In truth, the Keynesian multiplier is a mathematical fiction, as explained here, and government spending is in fact destructive of economic growth, as discussed here and in some of the posts listed at the end.

“We owe it to ourselves” is a phrase used by Paul Krugman (among others on the left). It is a variant of the stock rationale for socializing gains and losses: “We’re all in this together.” As if the citizens of the United States were members of an extraordinarily large community, with a perpetual town-hall meeting conducted by the government of the United States.

Consider the intellectual dishonesty of Krugman’s claim that “we” owe the debt of the U.S. government to “ourselves.” Who are “we”? If government borrows money and spends it on goodies for Congressman X, Y, and Z’s districts, how do I get my cut? Or does the happiness generated in Congressman X, Y, and Z’s districts simply radiate in waves across the country, eventually reaching me and making me feel better?

If the borrowed money makes (some) people in Congressman X, Y, and Z’s districts better off, why is it that “we” (i.e. the rest of us and/or our descendants) end up repaying the debt that made those others better off? I do not understand how I “owe it to myself” when (a) I didn’t ask to borrow the money and (b) I gained nothing as a result of the borrowing.

You might claim that my personal wishes are of no account because Congress and the president are duly elected by majorities of voters. But that is tantamount to saying that Congress and the president possess a kind of omniscient super-consciousness that somehow overrides the harm, hate, and discontent that flow from their acts.

The left succeeds, in large part, because apologists for big government — from Krugman to Obama — are skillful practitioners of slippery logic. An assumption here, an assumption there, and government spending is made out to be a source of enrichment. The hard truth is that government spending — and the big government that it supports — is the source of America’s impending impoverishment.

Related posts:
Trade Deficit Hysteria
Trade, Government Spending, and Economic Growth
The Causes of Economic Growth
In the Long Run We Are All Poorer
A Short Course in Economics
Addendum to a Short Course in Economics
The Price of Government
Gains from Trade
The Price of Government Redux
The Indivisibility of Economic and Social Liberty
Trade
The Mega-Depression
As Goes Greece
Ricardian Equivalence Reconsidered
The Real Burden of Government
Toward a Risk-Free Economy
Enough of “Social Welfare”
Subjective Value: A Proof by Example
Microeconomics and Macroeconomics
The Illusion of Prosperity and Stability
Society and the State
I Want My Country Back
Estimating the Rahn Curve: Or, How Government Inhibits Economic Growth
Our Enemy, the State
“Intellectuals and Society”: A Review
Subjective Value: A Proof by Example
The Stagnation Thesis
Taxing the Rich
More about Taxing the Rich
Does World War II “Prove” Keynesianism?
Money, Credit, and Economic Fluctuations
A Keynesian Fantasy Land
The Keynesian Fallacy and Regime Uncertainty
Creative Destruction, Reification, and Social Welfare
Why the “Stimulus” Failed to Stimulate
The “Jobs Speech” That Obama Should Have Given
Say’s Law, Government, and Unemployment
Regime Uncertainty and the Great Recession
Regulation as Wishful Thinking
The Real Multiplier
Vulgar Keynesianism and Capitalism
Why Are Interest Rates So Low?
Merit Goods, Positive Rights, and Cosmic Justice
The Commandeered Economy
We Owe It to Ourselves
Estimating the Rahn Curve: A Sequel
The Real Multiplier (II)
Lay My (Regulatory) Burden Down
The Burden of Government
Economic Growth Since World War II
More Evidence for the Rahn Curve
“Big SIS”: A Review
The Capitalist Paradox Meets the Interest-Group Paradox
Progressive Taxation Is Alive and Well in the U.S. of A.
The Obama Effect: Disguised Unemployment
Some Thoughts about Leftist Hypocrisy
The State as Jailer
Where We Are, Economically

Government in Macroeconomic Perspective

 I. INTRODUCTION

A nation’s aggregate economic activity usually is measured by its Gross Domestic Product (GDP). I accept GDP as an aggregate, monetary measure of national output. But it is impossible to sum the true value of the myriad economic transactions that GDP is supposed to represent because each transaction means something different to the participants in the transaction; that is, the true value of economic goods is subjective. (See, for example, Peter Boettke’s “Austrian School of Economics,” at The Concise Encyclopedia of Economics., and my posts, “Subjective Value: A Proof by Example” and “Microeconomics and Macroeconomics.”)

GDP, nevertheless, affords a rough measure of the general level of a nation’s material well-being. All things being the same, a large fraction of a nation’s citizens — but certainly not all of them — will be better off materially if GDP is growing and worse off if it is shrinking. But no one who is paying attention to the state of the nation should mistake material progress for real progress. (See, for example, “I Want My Country Back.”)

The usual way of representing GDP is called the expenditure method. In simple form, it expresses GDP this way:

GDP = private consumption + gross investment + government spending + (exportsimports), or

GDP = C + I + G + (X – M)

Note: “Gross” means that GDP measures production regardless of the various uses to which that production can be put. Production can be used for immediate consumption, for investment in new fixed assets or inventories, or for replacing depreciated fixed assets. “Domestic” means that GDP measures production that takes place within the country’s borders. In the expenditure-method equation given above, the exports-minus-imports term is necessary in order to null out expenditures on things not produced in the country (imports) and add in things produced but not sold in the country (exports). (Taken from “Gross domestic product” at Wikipedia. See also Mack Ott’s “National Income Accounts” at The Concise Encyclopedia of Economics.)

This equation has become so familiar that its correctness is taken for granted. But a bit of reflection reveals it as a model of inconsistency. The dichotomy between consumption and investment is sensible. But the goods acquired and sold in international trade are of the same two types; there is no reason to segregate them from consumption and investment. This is especially true because the sum of consumption and investment is greater than it would be in the absence of international trade. Government, on the other hand, is a net consumer of economic output, not a net producer of it, as the “+ G” term might suggest.

With that background, I will offer an alternative to the standard expenditure method of describing GDP. The journey is step-wise: from a closed economy without international trade or government to an economy with international trade, but without government, to an economy with both international trade and government. Along the way, I fully acknowledge the importance of government as a contributor to GDP, as long as its role is to foster beneficial exchange by maintaining the rule of law and defending Americans from predators, at home and abroad.

That said, government activities (as reflected in total government spending) have led to an economy that produces a small fraction of its potential output. And yet, the true believers in big government seek to make it larger and ever more destructive. I expand on these points at length in Part II, An Alternative Expenditure Model; Part III, The High Cost of Big Government; and Part IV, The Heart of the Problem: Big-Government Worship and Pseudo-Intellectualism. (Continued below the fold.) Continue reading “Government in Macroeconomic Perspective”

Higher Taxes, Higher Government Spending, Slower Economic Growth

J.D. Foster and Curtis Dubay, writing at The Foundry (“Of Course Higher Taxes Slow Growth — A Response to Diamond and Saez“), make mincemeat of Peter Diamond and Emmanuel Saez’s arguments for higher taxes on “the rich.” Implicit in Foster and Dubay’s takedown of Diamond and Saez is the demonstrably strong (and negative relationship) between government spending and economic growth.

Spending is funded by taxes, after all. And even when spending is funded by borrowing it amounts to a tax on the productive sectors of the economy. How is that? When government sell bonds to the public it redirects money from productive uses in the private sector to unproductive and counter-productive uses in the so-called public sector (i.e., government). The thievery is no less destructive — but more apparent — when the Fed creates money out of thin air to finance government spending.

So, the focus should be on spending, for which taxation is a proxy. The effect of government spending on economic growth is nothing less than disastrous. I have treated the subject at length in “Estimating the Rahn Curve: Or, How Government Inhibits Economic Growth.” Here is another version of the final graph in that post:

The bottom line is that for every 10 percentage points by which government spending rises, the rate of growth declines by 0.7 percentage points. If you think that 0.7 percent is negligible, try compounding it over a lifespan of 80 years. In that time, a sustained 10 percent rise in government spending will reduce the average person’s real income by more than 40 percent.

That, my friends, is soak-the-rich Obamanomics at work. Apologists for Obamanomics, like Diamond and Saez, should be ashamed of themselves for abetting economically destructive demagoguery.

Related posts:
The Causes of Economic Growth
A Short Course in Economics
Addendum to a Short Course in Economics
Enough of “Social Welfare”
The Case of the Purblind Economist
Economic Growth since WWII
The Price of Government
Does the Minimum Wage Increase Unemployment?
The Price of Government Redux
The Mega-Depression
The Real Burden of Government
Toward a Risk-Free Economy
The Rahn Curve at Work
The Illusion of Prosperity and Stability
Society and the State
The “Forthcoming Financial Collapse”
Estimating the Rahn Curve: Or, How Government Inhibits Economic Growth
The Deficit Commission’s Deficit of Understanding
Undermining the Free Society
The Bowles-Simpson Report
The Bowles-Simpson Band-Aid
Build It and They Will Pay
Government vs. Community
The Stagnation Thesis
Government Failure: An Example
Taxing the Rich
More about Taxing the Rich
Voluntary Taxation
Money, Credit, and Economic Fluctuations
A Keynesian Fantasy Land
“Tax Expenditures” Are Not Expenditures
The Keynesian Fallacy and Regime Uncertainty
Why the “Stimulus” Failed to Stimulate
The “Jobs Speech” That Obama Should Have Given
Regime Uncertainty and the Great Recession
The Real Multiplier
Vulgar Keynesianism and Capitalism
Why Are Interest Rates So Low?
Don’t Just Stand There, “Do Something”
Economic Growth Since World War II
The Commandeered Economy
We Owe It to Ourselves
In Defense of the 1%
The Real Multiplier (II)

The Burden of Government

When the state is more than a “night watchman,” its cost and intrusiveness diminish liberty and prosperity. (See this and this, for example.) Thus it has come to this: Government takes far more from productive Americans than it returns to them in the form of protection from foreign and domestic predators.

This point is overlooked by the keepers of national-income accounts. To them, government spending (which properly includes so-called transfer payments) adds to GDP. In fact, it detracts from GDP. It is a tax on the output of the private sector. The following graph indicates the size of the tax and its growth with time.


Sources: See footnote.

Some observations:

  • In 2010, the average output of a private worker was worth $114,000; government confiscated 40 percent of that output, leaving $68,000 in the private sector. (These estimates do not reflect the regulatory burden, which brings the total cost of government to about 50 percent of GDP.)
  • The direct burden of government spending nearly doubled from 1950 to 2010, rising from 23 percent to 40 percent of the average private employee’s output.
  • As indicated by the trend lines, real output per worker rose at the rate of $1,125 a year, but only $645 of each year’s increment remained in the private sector. In other words, government spent 43 percent of every additional dollar’s worth of real output per worker.

*   *   *

Sources:

Estimates of GDP in year 2005 dollars are from the feature “What Was the U.S GDP Then?” at MeasuringWorth.com.

Estimates of government spending (federal, State, and local) are from Statistical Abstracts of the United States, Colonial Times to 1970: Part 2. Series Y 533-566. Federal, State, and Local Government Expenditures, by Function; and the Bureau of Economic Analysis (BEA), Table 3.1. Government Current Receipts and Expenditures (lines 34, 35). The BEA tables are available here.

I estimated private-sector employment by subtracting the number of civilian government employees from the total number of employed persons in the civilian labor force. Government employment figures come from the 2012 Statistical Abstract, Historical Statistics, No. HS–46. Governmental Employment and Payrolls: 1946 to 2001, and the Bureau of Labor Statistics, Series CES9000000001: Employment, Hours, and Earnings from the Current Employment Statistics survey (National), available here. Total civilian employment is from BLS Series LNS12000000, available here.

The Commandeered Economy

Government spending — federal, State, and local — represents the confiscation of resources from the private sector. Any reasonable measure of government spending includes transfer payments (mainly Social Security, Medicare, and Medicaid), which represent income that is taken from persons who earn it and given to persons who do not earn it.

Here is an overview of the patterns of government spending from 1929 through the third quarter of 2011:


Derived from Bureau of Economic Analysis, National Income and Product Accounts, Tables 1.1.5 (lines 1, 21-25), 3.1 (line 17), and 3.2 (line 22).

Total captures all outlays by the federal government and State and local governments for all purposes, including transfer payments. Total non-defense is simply total spending less defense spending. Federal covers all outlays by the federal government, including transfer payments. State & local represents just that. Transfer payments by all governments are driven mainly by outlays for Social Security, Medicare, and Medicaid, which in 2010 accounted for 71 percent of all government spending on “social benefits.” Next is defense, which has been driven mainly by war and the prospect of war. Finally, there is federal non-defense, which is exclusive of transfer payments. This spending enables the federal bureaucracy to perform its non-defense, micromanagement functions: from controlling interest rates and the money supply to regulating the processes and products of America’s businesses to enforcing various forms of discrimination to rewarding well-connected interest groups, and so on into the dark night of fascism.

The rise of government spending began with the onset of the Depression, which saw the federal government supplant State and local governments as the main source of outlays. World War II interrupted but did not break the rising trend in non-defense spending, which has been driven by increases in transfer payments — especially since the inception of Medicare and Medicaid in 1965.

In 1929, on the eve of the Great Depression, government spending of all kinds amounted to 10 percent of GDP, and less than 1 percent of GDP was absorbed by transfer payments. In 1947, following demobilization from World War II, government spending of all kinds was 20 percent of GDP, including 5 percent for transfer payments. Now, total spending consumes about 36 percent of GDP, and transfer payments about 16 percent. All in all, post-World War II spending reflects the dominance of government in the everyday lives of Americans. About 31 percent of GDP goes to non-defense spending by the federal government and State and local governments.

Defense spending — a favored target of “liberals” and pseudo-libertarians — is not where the money is. The stability of total government spending as a percentage of GDP from the end of the Vietnam War until 9/11 was bought by short-changing defense, except during the 1980s. Despite 9/11 and the shallow display of unity that followed it, too many Americans have forgotten the main  lessons of World War II and the Cold War: Victory and deterrence do not come cheaply. And yet, since 1950, when defense spending reached its post-war nadir, it has lagged far behind the growth of government spending and transfer payments (which, illogically, have soared despite significant real growth in GDP):


Derived from sources cited above, by applying the implicit GDP deflator used to compute GDP in chained 2005 dollars (here).

In addition to the burden of non-defense spending,* there is the large and growing burden of regulatory compliance: about $1.1 trillion in 2004, or 10 percent of GDP. In other words, government now absorbs or controls almost one-half of the nation’s economic output.

Additionally, however, there is the hidden cost of output forgone because taxes and regulations have discouraged those behaviors that cause economic growth (e.g., hard work, capital formation, innovation, and entrepreneurship). I have estimated that were it not for those disincentives GDP would have grown to more than three times its present level.

The iceberg, once again, proves to be vastly larger than its visible tip. In Bastiat‘s words,

a law produces not only one effect, but a series of effects. Of these effects, the first alone is immediate; it appears simultaneously with its cause; it is seen. The other effects emerge only subsequently; they are not seen; we are fortunate if we foresee them.

The unseen effects — the theft of Americans’ liberty and prosperity — had been foreseen by some (e.g., Tocqueville and Hayek), but ignorance and power-lust prevailed over their prescience.

America’s economy has not been commandeered by the military-industrial complex; it has been commandeered by a far more insidious complex of economically illiterate voters, interest groups, social-engineering “intellectuals,” and power-lusting politicians.

__________

* Defense is a valuable and legitimate “social service,” as I discuss in this post and the posts listed at the end of it. Justice also is a valuable and legitimate “social service,” but spending on police, courts, etc., accounts for only a small fraction of non-defense spending in the U.S.

*   *   *

Related posts, on the subject of defense spending:
Not Enough Boots
Defense as the Ultimate Social Service
I Have an Idea
The Price of Liberty
How to View Defense Spending
The Best Defense . . .
Not Enough Boots: The Why of It
Delusions of Preparedness
A Grand Strategy for the United States
The Folly of Pacifism
Why We Should (and Should Not) Fight
Rating America’s Wars
Transnationalism and National Defense
The Folly of Pacifism, Again
September 20, 2001: Hillary Clinton Signals the End of “Unity”

On other subjects, see the list at the bottom of “Economic Growth Since World War II.”

Who Won the “Debt Debate”?

The first match in the current showdown over government spending goes to the GOP. Not that all Republicans favor the deal that has now been approved by the House and Senate, but it’s clear that Republicans are generally happier than Democrats about the deal.

The votes of House Republicans split 174-66 (for-against), while House Democrats voted 95-95. Senate Republicans voted 28-19; Senate Democrats 46-7 (counting Lieberman and Sanders as Democrats). Senate Republicans who voted against the deal had the comfort of knowing that (a) it had been approved by the House and (b) it was widely expected to be approved by the Senate.

On the whole, Republicans in Congress gave the deal far more support than Democrats:

  • Republican votes in favor — 72 percent of House Republicans, 60 percent of Senate Republicans, and 69 percent of Republicans in the two chambers.
  • Democrat votes in favor — 50 percent of House Democrats; 87 percent of Senate Democrats, and 58 percent of Democrats in the two chambers.

The overall results, I think, are a good gauge of the attitudes in the parties. Republicans have good reason to be happier than Democrats. Obama had to pay a price for getting the debt ceiling raised, and that price (at least for now) consists entirely of spending cuts (inasmuch as reductions in planned spending increases can be called cuts).

Chalk up a victory for Republicans, especially the Tea Party kind. Yes, Tea Partiers would have preferred real spending cuts, but without the pressure they brought to bear on Republican leaders, the outcome would have been far worse — perhaps even Obama’s preferred “clean” increase in the debt ceiling, without any strings attached.

Another thing Tea Partiers should be proud of is that “liberal” Democrats are enraged by the debt deal. (Jonah Goldberg’s take is here.) Their rage is the clearest indication of a Tea-Party-inspired Republican victory.

There are several matches yet to come in this running “debate” about the size of government and its role in the lives of Americans. The most important match will conclude on November 6, 2012, with the election of a president, 435 U.S. representatives, and one-third of U.S. senators. The replacement of Obama by a Republican, coupled with the GOP’s retention of the House and capture of the Senate, would put an end to the “gridlock” in Washington and put the U.S.

“Tax Expenditures” Are Not Expenditures

Greg Mankiw makes a provocative point:

The blue line is total discretionary outlays of the federal government, and the brown line is the sum of tax expenditures.  Both are in constant dollars.  Note that these two categories of spending are about equal in magnitude.  It is just as important to focus on stealth spending implemented through the tax code as on explicit spending.

Source.

Addendum: David Leonhardt has a related article in the Times today.

What are “tax expenditures”? According to Mankiw’s source they are

a measure of the government revenue losses resulting from provisions in the tax code that allow people or businesses to reduce their tax burden by taking certain deductions, exemptions, exclusions, preferential rates, deferrals or credits. By reducing the revenue that would otherwise have been collected by the government, tax expenditures are similar to government spending.

“Tax expenditures” are not “similar to government spending,” nor are they a form of government spending, as “liberals” would have it.

Taxes are governmental claims on economic output. If tax revenues from all sources amount to 20 percent of GDP, given the kinds of “loopholes” listed above, the effective tax rate is 20 percent of GDP. If loopholes are closed and tax revenues rise, government isn’t spending less money, it’s collecting more taxes. If loopholes are closed and, at the same time, nominal tax rates are reduced so that revenues remain constant, government isn’t spending less money, it’s simply redistributing the tax burden.

“Tax expenditures” could be expenditures only if:

  • All output is owned by government.
  • Government “spends” (distributes) output through the provisions of the tax code.
  • Therefore, if government “spends” more on person A (by creating a loophole that favors A) and less on person B (because the loophole doesn’t apply to him), A is the beneficiary of a “tax expenditure.”

Such is left’s the upside-down, Alice-in-Wonderland worldview: Everything is owned by government, and citizens are mere supplicants.

I am surprised by Mankiw’s apparent endorsement of this view.

Questioning the National Debt

There is a laughable proposition — advanced by Treasury secretary Timothy Geithner, among others — that Congress may not limit the national* debt. This proposition is based on a skewed reading of Section 4 of Amendment XIV to the Constitution. That amendment was approved by Congress in 1866 and ratified in 1868.

Here is Section 4, in full:

The validity of the public debt of the United States, authorized by law, including debts incurred for payment of pensions and bounties for services in suppressing insurrection or rebellion, shall not be questioned. But neither the United States nor any State shall assume or pay any debt or obligation incurred in aid of insurrection or rebellion against the United States, or any claim for the loss or emancipation of any slave; but all such debts, obligations and claims shall be held illegal and void.

The first sentence — the “authority” for Geithner’s proposition — simply means that the government of the United States cannot repudiate indebtedness it has already incurred. The obvious purpose of the first sentence was to prevent future Congresses — which might be controlled by Democrats — from reneging on obligations incurred by the winning (mainly Republican**) side in the Civil War.

Putting a legal limit on the issuance of debt is not the same thing as repudiating debt already incurred. A limit on the amount of debt that the government may issue is the equivalent of stop sign; it means that the government must take steps to prevent the net accumulation of additional debt. It is up to Congress to determine the precise steps — some combination of tax increases and spending reductions — or to “repudiate” the debt ceiling by raising or eliminating it.

A responsible Congress would take steps to ensure against the growth of the debt by reducing commitments to the growth of  “entitlement” programs: Social Security, Medicare, and Medicaid. Those reductions are necessary — for the sake of America’s future — whether or not there is a debt ceiling. One could even argue that the existence of a debt ceiling — one that is always somewhat higher than the current level of debt — has encouraged Congress to make irresponsible spending commitments.

__________
* The so-called national debt is, in fact, the indebtedness of the government of the United States. It arises from the actions of that government, not from the private actions of individuals. It is “national” only in the sense that the taxpayers of the nation are ultimately responsible for repayment of the debt and interest thereon.

** The Civil War was partisan as well as sectional. The 36th Congress, which was in session before the outbreak of the war, was divided as follows: 116 Republicans to 83 Democrats in the House; 26 Republicans to 38 Democrats in the Senate. Because of the war, and losses of seats by seceding States, the Republican Party held a firm grip on Congress in 1866: 136 Republicans to 38 Democrats in the House; 39 Republicans to 11 Democrats in the Senate.

Related reading:
Debt-Limit Silliness, at NRO (follow the links)
We Cannot Pretend the Debt Ceiling Is Unconstitutional, at The NYT (straight talk from a leftist, of all things)

Related posts:
The “Forthcoming Financial Collapse”
We’re from the Government and We’re Here to Help You
Estimating the Rahn Curve: Or, How Government Inhibits Economic Growth
The Deficit Commission’s Deficit of Understanding
The Bowles-Simpson Report
The Bowles-Simpson Band-Aid
America’s Financial Crisis Is Now

The Real Burden of Government

Drawing on estimates of GDP and its components, it is easy to quantify the share of economic output that is absorbed by government spending. (See, for example, “The Commandeered Economy.”) With a bit of interpretive license, it is even possible to assess the cumulative effects of government spending and regulation on economic output. (See, for example,  “The Price of Government.”)

But the real economy does not consist of a homogeneous output (GDP). The real burden of government therefore depends on the specific resources that government extracts from the private sector in the execution of particular government programs, and on the particular products and services that are affected by government regulations.

Each new or expanded government program raises the demand for and price of certain kinds of goods and services, and channels rewards (claims on goods and services) in the direction of the businesses and persons involved in providing goods and services to government; for example:

  • Social Security rewards individuals for not working. The service, in this case, is the “good feeling” that comes to politicians, etc., for having done something “compassionate.”  The effect is to raise the prices of the goods and services that prematurely retired individuals would otherwise produce, therefore reducing the well-being of the working public.
  • Medicare — another of many feel-good programs — rewards retirees by subsidizing their medical care and prescription drugs. The upshot of this feel-good program is to reduce the well-being of the working public, which must pay more for its medical services and prescription drugs (directly, through higher insurance premiums, or because of lower wages to offset the cost of employer-provided health insurance).
  • R&D conducted in government laboratories and under government grants absorbs the services of scientists and engineers, thus raising the compensation of many scientists and engineers who couldn’t do as well in the private sector (the reward) and reducing the numbers of scientists and engineers engaged in private-sector R&D (the cost). Remember the private-sector inventors, innovators, and entrepreneurs who brought you the telephone, automobiles, radio, television, any number of “wonder drugs,” computers, online shopping, etc., etc., etc.?
  • A goodly fraction of the teachers and professors at tax-funded schools and universities are rewarded with incomes that they could not earn if they worked in the private sector. (Tax-funded education also provides feel-good rewards to the usual suspects, who worship at the altar of statist inculcation.) Given that the “educators” and administrations of tax-funded educational institutions are essentially unaccountable to their “customers,” it should go without saying that tax-funded education delivers far less than the alternative: combination of private schools (including trade schools), apprenticeships, and penal institutions. Moreover, tax-funded education deprives private-sector companies of the services of (some) teachers and professors who have the skills and ability to help those companies to offer better products and services to consumers.

That’s as far as I care to take that list. You can add to it easily, just by selecting any federal, State, or local government program at random.

All of those programs, onerous as they are, have nothing on the insidious regulatory regime that has engulfed us in the past century. Regulation often are the means by which “bootleggers and Baptists” conspire to protect their interests, on the one hand (“bootleggers”), while slaking their thirst for do-goodism, on the other hand (“Baptists”). The classic case, of course, is Prohibition, which enriched bootleggers while making Baptists (and other temperance-types) feel good about saving our souls. You know how well that worked.

Obamacare is a leading example of “bootleggers and Baptists” at work. Insurance companies and the American Medical Association, anxious to protect themselves, lent their support to a program that promises to increase the demand for prescription drugs and doctors’ services. It’s a pact with the devil, of course, because (unless, by some miracle, it is repealed or declared unconstitutional) insurance companies and doctors will find that they are nothing more than government employees, in deed if not in name. And guess who will end up paying the bill? The working public, of course.

Obamacare is not a purely regulatory regime, however, because it revolves around a feel-good giveaway program. For examples of purely regulatory regimes, I turn to the myriad mundane regulations that are imposed upon us for “our own good” and at our own expense, from make-work schemes for electricians and plumbers building codes to death-inducing delays in drug approval the Pure Food and Drug Act.

More notorious (though perhaps not more damaging to the economy) are the federal government’s misadventures in “managing” the economy. A good place to begin is with the Federal Reserve’s actions from the late 1920s to the early 1930s, which helped to bring on the stock-market bubble that led to the stock-market crash that led to a recession that (with the Fed’s help) turned into the Great Depression. A good place to end is with the recent financial crisis and deep recession — a creature of Congress, the Fed, other federal suspects too numerous to mention, plus Freddie Mac and Fannie Mae — their pseudo-private-bur-really-government co-conspirators.

Have you had enough? I certainly have.

The growth of government and its incursions into our personal and business lives during the past century has done far more than rob us of wealth and income. It has ruined our character and our society, and deprived us of liberty. What has happened to self-reliance, social networks, private charity, and civil society in general? What has happened to plain old liberty, which is a value unto itself? That they are not gone with the wind is due only to the tenacity with which (some of us) hold onto them.

Government grows in power and reach because every government program and regulation — even the most benighted of them — creates a vested interest on the part of its political sponsors (in and out of government), bureaucratic managers, and dependent constituencies. New suckers are born every minute who believe that they can join the gravy train without paying the piper (to mangle a few metaphors). And when the problems created by government become too obvious to ignore, the conditioned response on the part of politicians, bureaucrats, their dependent constituencies, and most of the public is to find governmental solutions to those problems. It is the ultimate vicious circle.

Government is the problem. And it will be the problem for as long as it does more than merely protect its citizens from domestic and foreign predators, so that they can enjoy liberty and its fruits.

*     *     *

Related posts: Too numerous to mention. Begin with this list of posts at Liberty Corner, then start at the beginning of Politics & Prosperity, work your way to the present, and stay tuned.