INTRODUCTION
The activity of managing ranges from the supervision of one other person in the performance of a menial task to the supervision of the executive branch of the government of the United States. (The latter is a fair description of a president’s constitutional responsibility.) And there are many criteria for judging managers, not all of which are unambiguous or conducive to precise quantification. It may be easy, for example, to determine whether a ditch was dug on time and within budget. But what if the manager’s methods alienated workers, causing some of them to quit when the job was done and requiring the company to recruit and train new workers at some expense?
Or consider the presidency. What determines whether an incumbent is doing a good job? Polls? They are mere opinions, mostly based on impressions and political preferences, not hard facts. The passage by Congress of legislation proposed by the president? By that measure, Obama earns points for the passage of the Affordable Care Act, which if not repealed will make health care less affordable and less available.
Given the impossibility of arriving at a general answer to the tittle question, I will turn — as is my wont — to the game of baseball. You might think that the plethora of baseball statistics would yield an unambiguous answer with respect to major-league managers. As you’ll see, that’s not so.
WHAT BASEBALL STATISTICS REVEAL (OR DON’T)
Data Source
According to this page at Baseball-Reference.com, 680 different men have managed teams in the history of major-league baseball, which is considered to have begun in 1871 with the founding of the National Association. Instead of reaching that far back into the past, when the game was primitive by comparison with today’s game, I focus on men whose managing careers began in 1920 or later. It was 1920 that marked the beginning of the truly modern era of baseball, with its emphasis on power hitting. (This modern era actually consists of six sub-eras. See this and this.) In this modern era, which now spans 1920 through 2013, 399 different men have managed major-league teams. That is a sizable sample from which I had hoped to draw firm judgments about whether baseball managers, or some of them, make a difference.
Won-Lost Record
The “difference” in question is a manager’s effect — or lack thereof — on the success of his team, as measured by its won-lost (W-L) record. For the benefit of non-fans, W-L record, usually denoted W-L%, is determined by the following simple equation: W/(W + L), that is, games won divided by games won plus games lost. (The divisor isn’t number of games played because sometimes, though rarely, a baseball game is played to a tie.) Thus a team that wins 81 of its 162 games in a season has a W-L record of .500 for that season. (In baseball statistics, it is customary to omit the “0” before the decimal point, contrary to mathematical convention.)
Quantifying Effectiveness
I’m about to throw some numbers at you. But I must say more about the samples that I used in my analysis. The aggregate-level analysis described in the next section draws on the records of a subset of the 399 men whose managerial careers are encompassed in the 1920-2013 period. The subset consists of the 281 men who managed at least 162 games, which (perhaps not coincidentally) has been the number of games in a regulation season since the early 1960s. I truncated the sample where I did because the W-L records of mangers with 162 or more games are statistically better (significance level of 0.05) than the W-L records of managers with fewer than 162 games. In other words, a manager who makes it through a full season is likely to have passed a basic test of management ability: not losing “too many” games. (I address this subjective assessment later in the post.)
Following the aggregate-level analysis, I turn to an individual-level analysis of the records of those managers who led a team for at least five consecutive seasons. (I allowed into the sample some managers whose fifth full season consisted of a partial season in year 1 and a partial season in year 6, as long as the number of games in the two partial seasons added to the number of games in a full season, or nearly so. I also included a few managers whose service with a particular team was broken by three years or less.) Some managers led more than one team for at least five consecutive seasons, and each such occurrence is counted separately. For reasons that will become evident, the five seasons had to begin no earlier than 1923 and end no later than 2010. The sample size for this analysis is 63 management tours accomplished by 47 different managers.
Results and Inferences: Aggregate Level
“Just the facts” about the sub-sample of 281 managers:
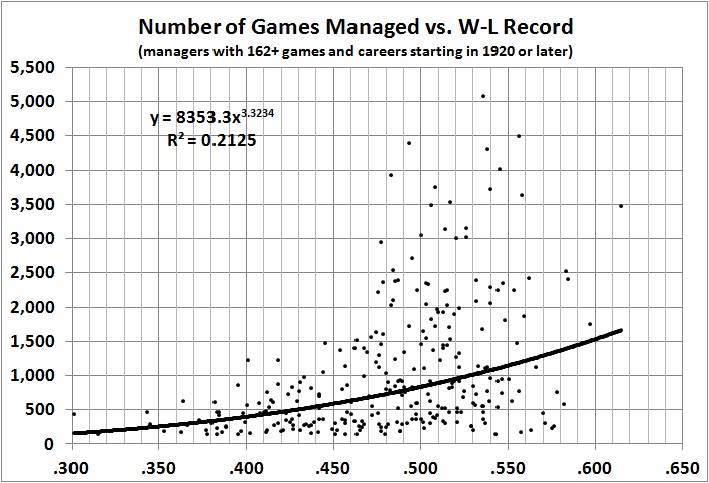
The exponential equation, though statistically significant, tells us that W-L record explains only about 21 percent of the variation in number of games managed, which spans 162 to 5,097.
Looking closer, I found that the 28 managers in the top decile of games managed (2,368 to 5,097) have a combined W-L record of .526. But their individual W-L records range from .477 to .615, and eight of the managers compiled a career W-L record below .500. Perhaps the losers did the best they could with the teams they had. Perhaps, but it’s also quite possible that the winners were blessed with teams that made them look good. In any event, the length of a manager’s career may have little to do with his effectiveness as a manager.
Which brings me to the next topic.
Results and Inferences: Individual Level
This view is more complicated. As mentioned above, I focused on those 47 managers who on 63 separate occasions led their respective teams for at least five consecutive seasons (with minor variations). To get at each manager’s success (or failure) during each management tour, I compared his W-L record during a tour with the W-L record of the same team in the preceding and following three seasons.
My aim in choosing five years for the minimum span of a manager’s tenure with a team was to avoid judging a manager’s performance on the basis of an atypical year or two. My aim in looking three years back and three years ahead was to establish a baseline against which to compare the manager’s performance. I could have chosen on time spans, of course, but a plausible story ensues from the choices that I made.
First, here is a graphical view of the relationship between each of the 63 managerial stints and the respective before-and-after records of the teams involved:
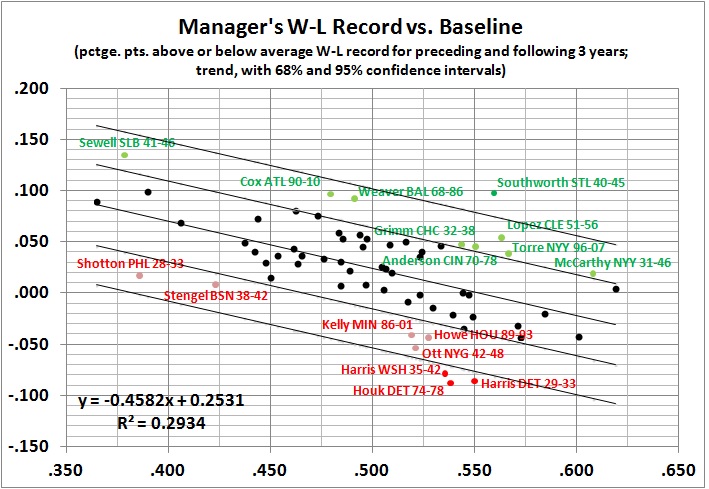
A clue to deciphering the graph: Look at the data point toward the upper-left corner labeled “Sewell SLB 41-46.” The label gives the manager’s last name (Sewell for Luke Sewell, in this case), the team he managed (SLB = St. Louis Browns), and the years of his tenure (1941-46). (In the table below, all names, teams, and dates are spelled out, for all 63 observations.) During Sewell’s tenure, the Browns’ W-L record was .134 points above the average of .378 attained by the Browns in 1938-40 and 1947-49. That’s an impressive performance, and it stands well above the 68-percent confidence interval. (Confidence intervals represent the range within which certain percentages of observations are expected to fall.)
The linear fit (equation in lower-left corner) indicates a statistically significant negative relationship between the change in a team’s fortunes during a manager’s tenure and the team’s baseline performance. The negative relationship means that there is a strong tendency to “regress toward the mean,” that is toward a record that is consistent with the quality of a team’s players. In other words, the negative relationship indicates that a team’s outstanding or abysmal record my owe nothing (or very little) to a manager’s efforts.
In fact, relatively few managers succeeded in leading their teams significantly far (up or down) from baseline performance. Those managers are indicated by green (good) and red (bad) in the preceding graph.
The following table gives a rank-ordering of all 47 managers in their 63 management stints. The color-coding indicates the standing of a particular performance with respect to the trend (green = above trend, red = below trend). The shading indicates the standing of a particular performance with respect to the confidence intervals: darkest shading = above and below the 95-percent confidence interval; medium shading = between the 68-percent and 95-percent confidence intervals; lightest shading = between the 68-percent confidence intervals.
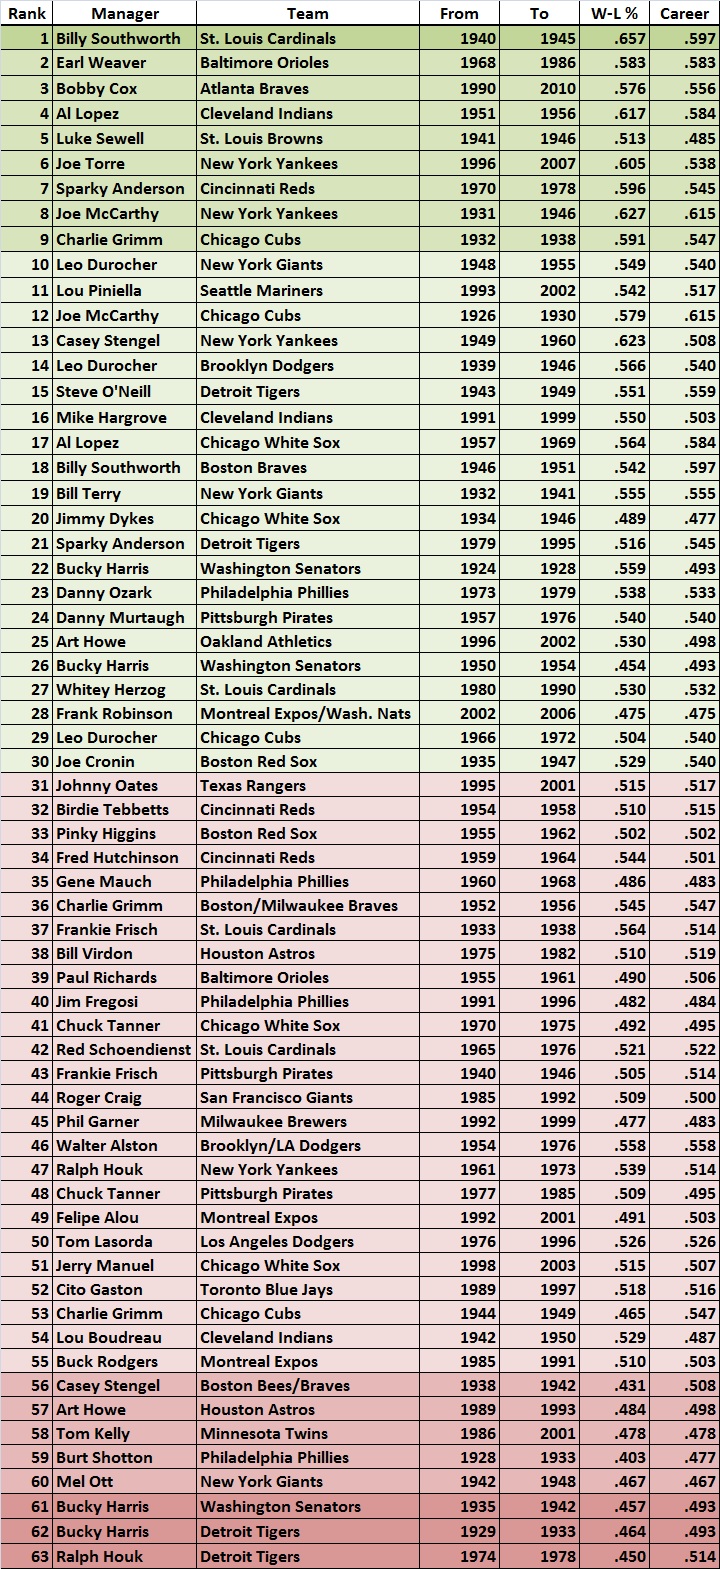
Of the 63 performances, 4 of them (6.3 percent) lie outside the 95-percent confidence interval; 13 of them (20.6 percent) are between the 68-percent and 95-percent confidence intervals; the other 46 (73.0) percent are in the middle, and statistically indistinguishable.
Billy Southworth’s tour as manager of the St. Louis Cardinals in 1940-45 (#1) stands alone above the 95-percent confidence interval. Two of Bucky Harris’s four stints rank near the bottom (#61 and #62) just above Ralph Houk’s truly abysmal performance as manager of the Detroit Tigers in 1974-78 (#63).
Southworth’s tenure with the Cardinals is of a piece with his career W-L record (.597), and with his above-average performance as manager of the Boston Braves in 1946-51 (# 18). Harris had a mixed career, as indicated by his overall W-L record of .493 and two above-average tours as manager (#22 and #26). Houk’s abysmal record with the Tigers was foretold by his below-average tour as manager of the Yankees, a broken tenure that spanned 1961-73 (#47).
Speaking of the Yankees, will the real Casey Stengel please stand up? Is he the “genius” with an above-average record as Yankees manager in 1949-60, (#13) or the “bum” with a dismal record as skipper of the Boston Bees/Braves in 1938-42 (#56)? (Stengel’s ludicrous three-and-a-half-year tour as manager of the hapless New York Mets of 1962-65 isn’t on the list because of its brevity. It should be noted, however, that the Mets improved gradually after Stengel’s departure, and won the World Series in 1969.)
Stengel is one of seven managers with a single-season performance below the 68-percent confidence level. Four of the seven — Harris, Houk, Stengel, and Tom Kelly (late of the Minnesota Twins) — are among the top decile on the games-managed list. The top decile also includes seven managers who turned in performances that rank above the 68-percent confidence interval: Earl Weaver, Bobby Cox, Al Lopez, Joe Torre, Sparky Anderson, Joe McCarthy, and Charlie Grimm (#s 2-4 and 6-9).
I could go on and on about games managed vs. performance, but it boils down to this: If there were a strong correlation between the rank-order of managers’ performances in the preceding table and the number of games they managed in their careers, it would approach -1.00. (Minus because the the best performance is ranked #1 and the worst is ranked #68.) But the correlation between between rank and number of games managed in a career is only -0.196, a “very weak” correlation in the parlance of statistics.
In summary, when it comes to specific management stints, Southworth’s performance in 1940-45 was clearly superlative; the performances of Harris (1929-33, 1935-42) and Houk (1974-78) were clearly awful. In between those great and ghastly performance lie a baker’s dozen that probably merit cheers or Bronx cheers. A super-majority of the performances (the 73 percent in the middle) probably have little to do with management skills and a lot to do with other factors, to which I will come.
The Bottom Line
It’s safe to say that the number of games managed is, at best, a poor reflection of managerial ability. What this means is that (a) few managers exert a marked influence on the performance of their teams and (b) managers, for the most part, are dismissed or kept around for reasons other than their actual influence on performance. Both points are supported by the two preceding sections.
More tellingly, both points are consistent with the time-tested observation that “they” couldn’t fire the team, so “they” fired the manager.
CLOSING THOUGHTS
The numbers confirm what I saw in 30 years of being managed and 22 (overlapping) years of managing: The selection of managers is at least as random as their influence on what they manage. This is true not only in baseball but wherever there are managers, that is, throughout the world of commerce (including its entertainment sectors), the academy, and government.
The is randomness for several reasons. First, there is the difficulty of specifying managerial objectives that are measurable and consistent. A manager’s basic task might be to attain a specific result (e.g., winning more games than the previous manager, winning at least a certain number of games, turning a loss into a profit). But a manager might also be expected to bring peace and harmony to a fractious workplace. And the manager might also be charged with maintainng a”diverse” workplace and avoiding charges of discrimination? Whatever the tasks, their specification is often arbitrary and, in large organizations, impossible to relate the objective to an overarching organization goal (e.g., attaining a profit target).
Who knows if it’s possible to win more games or turn a loss into a profit, given the competition, the quality of the workforce, etc.? Is a harmonious workplace more productive than a fractious one if a fractious one is a sign of productive competitiveness? How does one square “diversity” and forbearance toward the failings of the “diverse” (to avoid discrimination charges), while also turning a profit?
Given the complexity of management, at which I’ve only hinted, and the difficulty of judging managers, even when their “output” is well-defined (e.g., W-L record), it’s unsurprising that the ranks of managers are riddled with the ineffective and the incompetent. And such traits are often tolerated and even rewarded (e.g., raise, promotion, contract extension). Why? Here are some of the reasons:
- Unwillingness to admit that it was a mistake to hire or promote a manager
- A manager’s likeability or popularity
- A manager’s connections to higher-ups
- The cost and difficulty of firing a manager (e.g., severance pay, contract termination clauses, possibility of discrimination charges)
- Inertia — Things seem to be going well enough, and no one has an idea of how well they should be going).
The good news is that relatively few managers make a big difference. The bad news is that the big difference is just as likely to be negative as it is to be positive. And for the reasons listed above, abysmal managers will not be rooted out until they have done a lot of damage.
So, yes, some managers — though relatively few — make a difference. But that difference is likely to prove disastrous. Just look at the course of the United States over the past 80 years.


