Calling oneself a libertarian because one wants to be “left alone” is as shallow as calling oneself an American while secretly hankering to live in a “socialist paradise” like Sweden. Liberty isn’t just about being “left alone”; being an American isn’t (or didn’t used to be) just about living within the geographical boundaries of the United States.
Author: Loquitur Veritatem
See https://politicsandprosperity.com/about/.
The Real Constitution: I
This is the first installment of an effort to contrast the present, judicial interpretation of the Constitution with its original meaning, section by section and clause by clause. I draw heavily on The Heritage Guide to the Constitution (hereafter Heritage Guide). All quoted passages of the Constitution (including the Bill of Rights and other amendments) are from the version published by the National Records and Archives Administration.
We the People of the United States, in Order to form a more perfect Union, establish Justice, insure domestic Tranquility, provide for the common defence, promote the general Welfare, and secure the Blessings of Liberty to ourselves and our Posterity, do ordain and establish this Constitution for the United States of America.
The Preamble has no substantive legal meaning, but it is significant because it specifies the Constitution’s purposes. The most commonly misunderstood term in the Preamble is “general Welfare,” a term which recurs in the Spending Clause of Article I, Section 8. I will deal with the Spending Clause in its turn. As for the Preamble:
The word “Welfare” is crucial: in the eighteenth century the definition of welfare included well-being., but it also and equally encompassed happiness.
The Preamble as a whole, then, declares that the Constitution is designed to secure precisely the rights proclaimed in the Declaration [of Independence]. The Constitution was therefore not the negation of the Revolution; it was the Revolution’s fulfillment.
Forrest McDonald, Heritage Guide, p. 46
LEGISLATIVE VESTING CLAUSE
All legislative Powers herein granted shall be vested in a Congress of the United States, which shall consist of a Senate and House of Representatives.
(Article I, Section 1)
Much of what Americans and American businesses are permitted to do, under the regime that controls our lives and livelihoods, is determined not by legislation but by regulation. Congress has divested much of its legislative authority to the executive branch, where regulators do the work of legislators:
In 1928, the [U.S. Supreme] Court upheld a statute delegating the the President the power to adjust tariffs to any rate, within a wide range, he found necesary to “equalize the … differences in costs of production in the United States and the principal competing country.” J.W. Hampton, Jr. & Co. v. United States. In that case the Court for the first time set out what remains the governing standard: a “legislative action is not a forbidden delegation of legislative power” if the “Congress shall lay down by legislative act an intelligible principle to which the person or body [to whom power is delegated] is directed to conform.”…
[Thus t]he Court found in Whitman v. American Trucking Associations, Inc. an intelligible principle in Congress’s directive to the Environnmental Protection Agency to promulgate air quality standards “requisite to protect the public health” with “an adequate margin of safety.” Because no standard could eliminate all significant adverse effects to health, the statute effectively delegated to an unelected and unaccountable agency the decision how far our society should go and how many billions of dollars should be spent to reduce the adverse health effects of industrial pollution, a decision that seems quintessentially legislative, but undoubtedly one for which legislators would prefer to avoid responsibility.
Douglas Ginsburg, Heritage Guide, pp. 47-8
For many other posts about the erosion of the Constitution’s original meaning, see the category “Constitution – Courts – Law – Justice“
Lochner, Where Are You When We Need You?
Supreme Court Justice Anthony M. Kennedy refused on Thursday afternoon to forbid the city and county of San Francisco to continue enforcing a local ordinance that sets minimum levels of spending by employers for their workers’ health care.
Back when the U.S. Supreme Court upheld the Constitution, the City of San Francisco would have thought long and hard before interfering in employment relationships. (See Lochner v. New York.) But that was before the New Deal Court began to find constitutionality in government-imposed conditions of employment, from mandatory unionization to Social Security to affirmative action.
Well, if the Circuit Court and the U.S. Supreme Court uphold San Francisco in this case, that “fair” city will be waving bye-bye to a lot of companies and a lot of jobs.
Related posts:
“The Cost of Affirmative Action” (01 Jun 2004)
“A Very Politically Incorrect Labor Day Post” (06 Sep 2004)
“Freedom of Contract and the Rise of Judicial Tyranny” (07 Sep 2004)
“Social Security Is Unconstitutional” (31 Oct 2004)
“Race, Intelligence, and Affirmative Action” (05 Dec 2004)
“An Agenda for the Supreme Court” (29 Jun 2005)
“Substantive Due Process, Liberty of Contract, and States’ ‘Police Power’” (28 Nov 2005)
“Positive Rights and Cosmic Justice: Part IV” (06 Aug 2007)
I Voted for Barack
No, I haven’t gone off the deep end. It’s just that I voted early in the Texas primary, and decided to vote Democrat so that I could vote against Hillary Clinton. (Believe me, it was painful to ask for a Democrat ballot.)
I had mixed feelings about voting for Obama, because (as of now) he seems more electable than Clinton. But I just couldn’t resist the urge to stick it to Hillary, in the hope that the outcome of the Texas primary sends her (and her husband) to the hell of national political impotence.
I have come to believe that Obama’s aura will dissipate as voters come to understand that his mantra of “change” is an empty political slogan. Change what? How? At what cost? The man doesn’t answer those questions. He just wants to get into the White House, decimate our defenses, enlarge government, and raise taxes. (He doesn’t say that, but that’s what’s on his agenda.)
But Obama will be found out — before election day. The Clintons will expose his emptiness before they’re through; John McCain will finish the job.
In any event, the nomination of Obama will ensure that there are as many disgruntled Clintonistas on the Democrat side as there are disgruntled conservatives on the GOP side. And if Clinton manages to steal the Democrat nomination, there will be as many deflated Obama-maniacs on the Democrat side as there are disgruntled conservatives on the GOP side.
P.S. The New York Times‘s anti-McCain smear job may backfire. If there’s anything a hard-core conservative hates more than John McCain, it’s the Times.
P.P.S. As I was saying.
Election 2008: Sixth Forecast
My eighth forecast is here.
The Presidency – Method 1
Intrade posts State-by-State odds odds on the outcome of the presidential election in November. I assign all of a State’s electoral votes to the party whose nominee that is expected to win that State. Where the odds are 50-50, I split the State’s electoral votes between the two parties.
As of today, the odds point to this result:
Democrat — 293 electoral votes (EVs)
Republican — 245 EVs
That’s a pickup of 35 EVs for the GOP since my fifth forecast, which I updated only three days ago.
The Presidency – Method 2
I have devised a “secret formula” for estimating the share of electoral votes cast for the winner of the presidential election. (The formula’s historical accuracy is described in my second forecast.) The formula currently yields these estimates of the outcome of this year’s presidential election:
Democrat nominee — 278 to 324 EVs
Republican nominee — 214 to 260 EVs
That’s a loss for the GOP nominee of 7 to 20 EVs since my fifth forecast. The “good news” is that the ranges estimated by method 2 span the values obtained by method 1. If that remains the case, I will be more confident of my estimates as the election approaches.
U.S. Senate
No change since my fifth forecast. Democrats will pick up five Senate seats, one each in Colorado, New Hampshire, New Mexico, and Virginia, plus Mississippi or Minnesota. The gain will change the balance from 51 Democrats (including Lieberman and Sanders, both nominally independent) and 49 Republicans to 56 Democrats and 44 Republicans.
Did Roger Do It?
In “Testing for Steroids” I examine the records of the eleven most prolific home-run hitters in the history of major-league baseball: Mark McGwire, Barry Bonds, and nine other. The graphs I present in “Testing…” show that the late-career accomplishments of McGwire and Bonds are far out of line with (a) their earlier accomplishments and (b) the career patterns of the other nine sluggers. In sum, there is a strong statistical case for the proposition that McGwire and Bonds used and benefited from performance-enhancing drugs.
Is there similar evidence (pro or con) regarding Roger Clemens? There’s an analysis released by Clemens’s agents (the “Clemens Report“), which is (rightly) found wanting by Justin Wolfers (writing at the Freakonomics blog, here and here). I am not, however, smitten with Wolfers’s rather vague statistical presentation. Steven Levitt (also writing at the Freakonomics blog) points to a better one, by Nate Silver.
I had been working on my own analysis before I came upon Silver’s. Though our approaches are somewhat different, Silver and I reach the same conclusion: “where [Clemens’s] statistical record is concerned, there is no smoking gun.” Or, as Levitt says,
While statistical evidence can sometimes provide convincing evidence that something really out of the ordinary has happened (like the sumo wrestling cheating that was documented in Freakonomics), it is far from clear how to interpret the findings when things look normal.
The statistical case against McGwire and Bonds is compelling. There is no statistical case against Clemens. He may have used steroids and HGH, as alleged by Brian McNamee, but the numbers don’t prove it.
For my analysis, I draw on Baseball-Reference.com to compare Clemens’s record with the records of pitchers who are his peers:
- First, I compare Clemens with other highly successful and durable pitchers on the basis of walks-plus-innings pitched (WHIP), by age. I define highly successful pitchers as those who have won at least 250 games in the “live-ball era.” Durable pitchers, for the purpose of this comparison, also pitched at least 100 innings in at least one season at the age of 40 (or older).
- Second, I compare Clemens with other starting pitchers who averaged more than 8 strikeouts per 9 innings pitched (SO/9IP) during their careers, and who also pitched at least 100 innings in each of 10 or more seasons.
For the pitchers who meet those criteria, I omit intra-career seasons of less than 100 innings. Further, I adjust each season’s statistics by
- normalizing for differences between leagues and across time (which are substantial*), and
- indexing each pitcher’s statistics to the pitcher’s best season, in order to compare relative changes in the performance of pitcher A during his career with relative changes in the performance of pitchers B, C, etc., during their careers.
The 18 highly successful, durable pitchers included in my analysis are (in order of first 100-inning season): Ted Lyons (1924, 260 career wins), Lefty Grove (1925, 300), Early Wynn (1942, 300), Warren Spahn (1946, 363), Jim Kaat (1961, 283), Tommy John (1965, 288), Ferguson Jenkins (1966, 284), Gaylord Perry (1964, 314), Don Sutton (1966, 324), Steve Carlton (1967, 329), Phil Niekro (1967, 318), Tom Seaver (1967, 311), Nolan Ryan (1968, 324), Bert Blyleven (1970, 287), Roger Clemens (1984, 354), Greg Maddux (1987, 347), Tom Glavine (1988, 303), and Randy Johnson (1989, 284).
To keep the following graph simple, I highlight only the careers of Ryan, Johnson, and Clemens (indicating the seasons in which he is alleged to have received injections of steroids and/or HGH). (For a better view of the graphs in this post, right-click on them and select “open in new tab.”) The gray lines represent the careers of the other 15 pitchers. The light blue lines indicate the normal range of those 15 pitchers’ career trajectories. (The normal range is the range that contains about two-thirds of each year’s observations; about one-third of them are on either side of each year’s mean.) The shape of the light blue lines tells the expected tale: improvement, a peak (around age 30-32), and deterioration.
 The career patterns of Clemens, Johnson, and Ryan are atypical. But they are atypical in different ways. Clemens’s record is up and down. His improvement in the late years is striking, but no more striking than that of Ryan, who simply follows a different trajectory (steady improvement) to arrive at about the same place at about the same age. Johnson’s trajectory is similar to Ryan’s, but with more ups and downs. Like Ryan, Johnson peaks very late. Johnson’s sudden deterioration following his peak can be attributed to his well-known back problems; Ryan’s, to sheer age.
In sum, Clemens had a more consistent career than those of Johnson and Ryan. But Clemens’s late-career success cannot be deemed suspicious when viewed against the similar successes of Johnson and Ryan.
Turning to the the leading “power pitchers,” we have Sandy Koufax (first 100-inning year, 1957; 9.28 SO/9IP for his career), Sam McDowell (1964, 8.86), Nolan Ryan (1968, 9.55), Roger Clemens (1984, 8.55), David Cone (1988, 8.28), Randy Johnson (1989, 10.78), Curt Schilling (1992, 8.60), Pedro Martinez (1993, 10.20), and Hideo Nomo (1995, 8.74):
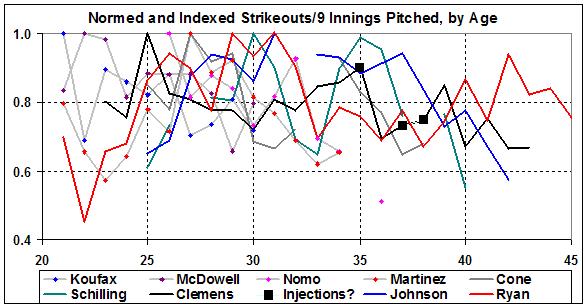 Only four of the nine pitched 100 innings in a season at age 40 (or older): Schilling, Clemens, Johnson, and Ryan. Among that select group, Clemens’s record is unexceptional. His late surge (local peaks at ages 35 and 39) is no more extreme than the late surges of Schilling (at 35), Johnson (at 37), and Ryan (at 40 and 42).
There is no statistical case against Roger Clemens. Did he “do it”? Maybe. But the proof of “it” requires hard, physical evidence (or an admission by Clemens), not statistical analysis.
The inconclusiveness of of statistical analysis, in this case, may mean one of two things: (1) Clemens didn’t use performance-enhancing drugs. (2) If Clemens relied mainly on HGH (as opposed to steroids) in an effort to bolster his performance, the effect may have been nil. For example,
there is no proof that net protein retention is promoted in adults, except possibly of connective tissue. The overexaggeration of the effects of growth hormone in muscle building is effectively promoting its abuse and thereby encouraging athletes and elderly men to expose themselves to increased risk of disease for little benefit.
Clemens may simply be living proof of the benefits of physical fitness.
__________
* WHIP and SO/9IP vary considerably by league and across time, for many reasons: expansion, the introduction of the designated hitter to the American League (1974), the replacement of old ball parks with new (sometimes smaller) ones, and variations in such things as the strike zone, the height of the pitching mound, the size of fielders’ gloves, the resiliency of the baseball, and the frequency with which umpires put a new ball into play.
To illustrate changes in WHIP, I use a closely related number: walks-plus-hits per game. Here’s the tally, by league and season for 1920-2007 (a period that spans the careers of the durable, highly successful pitchers whose records I analyze in this post):
 And here’s the tally of SO/9IP, by league and season for 1955-2007 (a period that covers the careers of the top “power pitchers” whose records I analyze in this post):

A Genealogy of Driving
My maternal grandfather was a first-generation driver; he was well into his 20s when automobiles went into mass production. (I’m not sure when he first drove a car, but he could have driven in the last decade of the nineteenth century or first decade of the twentieth century.) That makes my mother a second-generation driver; me, a third-generation driver; and my children, fourth-generation drivers.
Coincidentally, my grandfather was a member of the first generation of his family to have been born here. (His ancestors were born in French Canada and France.) That makes my mother a second-generation American,* etc.
__________
* By the second definition here.
Are Leftists Crazy?
Dr. Lyle Rossiter, a psychiatrist, thinks so. Rossiter also says:
Like spoiled, angry children, they [Leftists] rebel against the normal responsibilities of adulthood and demand that a parental government meet their needs from cradle to grave.
My thoughts exactly, which I have expressed here, here, here, and here.
(H/T John Ray)
Election 2008: Fifth Forecast (Updated)
Here.
Minarchy vs. Anarchy
Arnold Kling writes:
Those of us who are “minarchists,” meaning that we favor government that is limited to adjudicating conflict, have no reliable mechanism for restraining government.
Lest you jump to the conclusion that anarchy is therefore preferable to minarchy, consider this: Anarchy offers no reliable mechanism for restraining renegades (i.e., thugs and warlords) who choose not to participate in markets for defense services, or to honor contracts between those who do participate in such markets.
Related posts:
“Fundamentalist Libertarians, Anarcho-Capitalists, and Self-Defense” (22 Apr 2005)
“Another Thought about Anarchy” (10 May 2005)
“Anarcho-Capitalism vs. the State” (26 May 2005)
“Rights and the State” (13 Jun 2005)
“But Wouldn’t Warlords Take Over?” (24 Jul 2005)
“Liberty or Self-Indulgence?” (10 Oct 2005)
“My View of Warlordism, Seconded” (15 Dec 2005)
“Anarchy: An Empty Concept” (20 Dec 2005)
“The Fatal Naïveté of Anarcho-Libertarianism” (28 Jan 2006)
“The Meaning of Liberty” (25 Mar 2006)
“A Critique of Extreme Libertarianism” (27 Jul 2007)
“Anarchistic Balderdash” (17 Aug 2007)
“Anarchistic Whining” (04 Jan 2008)
“Wisdom from Mises” (04 Jan 2008)
Valentine’s Day
I am old enough to remember that Valentine’s Day used to be called St. Valentine‘s Day — even in public schools.
I Don’t Get It
Publius Endures (a libertarian? blog) comes close to endorsing Barack Obama. Why? Because Obama is anti-defense (hmm… I thought defense was one of the few legitimate functions of the state), somewhat “fiscally responsible” (in that he would cut the defense budget), pro-freedom (if you think that the “War on Drugs” is as important as, say, a massive regulatory burden that harms businesses and therefore consumers), and “good” on education (in that he favors a different kind of ill-advised federal involvement than NCLB).
Needless to say, I find a lack of perspective and balance in the mish-mash offered by the proprietor of Publius Endures. For antidotes, read this and this.
The Filibuster Factor
Some commentators have suggested that an Obama or Clinton presidency wouldn’t be an utter disaster, given the ability of GOP senators to stymie statist legislation by voting “nay” on cloture motions. (A cloture motion is a motion to cut off debate, that is, to stop a procedural filibuster.)
But…there may be only 44 GOP senators in the next Congress (down from 49). In that event, it could be hard to round up 41 “nays,” given the number of RINOs and half-baked conservatives on the GOP side of the aisle (e.g., Snowe and Collins of Maine, Specter of Pennsylvania, Coleman of Minnesota, Smith of Oregon). That will be especially true on critical issues where RINOs are notably soft (e.g., health care and defense).
Election 2008: Fifth Forecast
My eighth forecast is here.
UPDATED (02/17/08)
The Presidency – Method 1
Intrade posts State-by-State odds odds on the outcome of the presidential election in November. I assign all of a State’s electoral votes to the party whose nominee that is expected to win that State. Where the odds are 50-50, I split the State’s electoral votes between the two parties.
As of today, the odds point to this result:
Democrat — 328 electoral votes (EVs)
Republican — 210 EVs
The Presidency – Method 2
I have devised a “secret formula” for estimating the share of electoral votes cast for the winner of the presidential election. (The formula’s historical accuracy is described in my second forecast.) The formula currently yields these estimates of the outcome of this year’s presidential election:
Democrat nominee — 271 to 304 EVs
Republican nominee — 234 to 267 EVs
U.S. Senate
Democrats will pick up five Senate seats, one each in Colorado, New Hampshire, New Mexico, and Virginia, plus Mississippi or Minnesota. The gain will change the balance from 51 Democrats (including Lieberman and Sanders, both nominally independent) and 49 Republicans to 56 Democrats and 44 Republicans.
Stability Isn’t Everything
Mark Perry (Carpe Diem) touts the stability of the U.S. economy:
The U.S. economy has become increasingly more stable over time…. Since 1985, real GDP growth has fluctuated in a range between 0 and 5%. Despite a slowdown, or even a recession, we are fortunate to be living in the most economically stable period in U.S. history.
Well, maybe not so fortunate. As I note here:
Had the economy continued to grow after 1907 at the 1790-1907 rate, real GDP in 2006 would have been $32 trillion, vice the actual value of $11 trillion [in year 2000 dollars].
The year 1907 marks the onset of the regulatory-welfare state (see this). The era of economic stability that we now “enjoy” has come at a very high price. It is the stability of imprisonment in a government-controlled economy. The result has been a diminishing rate of growth, accompanied by a rising rate of inflation:

Real GDP is nominal (current-dollar) GDP divided by the GDP deflator, a measure of changes in the overall level of prices for the goods and services that make up GDP. I derived five-year averages from the estimates of real GDP and the GDP deflator for 1790 through 2006, as provided by Louis D. Johnston and Samuel H. Williamson, “The Annual Real and Nominal GDP for the United States, 1790 – Present.” Economic History Services, July 27, 2007, URL : http://eh.net/hmit/gdp/. UPDATE (01/30/08): The averages for 2005 include estimates of real GDP and the GDP deflator for 2007, as issued by the Bureau of Economic Analysis on January 30, 2008. [From “Is Inflation Inevitable?” (18 Jan 2008)]
Ignore the artificially high rate of growth from the early 1930s to the end of World War II. It reflects the recovery from the government-caused-and prolonged Great Depression, followed by the war-fueled “boom.” Similarly, ignore the inflation spikes that coincide with the Civil War and World War I. The true story is told by the trend lines. Things were going quite well until the early 1900s. Then, thanks to “progressives” and their “reforms,” government got into the act, in a big way…
Those who cannot remember the past are condemned to repeat it.
George Santayana, The Life of Reason
The Heritage Guide to the Constitution
I worked my way slowly through The Heritage Guide to the Constitution after receiving my copy more than two years ago. I finished the Guide two days ago. The exercise confirmed what I already knew, namely, that the original meaning of the Constitution (including its amendments) has been twisted badly.
I am now embarked on an effort to contrast the present, judicial interpretation of the Constitution with its original meaning, section by section and clause by clause.
My Dilemma
The thought of Hillary Clinton or Barack Obama as president appalls me. Both are “liberal fascists,” but Clinton is a personally despicable one.
So, I chortle (not cackle) every time Obama beats Clinton in a primary. But as Obama racks up those primary wins he becomes the more likely nominee of the Democrat Party.
Obama (so the polls say) is more electable than Clinton. Therefore, my delight in Obama’s success against Clinton may become my dismay if that success leads to an Obama presidency.
I resolve, therefore, to hope that Clinton becomes the Democrat nominee — much as I would enjoy seeing Clinton (and Clinton) rejected by their own party.
An Embarrassment of Ignoramuses
This reminds me of the multitude of lemming-like politicians and celebrities who have joined the “crusade” against global warming. (It would be a lot cooler if they would just close their mouths.)
Will those multitudes be embarrassed a few years from now when the scientific “consensus” turns against them? Not at all. They’ll have by then joined other ill-conceived “crusades” against other imaginary ills, or ones that cannot be cured by government. Why? For the sake of having government tell the rest of us how to live our lives.
And so it goes in the never-never land of the fashionable doom-sayer.
Related posts:
“The Worriers” (13 Jun 2004)
“More about the Worrying Classes” (17 Jun 2004)
“‘Warmism’: The Myth of Anthropogenic Global Warming” (23 Aug 2007)
“Re: Climate ‘Science’” (19 Sep 2007)
“More Evidence against Anthropogenic Global Warming” (25 Sep 2007)
“Yet More Evidence against Anthropogenic Global Warming” (04 Oct 2007)
“Global Warming, Close to Home” (22 Dec 2007)
“You Know…” (02 Jan 2008)
“Global Warming, Close to Home (II)” (06 Jan 2008)
Liberal Fascism
There’s an excellent post on the subject, here. (Inspired by Jonah Goldberg and his recently published book, Liberal Fascism.) [UPDATE (02/11/08): See also this, by Thomas Sowell.]
Related posts at Liberty Corner include:
“Calling a Nazi a Nazi” (12 Mar 2006)
“Things to Come” (27 Jun 2007)
“FDR and Fascism” (30 Sep 2007)
“A Political Compass: Locating the United States” (13 Nov 2007)
“The Modern Presidency: A Tour of American History since 1900” (01 Dec 2007)
“Intellectuals and Capitalism” (15 Jan 2008)
“Political Correctness” (29 Jan 2008)
“The People’s Romance” (30 Jan 2008)
“Fascism” (30 Jan 2008)
Election 2008: Fourth Forecast
My eighth forecast is here.
The Presidency – Method 1
Intrade posts State-by-State odds odds on the outcome of the presidential election in November. I assign all of a State’s electoral votes to the party whose nominee that is expected to win that State. Where the odds are 50-50, I split the State’s electoral votes between the two parties.
As of today, the odds point to this result:
Democrat, 300 electoral votes
Republican, 238 electoral votes
The Presidency – Method 2
I have devised a “secret formula” for estimating the share of electoral votes cast for the winner of the presidential election. (The formula’s historical accuracy is described in my second forecast.) The formula currently yields these estimates of the outcome this year’s presidential election [UPDATED 02/09/08 02/11/08]:
Democrat nominee —
261 to 302 EVs228 to to 269 EVs261 to 310 EVsRepublican nominee —
236 to 277 EVs269 to 310 EVs236 to 277 EVs
* * *
Both methods afford a better outlook for the GOP than the one given in my third forecast on December 12. [Today’s update of method 2, in fact, puts the GOP nominee in the lead.] The gain, I believe, is attributable mainly to John McCain’s success in the race for the GOP nomination; that is, McCain is perceived as the Republican most likely to beat the Democrat nominee. The gain is attributable, also, to the strong (if no longer overwhelming) possibility that Hillary Clinton will be the Democrat nominee. Clinton, in spite of her strength within her party, probably would be a weaker nominee than Obama. The update of 02/11/08 reflects Obama’s strong showing over the past weekend (sweeping four Dem primaries/caucuses) and the expectation that he will do well in tomorrow’s “Potomac primary” (i.e., the primaries in MD, DC, and VA).
I believe that future forecasts will become more favorable to the GOP nominee (i.e., McCain). The current forecast doesn’t take into account the damage that the acrimonious race between Clinton and Obama will do to both. If Obama sweeps tomorrow’s races and soon thereafter becomes the “presumptive” Democrat nominee, Democrats may quickly unite behind him. Moreover, [T]he ugly reality of a[n] Clinton or Obama presidency will should offset the present disaffection for McCain among some conservatives. As conservatives “return to the fold,” McCain’s chances will rise. But Obama is looming as the man to beat in November 2008.
* * *
Congress
UPDATED 02/09/08: Democrats will pick up four Senate seats, one each in Colorado, New Hampshire, New Mexico, and Virginia. The gain will change the balance from 51 Democrats (including Lieberman and Sanders, both nominally independent) and 49 Republicans to 55 Democrats and 45 Republicans.
The House? Later.
