Random Thoughts

Why is “gunite” pronounced gun-ite, whereas “granite” is pronounced gran-it?

If, in 1950, Harry Truman had said “four score and seven years ago,” he would have been referring to 1863, the year in which Abraham Lincoln uttered that famous phrase.

In the computer industry, “email” is preferred to “e-mail.” But it seems to me that “e-mail” better represents the phrase “electronic mail.” The meaning of “e-mail” is immediately obvious to me; “email,” at first glance, looks like a typo.

If the dismal northern weather of early April and late October — which delayed the start of the 2008 baseball season in some cities and then disrupted the World Series — doesn’t convince Major League Baseball to lop two weeks from each end of the regular season, nothing will.

One of the funniest movies I’ve seen is Harold Lloyd’s Dr. Jack (1922). It starts slowly, but builds to a hilariously frantic finish. Lloyd’s Safety Last! is better known — and deservedly considered a comedy classic — but it isn’t half as funny as Dr. Jack.

Between novels, I have been slogging my way through Thomas K. McCraw’s Prophet of Innovation: Joseph Schumpeter and Creative Destruction. There’s too much armchair psychology in it, but it whets my appetite for Schumpeter’s classic Capitalism, Socialism, and Democracy, which (I hate to admit) I haven’t read. Schumpter’s famous term for capitalism, “creative destruction,” often is applied with an emphasis on “destruction”; the emphasis should be on “creative.”

I must observe, relatedly, that my grandmother’s lifetime (1880-1977) spanned the invention and adoption of far more new technology than is likely to emerge in my lifetime, even if I live as long as my grandmother did.

The Seven-Game World Series

The seven-game World Series holds the promise of high drama. That promise is fulfilled if the Series stretches to a seventh game and that game goes down to the wire. Courtesy of Baseball-Reference.com, here is what has happened in the deciding game of the Series that have been played to date:

1909 – Pittsburgh (NL) 8 – Detroit (AL) 0

1912 – Boston (AL) 3 – New York (NL) 2 (10 innings)

1925 – Pittsburgh (NL) 9 – Washington (AL) 7

1926 – St. Louis (NL) 3 – New York (AL) 2

1931 – St. Louis (NL) 4 – Philadelphia (AL) 2

1934 – St. Louis (NL) 11 – Detroit (AL) 0

1940 – Cincinnati (NL) 2 – Detroit (AL) 1

1945 – Detroit (AL) 9 – Chicago (NL) 3

1947 – New York (AL) 5 – Brooklyn (NL) 2

1955 – Brooklyn (NL) 2 – New York (AL) 0

1956 – New York (AL) 9 – Brooklyn (NL) 0

1957 – Milwaukee (NL) 5 – New York (AL) 0

1958 – New York (AL) 6 – Milwaukee (NL) 2

1960 – Pittsburgh (NL) 10 New York (AL) 9 (decided by Bill Mazeroski’s home run in the bottom of the 9th)

1965 – Los Angeles (NL) 2 – Minnesota (AL) 0

1967 – St. Louis (NL) 7 – Boston (AL) 2

1968 – Detroit (AL) 4 – St. Louis (NL) 1

1971 – Pittsburgh (NL) 2 – Baltimore (AL) 1

1972 – Oakland (AL) 3 – Cincinnati (NL) 2

1973 – Oakland (AL) 5 – New York (NL) 2

1975 – Cincinnati (AL) 4 – Boston (AL) 3

1979 – Pittsburgh (NL) 4 – Baltimore (AL) 1

1982 – St. Louis (NL) 6 – Milwaukee (AL) 3

1985 – Kansas City (AL) 11 – St. Louis (NL) 0

1986 – New York (NL) 8 – Boston (AL) 5

1987 – Minnesota (AL) 4 – St. Louis (NL) 2

1991 – Minnesota (AL) 1 – Atlanta (NL) 0 (10 innings)

1997 – Florida (NL) 3 – Cleveland (AL) 2 (11 innings)

2001 – Arizona (NL) 3 – New York (AL) 2 (decided in the bottom of the 9th)

2002 – Anaheim (AL) 4 – San Francisco (NL) 1

Summary statistics:

30 seven-game Series (29 percent of 103 series played, including 4 in a best-of-nine format, none of which lasted 9 games)

15 Series decided by 1 or 2 runs

10 of those 15 Series decided by 1 run (5 times in extra innings or the winning team’s last at-bat)

4 consecutive seven-game Series 1955-58, all involving the New York Yankees (21 percent of the Yankees’ Series — 8 of 39 — went to seven games)

Does the World Series deliver high drama? Seldom. In fact, only about 10 percent of the time. The other 90 percent of the time it’s merely an excuse to fill seats and sell advertising.

What’s in a Name?

American League teams include the St. Petersburg (“Tampa Bay”) Rays, the Minneapolis (“Minnesota”) Twins, the Anaheim (“Los Angeles”) Angels, and the Arlington (“Texas”) Rangers. Over in the National League we find the Miami (“Florida”) Marlins, the Phoenix (“Arizona”) Diamondbacks, and the Denver (“Colorado”) Rockies.

The practice of associating a baseball team with a place other than the city in which it plays its home games dates to 1961, when the original Washington Senators became the “Minnesota” Twins. It’s the baseball equivalent of naming a child after a sign of the Zodiac — very “new age,” “countercultural,” and all that. What began as an exception has become the rule: baseball’s four newest franchises (awarded in 1993 and 1998) belong to “Arizona,” “Colorado,” “Florida,” and “Tampa Bay.” (Can you imagine the “Maryland” Orioles, “Illinois” Cubs, “Ohio” Indians, “Michigan” Tigers, etc., etc., etc.?)

Preferring, as I do, real names like Matthew and Mary, I insist on the St. Petersburg Rays, Minneapolis Twins, Anaheim Angels, Arlington Rangers, Miami Marlins, Phoenix Diamondbacks, and Denver Rockies. The residents of those cities should insist likewise.

Baseball Weather

A good reason to hope that the Tampa Bay Rays beat the Boston Red Sox and win the American League championship: The first game of the World Series is scheduled for October 22. The American League team will host that game. The forecast high for Boston on October 22 is 56 degrees; it will probably be in the mid-40s by game time. The Rays play in a domed stadium.

Over in the National League, where the Philadelphia Phillies and Los Angeles Dodgers are contesting the championship, it is a showdown between World Series games in Philadelphia (where the weather will be only slightly warmer than in Boston) and Los Angeles (where it will be somewhat warmer). I have two problems with Los Angeles, in spite of its better weather. First, it might not be possible to see the game for the smoke from wildfires. Second, Manny Ramirez, that multi-millionaire crybaby and all-around slob, plays for the Dodgers. As long as he is a Dodger, I’ll root against the Bums, even when they are playing a team from Philadelphia — a city whose denizens once booed Santa Claus.

Farewell, Chicago

This year marked the first time that both the Chicago Cubs and Chicago White Sox were involved in post-season play. The first time was not a charm, as the Cubs lost their post-season series to the Dodgers, and the White Sox lost their post-season series to the Rays. Dreams of an all-Chicago World Series have vanished like soap bubbles.

Broken Careers

It has been observed many times that some illustrious baseball players would have amassed even more impressive career statistics than they did, had it not been for their service in the armed forces during World War II. Bob Feller, for example, missed the 1942-45 seasons (except for a few games at the end of the ’45 season); Joe Dimaggio, the 1943-45 seasons; Ted Williams, the 1943-45 seasons (and most of the 1952-53 seasons during the Korean War).

Wartime service likewise robbed many lesser-known players of productive years. Here I highlight three Hall of FamersHank Greenberg, Johnny Mize, and Enos Slaughter — and two lesser lights — Buddy Lewis and Cecil Travis.

Greenberg entered the Hall of Fame by the side door. He was chosen by the “normal” route, that is, election by the Baseball Writers Association of America (BBWAA). But under the rules then in effect, Greenberg — who retired after the 1947 season — could have been elected as early as 1949; he wasn’t elected until 1956. Greenberg’s eventual election to the Hall reflects not only his accomplishments as a player but also what he might have done with the four-and-a-half seasons he lost to military service. Greenberg spent most of the 1941 season as a pre-Peal Harbor draftee and the next three-and-a-half seasons as a post-Pearl Harbor volunteer. Those would have been prime seasons for Greeberg, who at the age of 29 had enjoyed a great 1940 season: batting .34o, winning his second MVP award, and leading the league in home runs, slugging percentage, and runs batted in.

Mize and Slaughter entered the Hall via the back door: election by the Veterans Committee. That dubious honor is reserved for players who aren’t elected within 20 years of their retirement. Mize, who retired in 1953, wasn’t inducted into the Hall until 1981. Slaughter, who stretched his career to 1959, had to wait until 1985 for membership in the Hall.

Mize compiled some outstanding numbers in his first seven seasons (1936-42), including two home-run titles (1939-40). But wartime service (1943-45) deprived him of three prime years (ages 30-32). Mize remained a home-run threat after the war (co-leading the NL in 1947 and 1948), which underscores the significance of his lost seasons. Mize ended his career with very good numbers (2,011 hits, 359 homers, .312 batting average), but his record would have been closer to spectacular had he not lost three prime seasons.

Slaughter had outstanding seasons from 1939 through 1942, then went to war at the age of 27 and missed the 1943-45 seasons (ages 27-29). Slaughter, like Mize, posted some outstanding postwar seasons (e.g., finishing high in the NL batting race four times). Slaughter, like Mize, turned in a very good career (2,383 hits, .300 batting average) that would have been closer to spectacular but for his three lost seasons.

It is perhaps indisputable that wartime service deprived Mize and Slaughter of slam-dunk Hall of Fame careers. Given that, their belated selection by the Veterans Committee was just.

The tales of Buddy Lewis and Cecil Travis have sadder endings. Lewis (who, at 92, is still among us) went to war at the age of 25 with .304 batting average to that point in his career. He completed his next full season at the age of 29. His career ended three years later following a hip injury and a one-year hiatus from baseball. Lewis finished with a very respectable lifetime batting average of .297. But he was deprived of a more productive career, probably one with a .300-plus average and stronger hold on fans’ memories, if not a shot at the Hall of Fame.

Cecil Travis was Lewis’s teammate, and his roommate on the road. Travis went to war at the age of 28 with a career average of .327. It is almost certain that his wartime service cost him a slot in the Hall of Fame. According to Wikipedia, Travis

suffered a bad case of frostbite during the Battle of the Bulge, necessitating an operation to prevent amputation of his feet. Travis received a Bronze Star for his military service. Although only 31 years old when he returned to baseball, he was not the same player as he had been before the war, and hit .241 in late 1945 and .252 in 1946. He retired after batting .216 in 74 games in 1947.

Travis was only 33 when his war-shortened career came to an end. In spite of it all, he ran up lifetime batting average of .314. What might have been, indeed.

When we remember the careers that were damaged by military service, we should remember not just the players who enjoyed great and near-great careers in spite of their service. We should remember, also, the likes of Buddy Lewis and Cecil Travis.

American League Dynasties and Doormats

Here are the records of the best American League teams over the years, as measured by centered, nine-year won-lost average (to enlarge, right-click and select “open link in new tab”):

Derived from statistics available at Baseball-Reference.com. The series begins in 1905 (the middle year of the span 1901-1909) and ends with 2004 (the middle year of the span 2000-2008).

Two points: (1) The Yankees have assembled the longest and strongest dynasties, most notably, the one that began in the 1930s and lasted until the 1960s. (2) Only five of the AL’s fifteen franchises* have been strong enough, at one time or another, to have the league’s best record over two or more consecutive nine-year spans.

The “other” teams have mustered leadership for only a single season. Those teams, from left to right on the graph, are the Indians, Tigers, and White Sox (on two occasions, separated by 30 years).

Will a new “dynasty” emerge, or will the Yankees halt their downward slide and reassert their dominance over the American League? Stay tuned.

As for the doormats, here are the records of the worst American League teams over the years, as measured by centered, nine-year won-lost average (to enlarge, right-click and select “open link in new tab”):

Derived from statistics available at Baseball-Reference.com. The series begins in 1905 (the middle year of the span 1901-1909) and ends with 2004 (the middle year of the span 2000-2008).

Two points: (1) Three franchises — the Athletics, Browns/Orioles, and Red Sox have endured long stretches of ignominy and enjoyed long stretches of glory. (2) Ignominy has been spread more evenly than glory: Ten of the AL’s fifteen franchises* have been weak enough, at one time or another, to have the league’s worst record over two or more consecutive nine-year spans.

The “other” teams have served as doormats for only a single season. Those teams, from left to right on the graph, are the White Sox, Angels, and Royals.

THE FOLLOWING PORTION WAS REVISED AND EXTENDED ON 10/04/08

Finally, I have postulated elsewhere (“Has Baseball Become More ‘Competitive’?“) that baseball has become increasingly competitive since the advent of expansion in the 1960s and free agency in the 1970s. I have revised that assessment, in view of the above graphs. In particular, it seems that the gap between best and worst teams had been narrowing (generally, though not monotonically) since the earliest days of the American League until about 1980. That observation caused me to take another look at the third graph in “Has Baseball Become More ‘Competitive’?”:

I now see that the American League had been growing steadily more “competitive” (if not always perceptibly so) from its earliest days until just before the onset of free agency in 1976 and the 1977 expansion round. Since then, there has been (on balance) no perceptible gain, and perhaps a bit of a setback, which may be due to the expansions of the 1990s.
__________
* The fifteen franchises are the original eight — Baltimore Orioles (previously Milwaukee Brewers and St. Louis Browns), Boston Red Sox, Chicago White Sox, Cleveland Indians, Detroit Tigers, Minnesota Twins (previously Washington Senators), New York Yankees (originally Baltimore Orioles), Oakland Athletics (previously in Philadelphia and Kansas City) — and seven expansion franchises –Kansas City Royals, Los Angeles/Anaheim Angels, Milwaukee Brewers (originally Seattle Pilots, now in National League), Seattle Mariners, Tampa Bay Devil Rays, Texas Rangers (previously the expansion Washington Senators), and Toronto Blue Jays. See this post (scroll down) for a detailed recounting of franchise histories.

Post-Season Play: Another Look

UPDATED 09/30/08

The World Series of major-league baseball was initiated in 1903 as a showdown between the best team in each league, the toddling American League (born 1901) and the twenty-something National League (born 1876). So far, so good, but with the advent of two-tiered post-season play in 1969 and three-tiered post-season play in 1995, each league often has not been represented by its best team.

Three-tiered play begins with four teams in each league: the three division leaders and a wild-card team (the team with the best record among the three second-place finishers). As a result, all sorts of distortions are possible. Here’s a list of them, by season (derived from Baseball-Reference.com):

1996, National League: Los Angeles entered post-season play as a wild-card team (thus losing “home field advantage”), even though it had a better record than St. Louis, which had the best record in its division. Moreover, Montreal didn’t gain a playoff berth, even though its record was as good as that of St. Louis.

1997, National League: Houston led its division with the sixth-best record in the league. Florida, with a better record than Houston, was the wild-card team. New York and Los Angeles didn’t make it into the playoffs, even though both had better records than Houston.

1997, American League: Wild-card New York had a better record than division leaders Cleveland and Seattle.

1998, American League: Boston repeated New York’s experience of the prior year, boasting a better record than division leaders Cleveland and Texas. Toronto, with the same record as Texas, missed the playoffs.

2000, American League: New York entered post-season play as a division titlist but with the fifth-best record in the league. Seattle (the wild-card team) had a better record than New York, as did Cleveland, which didn’t get into the playoffs.

2001, National League: Atlanta entered post-season play as a division titlist but with the fifth-best record in the league. St. Louis (the wild-card team) had a better record than that of Atlanta, as did San Francisco, which didn’t get into the playoffs.

2001, American League: Oakland, the wild-card team, had a better record than division titlists New York and Cleveland.

2002, American League: Anaheim, the wild-card team, had a better record than Minnesota, which entered the playoffs as a division leader.

2003, National League: Ditto for Florida vs. Chicago.

2003, American League: Minnesota led its division with the league’s fifth-best record, relegating third-best Boston to wild-card status and denying fourth-best Seattle a playoff spot.

2004, American League: Boston had to settle for the wild-card slot with a better record than Minnesota and Anaheim, division leaders both.

2005, National League: San Diego entered post-season play as a division winner, despite having a worse record than Houston (the wild-card team) and three teams that missed the playoffs (Philadelphia, Florida, New York).

2006, National League: St. Louis entered the playoffs as a division titlist, denying Philadelphia a slot with its fourth-best record and relegating third-place Los Angeles to the wild-card spot.

2006, American League: Wild-card Detroit had a better record than division-leading Oakland.

2007, National League: Chicago led its division with the sixth-best record in the league. Second-best Colorado took the wild-card spot despite having a better record than both Chicago and Philadelphia (another division leader). New York and San Diego, both with better records than Chicago, missed the playoffs.

2008, National League: Los Angeles enters post-season play as a division winner, with the league’s eighth-best record.

2008, American League: Chicago enters post-season play as a division winner, with the league’s fifth-best record.

Here’s my solution to this mess. Realign the leagues so that each has 15 teams, spread evenly among three divisions: 1, 2, and 3. The teams in division 1 would be the 5 teams with the best W-L records in the preceding season; division 2 would comprise the middle 5 teams; division 3, the worst 5 teams. To eliminate the biasing effects on W-L records of unbalanced schedules (which have been the norm for decades), each team would play the same number of games (home and away) against each of the other teams in its league. There would be no interleague play during the regular season.

These arrangements would make for more competitive divisions. The teams in division 1 would vie to finish first in order to advance to the World Series. The World Series would be a best-of-nine affair to mitigate (somewhat) the role of luck and the ability of a team to “recycle” its best pitchers more often than in the regular season.

Division 1 teams also would strive to remain in division 1, and thus in contention for World Series slots. The teams in divisions 2 and 3 would strive for the honor of division leadership and foradvancement to higher divisions — and, through advancement to division 1, a shot at participating in the World Series.

It’s time to make the regular-season meaningful and, therefore, to end the practice of giving mediocre teams a shot at the World Series. It’s time to make the World Series what it was for 64 seasons: a showdown between the best of the AL and the best of the NL. My proposal would accomplish all of that.

Big Losers

The Pittsburgh Pirates of major-league baseball will have a losing season this year, thus extending the team’s string of losing seasons to 16 (1993-2008) and tying the dubious record of the Philadelphia Phillies (1933-1948).

The leading consecutive-season losers in other major sports are, as far as I can determine, the Tampa Bay Buccaneers of pro football (15 seasons, 1982-1996), the Kansas City/Sacramento Kings of pro basketball (16 seasons, 1983-84 through 1998-99), and the Vancouver Canucks of pro hockey (15 seasons, 1976-77 through 1990-91).

The Pirates seem destined to set a new record for consecutive losing seasons among major sports teams.

The all-time major-league record for losing is held by the San Diego Padres. The Padres have compiled an overall W-L record of .462 since the team’s inception in 1969 — the worst record of any franchise formed before 1978. The Padres nevertheless have managed to win five division titles, and have twice gone on to win league championships.

The expansion Washington Senators/Texas Rangers — a 1961-vintage franchise — have an overall W-L record of .468. That is the second-worst record among franchises formed before 1978. The Rangers “boast” but three division titles and not a single league championship.

In spite of the “accomplishments” of the Padres and Rangers, I must grant the Worst Franchise Award to the above-mentioned Philadelphia Phillies. The Phillies, who are now in their 126th season of major-league play, have compiled a W-L record of only .470. During the 31-season span of 1918-1948 the Phillies eked out only one (barely) winning season, going 78-76 in 1932. (The Pirates have an overall record of .505, in spite of a long losing tradition, one that dates back to the second season of their 127-year history.)

Tamed Tigers

The 2006 season began brightly for the Detroit Tigers, a team that had posted a losing record in each of its preceding twelve seasons. The Tigers went 76-36 (.679) in the the first 112 games of the 2006 season, running up a ten-game lead in their division. The Detroiters then went cold and played 29-31 (.483) the rest of the way. As a result, they finished second in their division. Nevertheless, as a wild-card entry in post-season play, the Tigers managed to win the American League championship and advance to the World Series — a feat the underscores the vagaries of short, post-season series, which often see inferior teams come out on top.

But I digress. The tale of the 2006 Tigers (pun intended) has been retold, with embellishments, by the 2007 and 2008 teams. The 2007 team started 60-40 (.600), but finished 28-34 (.452) and wound up eight games behind the division leader (and, mercifully, out of the playoffs). The 2008 Tigers managed briefly to eke out a winning record — peaking at 52-49 (.515) — but have since played 19-31 (.380). If they don’t finish last in their division it will be thanks to the perennially abysmal Kansas City Royals.

So much for the Tigers’ (partial) season of glory, or sic transit gloria mundi.

UPDATE (09/24/08): The Tigers have lost six in a row, are a game behind KC, and face a season-ending four-game series with the Tampa Bay Rays. Even though the Tigers may manage to escape the cellar by a whisker (another pun intended), there can be no doubt that they have reverted to their perennially abysmal ways. Since their last division championship, 21 seasons ago, they have had only five winning seasons. Toothless.

One-Season Wonders?

Norm Cash and Brady Anderson had respectable careers by major-league norms, but each also had a “career year” that stood far above his other accomplishments as a player.

In Cash’s case, the one-season wonder was his league-leading batting average of .361 in 1961. It was Cash’s first and last .300 season in a career that included 14 full seasons of play. His second-best average was .283; his second-best finish was in 1969, when his .279 average garnered seventh place in the AL batting race; and his career average was only .271.

Anderson’s anomalous 1996 season saw him slug 50 home runs, finishing second in the AL to Mark McGwire. Anderson logged nine other full seasons of play, but in none of those seasons did he hit more than 24 home runs. He averaged only 19 home runs per 162 games over the span of his career.

Nevertheless, Cash and Anderson weren’t true one-season wonders. That “accolade” should be reserved for the likes of Gene Bearden and Mark Fidrych. Both were pitchers who had outstanding rookie years — Bearden with a W-L record of 20-7 in 1948; Fidrych with a W-L of 19-9 in 1976 — and then faded quickly, departing from the big leagues after brief, mediocre careers. (Actually, Fidrych faded after July 20 of his rookie season, by which date his record was 11-1; he went 8-8 for the balance of the season.)

Among position players, there’s Joe Charbonneau, AL Rookie of the Year in 1980 with a .289 average in 131 games. After that: .210 in 48 games, .214 in 22 games, and … gone from the majors.

Bearden, Fidrych, and Charbonneau are among the true one-season wonders of baseball.

The Best Announcer in Baseball’s History?

Many baseball fans consider Vin Scully to have been the best announcer in baseball’s long history. Others favor the Southern stylings of Ernie Harwell. I respect Scully and Harwell, but I prefer the late Skip Caray‘s acerbic wit.

Yes, Caray’s partisanship toward the Atlanta Braves was obvious, but he could be tough on the Braves, as well. In any event, he didn’t shirk from the truth about what had happened on the field, good or bad for the Braves. And, unlike most announcers of the past fifty years, Caray said nothing if there was nothing to be said; he didn’t babble just to fill air time. Caray and his long-time partner — the knowledgeable, soft-spoken Pete Van Wieren — made an ideal team: the best I’ve heard, by a long shot.

Baseball and Groundhog Day

You may remember the movie Groundhog Day (1993), in which the character played by Bill Murray keeps having the same day over and over again. (If you haven’t seen the movie, do so; I recommend it.)

Has the same thing happened in major-league baseball? That is, in its 137-year history (1871-2007), has a season has ended with a league’s teams finishing in the same positions as those they had occupied at the end of the previous season? The answer is “no, but…”

To arrive at that answer, I went here and followed the links, which cover the following major baseball leagues and seasons of operation:

National Association, 1871-1875
National League, 1876-2007
American Association, 1882-1891
Union Association, 1884
Players League, 1890
American League, 1901-2007
Federal League, 1914-1915

An entire league has yet to end its season with all of its teams finishing in the same order as they did in the previous season. However, since the advent of divisional play in 1969, some division finishes have been duplicated, and even sextuplicated:

  • The duplication occurred in the American League’s Central Division in 1996 and 1997, when Cleveland, Chicago, Milwaukee, Minnesota, and Kansas City ended both seasons in that order (Cleveland first, etc.).
  • The sextuplication occurred in the American League’s Eastern Division from 1998 through 2003, when New York, Boston, Toronto, Baltimore, and Tampa Bay ended all six seasons in that order (New York first, etc.).

The 2005 season saw a repetition of the AL East’s pattern for 1998-2003. That’s seven identical finishes in a span of eight seasons. Moreover, the Yankees and Red Sox finished one-two in eight consecutive seasons (1998-2005). How ’bout that!

D.C. Isn’t a Baseball Town

It’s often said that Washington, D.C., isn’t a “baseball town.” Why, then, does D.C. have yet another major-league team? Only because Members of Congress, who live in and around D.C. and treat it as a second constituency (or colonial territory), pressured Major League Baseball to move the failing Montreal Expos to D.C.

The long, sad history of big-league ball in D.C. goes back to 1901 and the original Washington Senators, who — upon their transformation to the Minnesota Twins after the 1960 season — were replaced immediately by the expansion Washington Senators, who lasted only eleven seasons before their transformation to the Texas Rangers.

Anyway, D.C. has lost two major-league teams because it isn’t a baseball town — and the numbers prove it. In the following graph I compare attendance for D.C.’s hapless teams with the American League teams of New York and Detroit (real baseball towns). (Relative attendance is the ratio of a team’s home attendance for a season to the average for all major-league teams in the same season.) Even allowing for the fact that attendance tends to rise and fall with a team’s success (or lack thereof), it’s clear that the D.C. area has been, and remains, relatively cool to baseball:

Sources:
Major-league attendance by year: http://www.ballparksofbaseball.com/attendance.htm. Team attendance by year: http://www.baseball-almanac.com/stadium.shtml. Team won-lost records by year: http://www.baseball-reference.com/leagues/AL.shtml.

Yes, the Washington Nationals (2005-07) seem to be doing better than the previous Washington teams. But that showing is unimpressive compared with the records of real baseball towns, and can be chalked up to the novelty of baseball’s return to D.C. The novelty, in fact, lasted only a season; attendance in the Nats’ second and third seasons slid back toward the norm for D.C..

The rate of attendance at Nationals’ games has risen in 2008 — as one might expect, given the team’s new, costly, tax-funded stadium — but it is below the pace of 2005. As the Nats inevitably rack up losing seasons, the stadium will become an empty cavern, and the taxpayers of D.C. (and perhaps the nation) will be left holding the bag for it.

Post-Season Play, Atheism, and the Worrying Classes

Stephen Dubner of Freakonomics yesterday published an interview of Bill James, founder of sabermetrics (statistical analysis of baseball). The interview reveals James as a no-nonsense purveyor of wisdom, and not just about baseball. Some examples:

Q: Billy Beane, G.M. for the Oakland A’s, has made sabermetric stats a major part of his “value” philosophy when building a baseball team. He’s frequently said that his method will build regular season winners but it doesn’t seem to work in the playoffs. Do you think that this is simply a result of a small sample size or the wrong statistics being used, or is it something more fundamental about “unmeasurable” statistics, like the ability to perform under pressure and “heart?”

A: Oh, I thought people had stopped asking that. Blast from the past there. Look, there’s a lot of luck in winning in post-season. You’re up against a really good team, by definition, and you’ve only got a few days to get it right. It takes some luck.

Are there also types of players and factors that are helpful in that situation? Of course. It’s like asking a physics professor whether there is a God. Scientists don’t know anything more about whether there is a God than morons do, because it’s not a scientific issue. This isn’t something I can measure. It’s a matter of faith.

James agrees with me about the meaning of post-season play, or, rather, its meaninglessness. James also reveals himself as a true scientist when he rejects “scientific” atheism.

Q: What unanswered questions (either baseball-related or not) are you thinking about right now?

A: Why does American society always perceive itself as becoming constantly more and more dangerous — and thus devote ever more and more effort to increasing security — even though almost all measurable dangers, including crime rates, have been falling throughout most of my lifetime? And … is this a good thing?

There speaks a man who seems to understand that we are over-regulated because of the “worrying classes” and their fear of the free market.

Did Roger Do It?

In “Testing for Steroids” I examine the records of the eleven most prolific home-run hitters in the history of major-league baseball: Mark McGwire, Barry Bonds, and nine other. The graphs I present in “Testing…” show that the late-career accomplishments of McGwire and Bonds are far out of line with (a) their earlier accomplishments and (b) the career patterns of the other nine sluggers. In sum, there is a strong statistical case for the proposition that McGwire and Bonds used and benefited from performance-enhancing drugs.

Is there similar evidence (pro or con) regarding Roger Clemens? There’s an analysis released by Clemens’s agents (the “Clemens Report“), which is (rightly) found wanting by Justin Wolfers (writing at the Freakonomics blog, here and here). I am not, however, smitten with Wolfers’s rather vague statistical presentation. Steven Levitt (also writing at the Freakonomics blog) points to a better one, by Nate Silver.

I had been working on my own analysis before I came upon Silver’s. Though our approaches are somewhat different, Silver and I reach the same conclusion: “where [Clemens’s] statistical record is concerned, there is no smoking gun.” Or, as Levitt says,

While statistical evidence can sometimes provide convincing evidence that something really out of the ordinary has happened (like the sumo wrestling cheating that was documented in Freakonomics), it is far from clear how to interpret the findings when things look normal.

The statistical case against McGwire and Bonds is compelling. There is no statistical case against Clemens. He may have used steroids and HGH, as alleged by Brian McNamee, but the numbers don’t prove it.

For my analysis, I draw on Baseball-Reference.com to compare Clemens’s record with the records of pitchers who are his peers:

  • First, I compare Clemens with other highly successful and durable pitchers on the basis of walks-plus-innings pitched (WHIP), by age. I define highly successful pitchers as those who have won at least 250 games in the “live-ball era.” Durable pitchers, for the purpose of this comparison, also pitched at least 100 innings in at least one season at the age of 40 (or older).
  • Second, I compare Clemens with other starting pitchers who averaged more than 8 strikeouts per 9 innings pitched (SO/9IP) during their careers, and who also pitched at least 100 innings in each of 10 or more seasons.

For the pitchers who meet those criteria, I omit intra-career seasons of less than 100 innings. Further, I adjust each season’s statistics by

  • normalizing for differences between leagues and across time (which are substantial*), and
  • indexing each pitcher’s statistics to the pitcher’s best season, in order to compare relative changes in the performance of pitcher A during his career with relative changes in the performance of pitchers B, C, etc., during their careers.

The 18 highly successful, durable pitchers included in my analysis are (in order of first 100-inning season): Ted Lyons (1924, 260 career wins), Lefty Grove (1925, 300), Early Wynn (1942, 300), Warren Spahn (1946, 363), Jim Kaat (1961, 283), Tommy John (1965, 288), Ferguson Jenkins (1966, 284), Gaylord Perry (1964, 314), Don Sutton (1966, 324), Steve Carlton (1967, 329), Phil Niekro (1967, 318), Tom Seaver (1967, 311), Nolan Ryan (1968, 324), Bert Blyleven (1970, 287), Roger Clemens (1984, 354), Greg Maddux (1987, 347), Tom Glavine (1988, 303), and Randy Johnson (1989, 284).

To keep the following graph simple, I highlight only the careers of Ryan, Johnson, and Clemens (indicating the seasons in which he is alleged to have received injections of steroids and/or HGH). (For a better view of the graphs in this post, right-click on them and select “open in new tab.”) The gray lines represent the careers of the other 15 pitchers. The light blue lines indicate the normal range of those 15 pitchers’ career trajectories. (The normal range is the range that contains about two-thirds of each year’s observations; about one-third of them are on either side of each year’s mean.) The shape of the light blue lines tells the expected tale: improvement, a peak (around age 30-32), and deterioration.

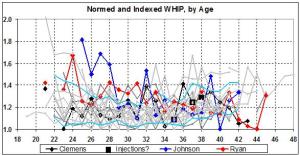
The career patterns of Clemens, Johnson, and Ryan are atypical. But they are atypical in different ways. Clemens’s record is up and down. His improvement in the late years is striking, but no more striking than that of Ryan, who simply follows a different trajectory (steady improvement) to arrive at about the same place at about the same age. Johnson’s trajectory is similar to Ryan’s, but with more ups and downs. Like Ryan, Johnson peaks very late. Johnson’s sudden deterioration following his peak can be attributed to his well-known back problems; Ryan’s, to sheer age.

In sum, Clemens had a more consistent career than those of Johnson and Ryan. But Clemens’s late-career success cannot be deemed suspicious when viewed against the similar successes of Johnson and Ryan.

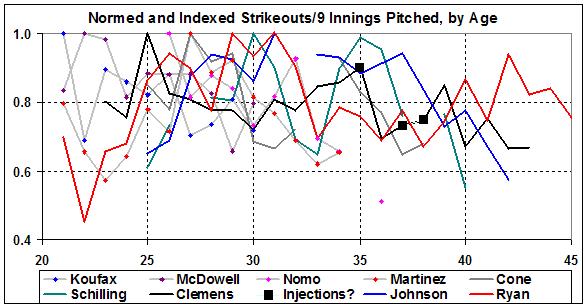
Turning to the the leading “power pitchers,” we have Sandy Koufax (first 100-inning year, 1957; 9.28 SO/9IP for his career), Sam McDowell (1964, 8.86), Nolan Ryan (1968, 9.55), Roger Clemens (1984, 8.55), David Cone (1988, 8.28), Randy Johnson (1989, 10.78), Curt Schilling (1992, 8.60), Pedro Martinez (1993, 10.20), and Hideo Nomo (1995, 8.74):

Only four of the nine pitched 100 innings in a season at age 40 (or older): Schilling, Clemens, Johnson, and Ryan. Among that select group, Clemens’s record is unexceptional. His late surge (local peaks at ages 35 and 39) is no more extreme than the late surges of Schilling (at 35), Johnson (at 37), and Ryan (at 40 and 42).

There is no statistical case against Roger Clemens. Did he “do it”? Maybe. But the proof of “it” requires hard, physical evidence (or an admission by Clemens), not statistical analysis.

The inconclusiveness of of statistical analysis, in this case, may mean one of two things: (1) Clemens didn’t use performance-enhancing drugs. (2) If Clemens relied mainly on HGH (as opposed to steroids) in an effort to bolster his performance, the effect may have been nil. For example,

there is no proof that net protein retention is promoted in adults, except possibly of connective tissue. The overexaggeration of the effects of growth hormone in muscle building is effectively promoting its abuse and thereby encouraging athletes and elderly men to expose themselves to increased risk of disease for little benefit.

Clemens may simply be living proof of the benefits of physical fitness.
__________
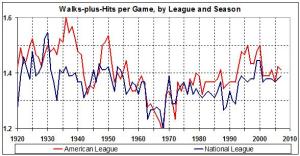
* WHIP and SO/9IP vary considerably by league and across time, for many reasons: expansion, the introduction of the designated hitter to the American League (1974), the replacement of old ball parks with new (sometimes smaller) ones, and variations in such things as the strike zone, the height of the pitching mound, the size of fielders’ gloves, the resiliency of the baseball, and the frequency with which umpires put a new ball into play.

To illustrate changes in WHIP, I use a closely related number: walks-plus-hits per game. Here’s the tally, by league and season for 1920-2007 (a period that spans the careers of the durable, highly successful pitchers whose records I analyze in this post):

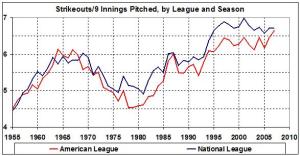
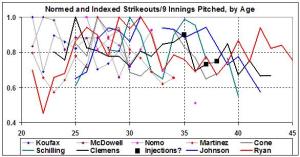
And here’s the tally of SO/9IP, by league and season for 1955-2007 (a period that covers the careers of the top “power pitchers” whose records I analyze in this post):

One Hall of Famer

By my standards, only Goose Gossage and Less Smith should have been elected to the Hall of Fame yesterday. Well, the Goose made it. Better yet, no undeserving player was selected from a long list of undeserving candidates.

If only it were politic to un-elect the undeserving, membership in the Hall would really mean something.

Hall of Famers?

UPDATED (01/09/08)

According to Baseball-Reference.com, the following players are on the ballot for membership in the Hall of Fame:

Brady Anderson
Harold Baines
Rod Beck
Bert Blyleven
Dave Concepcion
Andre Dawson
Shawon Dunston
Chuck Finley
Travis Fryman
Rich (Goose) Gossage
Tommy John
David Justice
Chuck Knoblauch
Don Mattingly
Mark McGwire
Jack Morris
Dale Murphy
Robb Nen
Dave Parker
Tim Raines
Jim Rice
Jose Rijo
Lee Smith
Todd Stottlemyre
Alan Trammell

The question I ask and answer here is this: Which of the candidates should be in the Hall of Fame, based on his performance — regardless of the credentials of any players who are undeservedly in the Hall? Here are my criteria for Hall of Fame pitchers and batters (revised slightly since I first published them):

A pitcher must have at least 15 seasons of 30 or more games pitched, and must have recorded

  • at least 300 wins, or
  • at least 250 wins and an ERA+ of 120 or higher (go here and scroll down for the definition of ERA+), or
  • at least 200 wins and a W-L average of .600 or better and an ERA+ of 120 or higher, or
  • an ERA+ of 120 or higher while relieving in at least 750 games.

A batter must have recorded

  • an OPS+ of at least 150 (go here and scroll down for the definition of OPS+) in a career of least 15 seasons of 100 games or more, or
  • at least 2,800 lifetime hits and a lifetime batting average of at least .300, or
  • an OPS+ of at least 120 and at least 2,000 lifetime base hits and a lifetime batting average of at least .300.

I make an exception for a batter with at least 15 seasons of 100 game or more, if

  • he is among the top 20 in home runs per at-bat for a career of at least 5,000 at bats, or
  • he led his league in fielding percentage for his position in at least 10 seasons, or
  • he won at least 10 Gold Gloves.

Against my criteria, who among the current candidates belongs in the Hall of Fame? Answer:

Goose Gossage
Lee Smith

UPDATE (01/09/08): No player, regardless of his accomplishments, should be in the Hall of Fame if it is proved, to the satisfaction of the Commissioner of Baseball, that the player used performance-enhancing drugs for a cumulative period of more than half a baseball season, when such drugs were banned by baseball. Moreover, no coach, manager, or executive who placed bets on baseball games while active in baseball should be in the Hall of Fame if such betting activity is proved, to the satisfaction of the Commissioner of Baseball.

It should go without saying that the involvement of any player, manager, coach, or executive in the throwing of games or shaving of scores, when proved to the satisfaction of the Commissioner of Baseball, must lead to that person’s immediate banishment from the game. No such person should ever be eligible for the Hall of Fame.

Testing for Steroids, Updated

Here.

In case you missed it, the post is about the top home-run hitters in major league history. It includes some informative charts, which highlight the unusually prolific seasons enjoyed by Mark McGwire and Barry Bonds. Draw your own conclusions.

Baseball Roundup

REVISED, 10/29/07

In light of the outcome of the 2007 World Series (Boston Red Sox over the Colorado Rockies, 4 games to zip), and other baseball events of the past year or two, I have updated several posts:

A New Curse for the Red Sox REVISED TODAY
The Next Winner of the World Series? RE-REVISED TODAY
The Meaning of the World Series
Pennant Winner vs. Best Team
Baseball’s Losers
World Series Contestants: Not [Always] the Best Teams