A Tale of Three Franchises

The American League had eight teams from 1901 through 1960; the National League had eight teams from 1901 through 1961. I have written elsewhere about post-1960/61 expansion and its influence on the quality and competitiveness of baseball. I focus here on three of the AL’s original franchises: the three with the worst overall records, among the original eight, from 1901 through 2007.

The three franchises — now known as the Oakland Athletics, Minnesota Twins, and Baltimore Orioles — are noteworthy not just because they, among the original eight, have won the lowest proportion of regular-season games. They are noteworthy also because they were the among the six major league teams to pick up and move in the span 1953-61. (The three NL teams that moved were the Braves, from Boston to Milwaukee in 1953 — and thence to Atlanta in 1966; the Dodgers, from Brooklyn to Los Angeles in 1958; and the Giants, from New York to San Francisco in 1958)

Going back a bit, the American League’s eight original franchises had stayed put from 1903 through 1953. The Baltimore Orioles franchise (1901-2) became the New York Highlanders in 1903 (renamed the Yankees in 1913). The Milwaukee Brewers franchise (1901) resided in St. Louis (as the Browns) from 1902 through 1953. The Browns, in 1954, became — and remain — the Baltimore Orioles.

One year after the Browns’ shift to Baltimore, the Philadelphia Athletics jumped to Kansas City, where they played 1955-67. The A’s then packed off to Oakland where they have been from 1968 to the present.

Then came the metamorphosis of the Washington Senators, often last in the American League during the years 1901-60. The Nats (a nickname of yore) were reborn in 1961 as the still-extant Minnesota Twins.

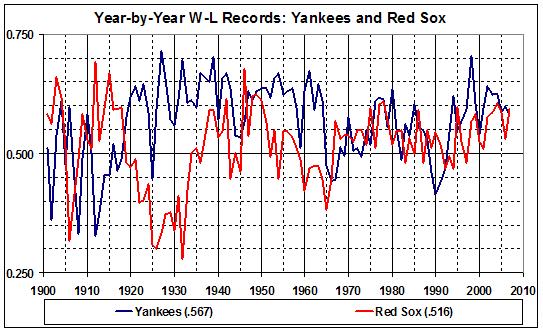
Why did the Browns, A’s, and Senators move? Short answer: Fans don’t flock to see losers. And losers they had been, and often continued to be. Here are their season-by-season records for 1901 through 2007 (overall records shown in the legend):

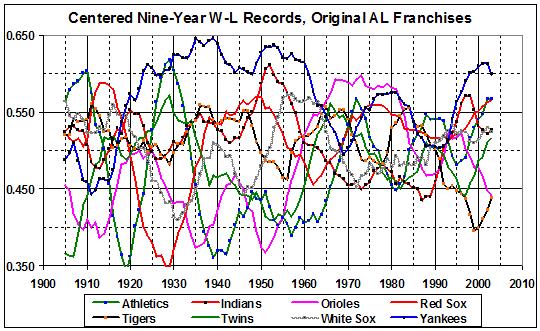
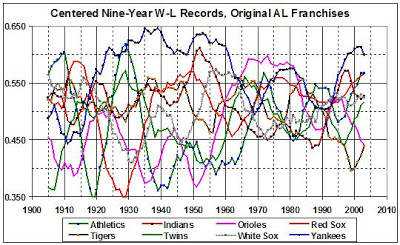
And here are easier-to-read (and more informative) nine-year records:

Fans of the reborn Browns (Orioles) and Senators (Twins) didn’t suffer long before the replanted franchises produced winners. The Orioles got a fresh start under new ownership, following Bill Veeck‘s disastrous years at the Browns’ helm. The Senators/Twins remained under Calvin Griffith‘s control for more than two decades, however. So, it would seem that a change of scenery (more tickets sold to newly enchanted fans) can go just as far as a change of ownership (more money to spend on players’ salaries).

What about the A’s? They moved to Kansas City under new ownership, after more than five decades under Connie Mack and his sons. But that didn’t pan out; the A’s remained a lousy team. Another new owner (Charles O. Finley) moved the team from Kansas City to Oakland. A few years passed and the A’s became big winners, for a while. In this instance, success followed both a change of scenery and new ownership.

New ownership can work against a team, of course. It has in the case of the O’s, whose resurgence in the 1990s was reversed by an especially obnoxious and meddlesome owner, Peter Angelos. In that vein, it is obvious that the New York Yankees‘ resurgence in the mid-to-late 1970s is owed to George Steinbrenner. But if Steinbrenner can take credit for that resurgence (as he would), he can (but will not, I am sure) take responsibility for the Yankees’ mediocrity from the early 1980s to early 1990s, and for their inability to win a World Series since 2000.

Anyway, the tale of the A’s, Senators/Twins, and Browns/O’s is this: persistent mediocrity and failure, punctuated by fleeting glory. The O’s came closest, of the three teams, to having a baseball dynasty (from the late 1960s to the early 1980s), but the Yankees they never were. The long periods of failure on the part of the A’s were self-inflicted in the days of Connie Mack‘s ownership. (Follow the link for more on that.) The failure of Washington’s baseball teams seems to be a law of nature, as evidenced by the records of the original Senators, the expansion Senators, and the Expos/Nationals, a.k.a Three Losers.

In the zero-sum game that is baseball, failure is self-inflicted. You either spend the money it takes to win, and spend it wisely, or you do not. Yes, the Yankees have loomed dominantly, most of the time, from the 1920s to the present. And, given that, some teams must have losing records. But why — so often and so persistently — have those teams been the A’s, Senators/Twins, and Browns/Orioles?

It almost makes me believe in destiny.

World Series Contestants: Not the Best Teams

UPDATED, 10/28/07

As I explain here, since the advent of divisional play and the introduction of the wild-card slot in 1995, the best team in a league doesn’t always represent its league in the World Series. Here’s the tally (National League teams listed first, * indicates winner of World Series):

1995 —
Atlanta Braves (division winner, best record)*
Cleveland Indians (division winner, best record)

1996 —
Atlanta Braves (division winner, best record)
New York Yankees (division winner, second-best record)*

1997 —
Florida Marlins (wild-card team, second-best record)*
Cleveland Indians (division winner, fourth-best record)

1998–
San Diego Padres (division winner, third-best record)
New York Yankees (division winner, best record)*

1999–
Atlanta Braves (division winner, best record)
New York Yankees (division winner, best record)*

2000–
New York Mets (wild-card team, fourth-best record)
New York Yankees (division winner, fourth-best record)*

2001–
Arizona Diamondbacks (division winner, third-best record)*
New York Yankees (division winner, second-best record)

2002–
San Francisco Giants (wild-card team, fourth-best record)
Anaheim Angels (wild-card team, third-best record)*

2003–
Florida Marlines (wild-card team, third-best record)*
New York Yankees (division winner, best record)

2004–
St. Louis Cardinals (division winner, best record)
Boston Red Sox (wild-card team, second-best record)*

2005–
Houston Astros (wild-card team, third-best record)
Chicago White Sox (division winner, best record)*

2006–
St. Louis Cardinals (division winner, fourth-best record)*
Detroit Tigers (wild-card team, third-best record)

2007–
Colorado Rockies (wild-card team, second-best record)
Boston Red Sox (division winner, tied for best record)*

There you have it. The last year in which the World Series featured both leagues’ best teams was 1999. The only other time, for the years of interest here, was in 1996.

Of the 13 Series from 1995 through 2007, five were won by the inferior team, as measured by the two teams’ performance in their respective leagues. The best team in either league has won only five of the 13 Series.

Wild-card teams have gone on to play in seven of the 13 Series from 1995 through 2007. In 2002 there was an all-wild-card Series.

As always, the winner of this year’s Series will be able to claim nothing more than having been the better team over a span of four to seven games.

Do Better Teams Finish First?

The answer to the title question might seem obvious. But it is not.

For reasons I discuss here, here, and here, post-season play is of no account when it comes to assessing a baseball team’s quality. The acid test of quality is the ability to finish first at the end of a regular season’s play. The acid test of quality over the long haul is the ability to amass first-place finishes, measured in terms of first-place finishes per season.

But what about quality as measured by the proportion of games won by a franchise over the long haul? Is there a good correlation between that overall record and the number of first-place finishes garnered per season of play? I will here answer that question — and question some of the answers — with a look at the American League.

Before plunging into the numbers, I must note that value of a first-place finish has fluctuated, given expansion and, then, divisional play. A first-place finish in the years before expansion, when the AL had 8 teams, ought to count for more than, say, a first-place finish in the AL West since it became a 4-team circuit.

Accordingly, I value first-place finishes according to the number of teams competing for first place in the league (before divisional play) and in a division (from the onset of divisional play). I use the number of original teams (8) to index the value of each first-place finish. Thus:

1901-1960 (8 teams, no divisions) — 8/8 = 1.000
1961-1968 (10 teams, no divisions) — 10/8 = 1.250
1969-1976 (6 teams in each of 2 divisions) — 6/8 = 0.750
1977-1993 (7 teams in each of 2 divisions) — 7/8 = 0.875
1994-2007, AL East (5 teams) — 5/8 = 0.625
1994-2007, AL Central (5 teams) — 5/8 = 0.625
1994-2007, AL West (4 teams) — 4/8 = 0.500

Drawing on statistics available at Baseball-Reference.com, I derived for each AL franchise its overall record and number of weighted first-place finishes per season:

Franchise

Record

1st/season

Devil Rays

0.399

0.000

Rangers

0.468

0.043

Mariners

0.473

0.048

Orioles

0.476

0.078

Twins

0.481

0.082

Brewers

0.482

0.030

Athletics

0.486

0.179

Royals

0.487

0.131

Angels

0.491

0.088

Blue Jays

0.496

0.141

White Sox

0.505

0.092

Tigers

0.506

0.100

Indians

0.511

0.069

Red Sox

0.516

0.120

Yankees

0.567

0.375

I then regressed first-place finishes per season against overall record, including only those teams with any first-place finishes. (In other words, I omitted the hapless and perhaps hopeless Devil Rays; the Brewers, late of the AL, escaped oblivion only by dint of their 1982 division title.) The result:

The gray lines bound the standard error of the regression and highlight the outliers: the Athletics and Yankees on the high side, the Indians on the low side. (The plot points, going from left to right, correspond with the franchises listed in the table above, reading downward from Rangers through Yankees.)

Inspection of the graph suggests at least three questions:

  1. Who has fared better, original teams or expansion teams?
  2. Why have the A’s outshone the Indians?
  3. With the Yankees out of the picture, would there still be a positive relationship between overall record and first-place finishes?
  4. Which is more important, overall record or frequency of first-place finishes?

A 1. The expansion teams — on the whole and even including the Devil Rays — have slightly outperformed the original teams.

A 2. The Indians have been more consistent, with fewer highs and lows than the A’s. The A’s more frequent highs have enabled them to garner more first-place finishes than the Indians. The A’s more frequent lows, of course, don’t count against them when it comes to tallying first-place finishes. Graphically:

A 3. By taking the Yankees out of the picture, I get this:

There’s still a positive relationship between overall record and first-place finishes, albeit a weaker one. However, if the Yankees did not exist, it would be necessary to invent them. Oops, I mean that if there had been no Yankees franchise, the White Sox, Tigers, and Red Sox (especially the Red Sox) would have had more first-place finishes. (The Indians might have had more, as well.) That is to say, there would be a stronger positive relationship than the one depicted immediately above.

A4. Frequency of first place finishes is more important than overall record. A winning record — as in the case of the Indians, with the third-best overall record in the AL — means only that a franchise has had more good years than bad ones. Look at the Red Sox, with their second-best overall record and their general frustration at the hands of the Yankees over the years:

Before 1967, the Red Sox’ overall record was only 0.499; the Yankees’, 0.575. From 1967 through 2007, however, the Yankees played 0.555 ball, as against 0.542 for the Red Sox. The Red Sox, in other words, have become a much stronger team — almost as strong as the Yankees. And the graph shows it. But from 1967 through 2007 the Yankees earned 16 league/division titles to 7 for the Red Sox. (Har, har!)

Finishing first is the measure of a team’s quality, regardless of the team’s fate in post-season play.

Note to baseball purists: I write 0.xxx instead of .xxx because I am a purist when it comes to style. I follow A Manual of Style, published by The University of Chicago Press (twelfth edition, revised, section 13.13).

Baseball’s Losers

UPDATED, 10/28/07

The Colorado (Denver) Rockies won the National League Championship Series for 2007, taking four straight games from the Arizona Diamondbacks. The Rockies thus left the short list of franchises that have never won a league championship. The remaining perennial losers and also-rans are:

Seattle Mariners, American League 1977-2007 (best record in 2001, but lost AL pennant to NY Yankees)
Tampa Bay Devil Rays, American League 1998-2007
Texas Rangers (formerly the expansion Washington Senators), American League 1961-2007
Washington Nationals (formerly the Montreal Expos), National League 1969-2007

The Milwaukee Brewers (originally the Seattle Pilots) joined the American League in 1969 and won a pennant there in 1982. But the Brewers have gone pennantless since becoming a National League team in 1998.

The Mariners, Devil Rays, Rangers, and Nationals (and their predecessors, if any) have not won a World Series, of course. Four other franchises have won league championships but have failed to win a World Series:

Colorado Rockies (2007)
Houston Astros (2005)
Milwaukee Brewers (1982)
San Diego Padres (1984, 1998)

Related posts:
Can Money Buy Excellence in Baseball?
The Meaning of the World Series
Pennant Winner vs. Best Team

Sports, Illustrated

Hockey: a Three Stooges film with many extras

Basketball: a video game

Football: a feature-length cartoon

Baseball: a novel that sometimes becomes a trilogy

The Best and Worst of the American League

This is my first follow-up to “Has Baseball Become More Competitive?” Here I draw on the first two graphs from that post to make some observations about the best and worst teams in the history of the American League. My metric is the centered, nine-year won-lost (W-L) record (see “…Competitive?” for more about the metric). For reasons given here and here, I eschew performance in post-season play as a measure of excellence.

The graphs (to enlarge, right click and select “open in new tab”):

Remember, I am measuring performance over nine-year spans — not individual seasons — so the following lists will not always correspond with lists of teams having the best and worst W-L record, by season. Using the nine-year, I present the best (E = expansion team)…

Athletics (then of Philadelphia), 1905-11
Red Sox, 1912-1917
White Sox, 1918
Yankees, 1919-62
White Sox, 1963
Yankees, 1964
Orioles, 1965-81
Yankees, 1982-85
Blue Jays (E), 1986-90
Athletics (then of Oakland), 1991-92
White Sox, 1993
Yankees, 1994-2003

…and the worst (E = expansion team)…

Twins (then the original Washington Senators), 1905-08
Orioles (then the St. Louis Browns), 1909-15
Athletics (then in Philadelphia), 1916-22
Red Sox, 1923-32
Orioles (still the Browns), 1933-37
Athletics (still in Philadelphia), 1938-47
Orioles (still the Browns), 1948-54 (tied with Athletics in ’54)
Athletics, 1954-64 (tied with Browns in ’54) (A’s in Philadelphia through 1954; in Kansas City, 1955-67)
Rangers (E), 1965-72 (as the expansion Washington Senators, 1965-71; as the Texas Rangers, 1972)
Brewers (E), 1973-74
Indians, 1975
Angels (E), 1976
White Sox, 1977
Twins, 1978-79
Athletics (in Oakland), 1980
Mariners (E), 1981-85
Indians, 1986-89
Mariners (E), 1990-91
Tigers, 1992-2001
Devil Rays (E), 2002-03

I take these lists (especially the list of worst teams) as further evidence that baseball has become more competitive since the onset of expansion and free agency. Just look at the number of original franchises at the bottom of the heap since 1965.

There’s more to come, in future posts.

Has Baseball Become More "Competitive"?

I begin to answer the question by presenting the following graphs. They show the nine-year, centered won-lost (W-L) record (a.k.a. winning percentage) of each of the franchises that has had teams in the American League. (To enlarge an image, right-click on it and select “open in a new tab.”)

Source: Statistics derived from information available at Baseball-Reference.com.

Each franchise is identified by the nickname of its current team. Some franchises have changed cities, of course, and some teams’ nicknames have changed, even when the teams have stayed put.

I chose to plot nine-year, centered W-L records for three reasons. First, a team’s record over nine years should obliterate aberrations: unusually bad or good years. Second, the selection of nine years (rather than ten, for instance) allows for the computation of a centered average. Third, a centered average gives a better indication of a team’s success (or failure) in the year for which the average is plotted.

I plotted the original eight franchises separately from the seven expansion franchises for two reasons. First, a graph that plots the records of all the franchises would be too cluttered to read easily. Second, I wanted to highlight the effects of expansion (if any) on the success (or failure) of the original franchises. (Note that the records of the seven expansion teams include those of the Milwaukee Brewers, now a National League team. The Brewers entered the AL in 1969 as the Seattle Pilots, moved to Milwaukee in 1970, and moved to the National League after the 1997 season. Accordingly, I computed and plotted nine-year, centered averages only for the years that the Pilots/Brewers were an AL team.)

Now, for some relevant history:

  • Expansion of the AL occurred in three increments: two teams in 1961 (Angels and Senators/Rangers), two teams in 1969 (Pilots/Brewers and Royals), and two teams in 1977 (Blue Jays and Mariners). For the AL, the addition of the Devil Rays in 1998 offset the transfer of the Brewers to the NL. Expansion of the NL occurred in 1962 (Mets and Astros), 1969 (Expos/Nationals and Padres), 1993 (Marlins and Rockies), and 1998 (Brewers and Diamondbacks). Thus the number of major league teams, which had been 16 from 1901 through 1960, rose to 18 in 1961, 20 in 1962, 24 in 1969, 26 in 1977, 28 in 1993, and 30 in 1998.
  • “Free agency” began officially in 1976, just before the third wave of expansion, Free agency enables a player with six or more years of major-league experience to sign with a team of his choice, following the expiration of his current contract or his current team’s failure to exercise a contract-extension option.

Given that, what can one glean from the two charts above? One obvious fact (obvious to me, anyway) is that the AL has become more competitive since the onset of expansion and free agency. (By “competitive” I mean that the teams’ W-L records have become more tightly bunched around .500.) The following graph confirms that observation. (To enlarge the image, right-click on it and select “open in a new tab.”)

Source: Statistics derived from information available at Baseball-Reference.com.

This graph plots, for each season from 1901 through 2007, the average absolute value of the deviation of team W-L records from the league’s overall record. For example, a W-L record of .400 and a W-L record of .600 both deviate by .100 from a league W-L record of .500. (The AL”s overall record was, of necessity, .500 in each year through 1996, when there was no interleague play during the regular season. Since the advent of interleague play after 1996, the overall W-L record of the AL has ranged from a low of .495 in 1997 to a high of .512 in 2006.)

It seems indisputable that baseball, represented here by the AL, has become more competitive since the advent of expansion and the establishment of free agency. (The “blip” around 2002 seems to be an anomaly caused by the confluence of several unusually abysmal and outstanding seasons.)

Why? I suggest the following:

  • Expansion has not “diluted” the quality of baseball, for two reasons. First, the U.S. population of males aged 20-44 has more than tripled since 1901, while the number of teams in the two major leagues (30) is still less than double the number that existed in 1901 (16). Moreover, given the additional competition for talent since expansion, teams have become more willing to recruit players from among the black and Hispanic populations of the U.S. and Latin America. That is to say, teams have come to draw more heavily on sources of talent that they had (to a large extent) neglected before expansion. (True, it takes time for a new franchise to become competitive, but — with the possible exception of the Devil Rays — new franchises have become competitive, for a while, at least.)
  • Free agency has made baseball more competitive by enabling less successful teams to attract high-quality players by offering them more money than other, more successful, teams. Money can, in some (many?) cases, compensate a player for the loss of psychic satisfaction of playing on a team that, on its record, is likely to be successful.
  • The competitive ramifications of expansion and free agency have been reinforced by the limited size of team rosters (e.g., each team may carry only 25 players until September 1). No matter how much money an owner has, the limit on the size of his team’s roster constrains his ability to sign all (even a small fraction) of the best players.

In a future post I will discuss the records of certain teams — the Athletics and their wild swings between excellence and dysfunction, for example.

Now, It’s Over

The Red Sox have clinched the AL East title, thanks largely to another blown save by the Yankees’ Mariano Rivera in tonight’s 9-10, 10-inning loss to the Orioles.

It was over, effectively, when the Yankees failed to hold a 5-1 lead against the Devil Rays, and lost 6-7 in 10 innings on September 25. That loss put the Yankees 3 games behind the Red Sox, with only 5 games to play.

Contrary to the mindless mathematical manipulations of a blogger who shall remain nameless here, it was not over following the games of July 4, when the Yankees trailed the Red Sox by 11.5 games (not 12 games as asserted by said blogger).

But the Yankees rallied to come within 1.5 games of the Red Sox on September 19 and again on September 24. Which just goes to show you: “It ain’t over ’til it’s over.” *

Now, it’s over.

Related posts:
Overcoming Adversity
Are the Yankees in Meltdown?
Yankees vs. Red Sox: The End Games
Yankees vs. Red Sox: The End Games (2)
As I Was Saying…
__________
* Said byYogi Berra in 1973 when his New York Mets were, on August 7, 9.5 games behind the leader of the NL Eastern division. The Mets rallied to win the division title by 1.5 games, and went on to take the NL title before losing the World Series to the Oakland A’s. The Mets took the A’s to the seventh game of the Series. It was over for the Mets only when they lost that seventh game.

The 2007 Mets, by contrast, led their division from May 16 through September 26. As of this morning, the Mets trail the Phillies by 1 game, with 2 games left to play. To wrest the division title from the Phillies, the Mets must win both of their final games while the Phillies lose both of theirs. There will be a one-game playoff if the teams finish in a tie.

Moreover, even if the Mets win both of their final games they can be eliminated from post-season play, as follows. First, the Phillies win both of their final games to take the NL East title outright. Then, both the Diamondbacks and Padres win at least one of their two final games, which gives the wild-card slot to the Padres.

The best the Mets can do is tie the Padres and/or the Rockies in the W-L department. (That outcome requires the Padres to lose both of their final games.) The Mets and Padres and/or Rockies would then have a playoff game (or games) to determine the NL’s wild-card team for 2007.

It’s almost over for the Mets. But it ain’t over ’til it’s over — ain’t it?

P.S. (09/30/07): Now, it’s over for the Mets. Amazing.

On the morning of September 13 the Mets had a .572 record and led the Phillies by 7 games with only 17 games remaining. A mindless prognosticator might then have opined that the Mets would have to play only .500 ball the rest of the season in order to win the NL East title — as if that would be a cinch.

Well, the Mets could have won the title by playing .412 ball the rest of the way, even had they lost their 3 remaining games with the Phillies (as the Mets did). But the Mets played only .294 ball the rest of the way. In the process, their 7-game lead became a 1-game deficit, as the Phillies won 13 of 17 while the Mets were dropping 12 of 17. Thus the Mets fell 2 games short of taking the NL East title outright, and 1 game short of entering a playoff (with the Padres and Rockies) for the NL wild-card slot.

C’est la vie en baseball.

As I Was Saying…

here, “past performance is no indication of future returns,” especially when it comes to this year’s Yankees.

I have been all over the lot on the fate of the 2007 Yankees (here, here, here, and here). I should follow my own advice and quit trying to make predictions, even if they are informed ones and not mindless arithmetic games.

I had effectively written the Yankees off for failing to sweep their recent series with the Red Sox, which left the Yankees 4.5 games in arrears. But three days later, the Yankees are only 1.5 games behind the Red Sox.

What happens now? I dunno. I hereby swear that I will not make another prediction about baseball — until I make another one.

Testing for Steroids

UPDATED TO INCLUDE FINAL STATS FOR 2007 REGULAR SEASON

Here are the top eleven home-run hitters in the history of major league baseball,* based on home runs as a percentage of times at bat over the course of a career:

Mark McGwire

9.42%

Babe Ruth

8.50%

Barry Bonds

7.74%

Jim Thome

7.41%

Ralph Kiner

7.09%

Alex Rodriguez

7.05%

Harmon Killebrew

7.03%

Manny Ramirez

6.94%

Sammy Sosa

6.91%

Ted Williams

6.76%

Ken Griffey Jr.

6.72%

The list includes six active players (Bonds, Thome, Rodriguez, Ramirez, Sosa, Griffey) and one retired player (McGwire) who was a contemporary of the active players. Here are the stats for those seven players, by season:

Note McGwire’s “explosion” from 1995 through 2000, and Bonds’s me-too binge from 1999 through 2004. Were McGwire and Bonds — who were born less than a year apart — simply “peaking” in those years? I don’t think so.

Here’s why I don’t think so, namely, the stats for the same seven players, by age:

So, we have five sluggers (Sosa, Rodriguez, Thome, Ramirez, Griffey) who seem to have aged more or less normally (allowing for injuries). Then, we have the “big two” (McGwire and Bonds) whose late-career “accomplishments” stand out from the rest.

Perhaps the “big two” really aren’t that unusual. How do they compare with the older members of the top-eleven club, for instance? Here’s how:

As the late Phil Rizzuto would say, “Holy cow, would you look at that!” Or, as Detective Delvecchio (of Barney Miller) used to say, “What an amazing coincidence!” Two guys who “peaked” late, one right after the other.
__________
*Source and notes: All statistics are derived from Baseball-Reference.com and are current through the end of the 2007 regular season. I have excluded two active players — Adam Dunn (career, 7.04%) and Albert Pujols (career, 6.96%) — who are less than 30 years of age and have compiled far fewer at-bats than the players whose records I analyze here.

Yankees vs. Red Sox: The End Games (2)

UPDATED, BELOW


The Red Sox remaining games at home through the end of the season

Devil Rays — 2 games — home vs. Devil Rays: 5-2 to date
Yankees — 3 games — home vs. Yankees: 4-2
Athletics — 2 games — home vs. Athletics: 1-1
Twins — 4 games — home vs. Twins: 0-0

The Red Sox away

Blue Jays — 3 games — away vs. Blue Jays: 5-1
Devil Rays — 3 games — away vs. Devil Rays: 4-2

The Yankees at home

Orioles — 3 games — home vs. Orioles: 2-4
Blue Jays — 4 games — home vs. Blue Jays: 3-2

The Yankees away

Blue Jays — 3 games — away vs. Blue Jays: 3-3
Red Sox — 3 games — away vs. Red Sox: 2-4
Devil Rays — 3 games — away vs. Devil Rays: 3-3
Orioles — 3 games — away vs. Orioles: 2-4

Combined home and away records against remaining opponents

Red Sox: 19-8
Yankees: 15-20

Current standings

Red Sox lead Yankees by 5 games (The Yankees’ deficit is the same as it was after the games of August 30. That’s zero progress by the Yankees in a span of 11 days. Plus, the remaining schedule is more favorable to the Red Sox now than it was 11 days ago.)

Conclusion

Draw your own, bearing in mind that “past performance is no guarantee of future results.”

Here’s mine:

  • The three-game series between New York and Boston (in Boston) this coming weekend (Sept. 14-16) will be decisive.
  • If the Yankees trail the Red Sox by 5 games or less when the two teams meet, the Yankees will win the American League East title if (and only if) they sweep the Red Sox.
  • Conversely, no matter where the Sox and Yankees stand entering the series, the Sox will take the title if they beat the Yankees at least twice.

UPDATE (09/14/07, 11:30 a.m. CT): The Yankees trail the Red Sox by 5.5 games going into their three-game series. So, the Yankees still have a shot at the AL East title, but only if they sweep the Red Sox.

Yankees vs. Red Sox: The End Games

The Red Sox remaining games at home through the end of the season

Orioles — 3 games — home record vs. Orioles this season: W4-L2
Blue Jays — 3 games — home vs. Blue Jays: 2-4
Devil Rays — 3 games — home vs. Devil Rays: 5-1
Yankees — 3 games — home vs. Yankees: 4-2
Athletics — 2 games — home vs. Athletics: 1-1
Twins — 4 games — home vs. Twins: no games

The Red Sox away

Orioles — 4 games — away vs. Orioles: 3-2
Blue Jays — 3 games — away vs. Blue Jays: 5-1
Devil Rays — 3 games — away vs. Devil Rays: 4-2

The Yankees at home

Devil Rays — 3 games — home vs. Devil Rays: 4-2
Mariners — 3 games — home vs. Mariners: 2-2
Orioles — 3 games — home vs. Orioles: 2-4
Blue Jays — 4 games — home vs. Blue Jays: 3-2

The Yankees away

Royals — 3 games — away vs. Royals: 3-1
Blue Jays — 3 games — away vs. Blue Jays: 3-3
Red Sox — 3 games — away vs. Red Sox: 2-4
Devil Rays — games — away vs. Devil Rays: 3-3
Orioles — 3 games — away vs. Orioles: 2-4

Combined home and away records against remaining opponents

Red Sox: 28-15
Yankees: 24-25

Current standings

Red Sox lead Yankees by 5 games

Conclusion

Draw your own, bearing in mind that “past performance is no guarantee of future results.”

Are the Yankees in Meltdown?

UPDATED, BELOW

The New York Yankees lost to the Detroit Tigers yesterday by a score of 0-16. The loss left the Yankees 8 games behind the Boston Red Sox with 31 games remaining. It looks bad for the Yankees. But — although “past performance is no indication of future returns,” as they say in the mutual-fund business — let’s look at the Yankees’ regular-season record for the 12 seasons of Joe Torre’s managership. The first half of each entry describes the Yankees’ record after 131 games; the second half describes the Yankees’ record at the end of the regular season.

1996 — 74-57 (.565),4 games ahead of Baltimore; 92-60 (.568), 4 games ahead of Baltimore

1997 — 78-53 (.595), 7 games behind Baltimore; 96-66 (.593), 2 games behind Baltimore

1998 — 95-36 (.725), 16.5 games ahead of Boston; 114-48 (.704), 22 games ahead of Boston

1999 — 81-50 (.618), 7.5 games ahead of Boston; 98-64 (.605), 4 games ahead of Boston

2000 — 75-56 (.573), 5 games ahead of Boston; 87-74 (.540), 2.5 games ahead of Boston

2001 — 76-55 (.580), 4 games ahead of Boston; 95-65 (.593), 13.5 games ahead of Boston

2002 — 83-48 (.634), 9 games ahead of Boston; 103-58 (.640), 10.5 games ahead of Boston

2003 — 80-51 (.611), 4 games ahead of Boston; 101-61 (.623), 6 games ahead of Boston

2004 — 81-50 (.618), 3.5 games ahead of Boston; 101-61 (.623), 3 games ahead of Boston

2005 — 75-57 (.568), 2.5 games behind Boston; 95-67 (.586), same record as Boston (New York awarded division championship for winning season series against Boston)

2006 — 78-53 (.595), 8 games ahead of Boston; 97-65 (.599), 10 games ahead of Toronto (Boston finished third, 11 games behind New York)

2007 — 72-59 (.550), 8 games behind Boston; ???

In sum, the Yankees of 2007 not only are not the Yankees of Torre’s past, but the Yankees of Torre’s past also had little come-from-behind experience this late in the season. I now believe that the Yankees might not win the American League East championship. I come to that tentative view by considering the Yankees’ performance — in this season and recent seasons — not by playing mindless “what if” arithmetic games. (For more on that, see this.)

UPDATE (08/30/07): Well, maybe the Yankees aren’t in meltdown. They just swept three games from the Red Sox and are now “only” five games back, with 28 games left in the regular season. The Yankees-Red Sox three-game series (September 14-16) at Fenway Park could be decisive — if the Yanks don’t slip badly between now and then.

Overcoming Adversity

UPDATED (BELOW), 07/08/07, 07/09/07, 07/12/07, 07/25/07, 08/28/07

Keith Burgess-Jackson proclaims that it’s over for the New York Yankees. He buttresses his conviction (wish, really) by constructing four “suppositions,” based on the state of play through July 4:

1. Boston plays .500 ball the rest of the way. The Yankees will have to go 53-28 (.654) to tie. Projected over a season, that’s 106 victories.

2. Boston plays .550 ball the rest of the way. The Yankees will have to go 56-25 (.691) to tie. Projected over a season, that’s 112 victories.

3. Boston plays .600 ball the rest of the way. The Yankees will have to go 60-21 (.740) to tie. Projected over a season, that’s 120 victories.

4. Boston plays .626 ball the rest of the way. The Yankees will have to go 62-19 (.765) to tie. Projected over a season, that’s 124 victories.

I have two comments:

  • The outcome of a pennant race cannot be foreshadowed by constructing hypothetical outcomes. Strange and wondrous (or devastating) events can (and do) intervene.
  • Keith’s “suppositions” are therefore irrelevant. Keith’s (negative) hopes for the Yankees aside, it is quite possible for the Bronx Bombers to improve their record vastly, and for the perennial fold-up team from Boston to fold once more.

Cases in point (found here):

1914 Boston Braves — 15 games out on July 6 with a 26-40 won-lost record — went 68-19 [.782] in the final 87 games of the season to win the N.L. pennant by 10 games over the New York Giants.

1930 St. Louis Cardinals — 12 games behind on August 9 with a 53-52 record — won 39 of their final 49 games [.796] to win the N.L. pennant by two games over the Cubs.

1935 Chicago Cubs — 10 and a half games behind the Giants on July 5 with a 38-32 record — won 62 of their final 84 games [.738] , including a 21-game winning streak from September 4 through September 27, to win the N.L. pennant by four games over St. Louis and eight and a half ahead of the Giants.

1936 New York Giants — in fifth-place in the N.L. with a 42-41 won-lost record (10 and a half games behind the Cubs) — went 50-21 [.704] to capture the NL. pennant by five games over the Cubs, who went 36-38 [.486] in their final 74 games.

1942 St. Louis Cardinals — 10 games behind on August 5 with a 62-39 mark — won 44 of their last 53 games [.830] to overtake the Dodgers and win the N.L. pennant by two games.

1951 New York Giants — behind the Dodgers by 13 games on August 12 with a 59-51 record — went 37-8 [.822] while Brooklyn went 27-24 [.529] over the rest of the season (including the three-game playoff won by the Giants on Bobby Thomson’s historic home run).

1964 St. Louis Cardinals — 11 games behind the Phillies on August 24 with a 65-58 record — but the Phillies went 16-23 [.410] in the final 39 games while the Cardinals went 28-11 [.718] and took the N.L pennant.

1969 New York Mets — 10 games behind the Chicago Cubs on August 14 with a 62-51 won-lost mark — ended the season with a 38-11 run [.776] as the Cubs went 18-27 [.400]. The Mets won the N.L. East division by eight games.

1973 New York Mets — 11 and a half games behind the Cardinals in the N.L. East division on August 5 with a 48-60 won-lost mark — finished with a 34-19 record [.642] in the final 53 games while the Cardinals went 20-31 [.392] during the same span.

1973 Cincinnati Reds — 11-games behind the Dodgers on July 1 with a 39-37 record — finished 60-26 [.698] while Los Angeles went 44-39 [.537] over the same stretch and lost the N.L. West division to the Reds by three and a half games.

1978 New York Yankees — trailing by 14 games in the A.L. East division on July 20 with a 48-42 record — won 52 of their remaining 73 games [.712] (including a one-game playoff over the Red Sox) to win the AL. East.

1989 Toronto Blue Jays — in sixth-place in a seven-team A.L. East division with a 38-45 won-lost record — went 51-28 [.646] in the final 12 weeks of the season to win the division by two games over the Orioles.

1993 Atlanta Braves — 10 games behind on July 23 with a 55-42 record — finished 49-16 [.754] to win the N.L. West division over the Giants by one game.

1995 Seattle Mariners — 13 games behind the California Angels on August 3 with a 44-46 record — went 35-20 [.636] to win the A.L. West title, while the Angels finished 22-33 [.400].

“It ain’t over ’til it’s over.” *

UPDATE (07/08/07): Since Keith posted his proclamation, the Red Sox have gone 1-3 (.250) while the Yankees have gone 3-1 (.750). Four games do not a season decide, but the assertion that the Red Sox cannot fold and the Yankees cannot surpass them borders on hubris.

UPDATE (07/09/07): Keith asks: “Where did I say that the New York Yankees ‘cannot’ overtake the Boston Red Sox?” Answer: Here, where he says: “I have two words for fans of the New York Yankees: It’s over.” The implication of that statement is clear: The Yankees will not overtake the Red Sox because the Yankees cannot do so. (If the Yankees could, they would, unless they are taking a dive this year. I assume that even as rabid a Yankees-hater as Keith doesn’t believe that.) I So is it “over” or is it just “improbable” that the Yankees will fail to win the A.L. East Division title this year (as Keith now says)? Keith wants to bet me $1,000 on the outcome. If I didn’t have eight grandchildren to think of, I’d take his bet.

UPDATE (07/12/07): Keith continues to play with numbers, proving nothing other than his ability to do arithmetic. On August 31 of last year, for example, he held out hope that the Tigers would hold on to win the 2006 A.L. Central crown:

Chicago is 78-55 and Minnesota 77-55. If the Tigers split their remaining 28 games, they’ll finish 97-65. The White Sox will have to go 19-10 to tie them. The Twins will have to go 20-10 to tie.

In the comment thread, Keith added:

For the Twins or White Sox to catch the Tigers, the Tigers, who have had the best record in Major League Baseball all season, will have to continue playing terrible baseball. How likely is that? I predict that the Tigers will win the division by at least six games.

Well, as it turned out, the Tigers did continue to play something like “terrible” baseball (12-16, .428). As a result, the Twins didn’t have to play 20-10 to tie the Tigers. Instead, the Twins were able finish one game ahead of the Tigers by going 19-11. So much for the Tigers’ six-game margin of victory.

UPDATE (07/25/07): Since July 4 the Red Sox have gone 9-9 (.500) while the Yankees have gone 15-4 (.789). The Yankees have, in just three weeks, gained 5.5 games on the Sox. I find no portent in such results, just as I found no portent in the results through July 4. What a difference a few weeks can make — as KBJ should have learned in 2006.

UPDATE (08/28/07): See this.
__________
* Said byYogi Berra in 1973 when his New York Mets were still nine and a half games behind the division leader.

I’m a Sponsor

I now sponsor Jim Gosger’s stats page at Baseball-Reference.com. Jim lived a few houses down the street from me when we were young boys, though he was too much younger than I (by two years) to be a playmate. That “little kid” went on to do what I could only dream of doing — he had a career in the major leagues. Cheers, Jim.

Pennant Winner vs. Best Team

UPDATED, 10/16/07 and 10/28/07

With the ascension of the wild-card Detroit Tigers and mediocre St. Louis Cardinals (83-78 WL record) to their respective league championships in 2006, and with the triumph of the wild-card Colorado Rockies in 2007, it’s time to take stock of divisional play and the wild-card designation. Since the advent of divisional play in 1969, and especially with the introduction of wild-card teams in 1995, league championships often have not been won by the best team. Here’s the whole story:

From 1901 (the American League’s first year) through 2006 each league has had 106 champions (with the outcome of this year’s AL race still pending). (There were no champions in 1994, when the baseball season ended early because of a players’ strike.) From 1901 through 1968 each league’s champion was the team with the best regular-season record; there were postseason playoffs only when two teams tied for the league’s best record.

From 1969 onward the leagues have been split into divisions, and league championships have been determined by postseason play. League championships were determined in one round of postseason play from 1969 through 1993, when there were only two divisions in each league. (There was an exception in 1981, when a midseason strike led to the declaration of “first half” and “second half” winners in each leagues’ two divisions. That necessitated an extra round of postseason play to determine overall division champions.)

From 1995, the first year of postseason play after each league was split into three divisions, it has taken two rounds of postseason play to determine a league’s champion. The extra round accommodates the addition of a third division champion and a “wild card” team — the second-place team with the best record among the three second-place teams in a league.

Twenty-one times in the 39 seasons of regular postseason play (1969-2007, less 1994), the National League pennant has been won by a team that did not have the best regular-season record. The same thing has happened 16 times in the American League, through 2006. It is because of such results that I have expressed (elsewhere) my disdain of postseason play as an indicator of excellence.

The following tables summarize the results for each team. The first pair of tables gives the number of times, beginning with 1901, that each team has led its league in championships and had the best record. The second pair indicates the years in which a team won its championships and whether or not it also had the league’s best record in those years. (Franchises that have been located in more than one place (e.g., the Los Angeles Dodgers) are identified by their current location.)

NATIONAL LEAGUE – CHAMPIONSHIPS/BEST RECORD/NUMBER OF SEASONS (FIRST SEASON*) – 1901-2007

Arizona: 1/1/10 (1998)
Atlanta: 9/13/107
Chicago: 10/12/107
Cincinnati: 9/9/107
Colorado: 1/0/15 (1993)
Florida: 2/0/15 (1993)
Houston: 1/2**/46 (1962)
Los Angeles: 18/16/107
Milwaukee: 0/0/10 (1998)
New York: 4/4/46 (1962)
Philadelphia: 5/3/107
Pittsburgh: 9/12/107
San Diego: 2/0/39 (1969)
San Francisco: 18/17/107
St. Louis: 17/18**/107
Washington: 0/1***/39 (1969)
__________
* If not in the league in 1901.
** Houston and St. Louis tied for best record in 2001.
*** Montreal (now Washington) had the best record in the strike-shortened 1994 season.

AMERICAN LEAGUE – CHAMPIONSHIPS/BEST RECORD/NUMBER OF SEASONS (FIRST SEASON*) – 1901-2007

Baltimore: 7/9/107
Boston: 12/10****/107
Chicago: 6/8/107
Cleveland: 5/6****/107
Detroit: 10/10/107
Kansas City: 2/1/39 (1969)
Los Angeles: 1/0/47 (1961)
Milwaukee (as AL team): 1/1/30 (1969-97)
Minnesota: 6/5/107
New York: 39/39***/107
Oakland: 15/16**/107
Seattle: 0/1/31 (1977)
Tampa Bay: 0/0/10 (1998)
Texas: 0/0/47 (1961)
Toronto: 2/3**/31 (1977)
__________
* If not in the league in 1901.
** Oakland and Toronto tied for best record in 1992.
*** New York had the best record in the strike-shortened 1994 season.
**** Boston and Cleveland tied for best record in 2007.

NATIONAL LEAGUE – YEARS IN WHICH EACH TEAM WON THE CHAMPIONSHIP

Arizona Diamondbacks* (1 league championship)
2001 (best record: Houston and St. Louis tied)

Atlanta Braves (formerly Milwaukee Braves and Boston Braves) (9)

1914, 1948, 1957, 1958, 1991 (best record: Pittsburgh), 1992, 1995, 1996, 1999

Chicago Cubs (10)
1906, 1907, 1908, 1910, 1918, 1929, 1932, 1935, 1938, 1945

Cincinnati Reds (9)

1919, 1939, 1940, 1961, 1970, 1972 (best record: Pittsburgh), 1975, 1976, 1990 (best record: Pittsburgh)

Colorado Rockies* (1)
2007 (best record: Arizona)

Florida Marlins* (2)
1997 (best record: Atlanta), 2003 (best record: Atlanta)

Houston Astros (also Houston Colt 45s)* (1)
2005 (best record: St. Louis)

Los Angeles Dodgers (formerly Brooklyn Dodgers, Brooklyn Robins, and Brooklyn Superbas) (18)
1916, 1920, 1941, 1947, 1949, 1952, 1953, 1955, 1956, 1959, 1963, 1965, 1966, 1974, 1977 (best record: Philadelphia), 1978, 1981 (best record: Cincinnati), 1988 (best record: New York)

Milwaukee Brewers* (0) (see also AL listing)

New York Mets* (4)
1969, 1973 (best record: Cincinnati), 1986, 2000 (best record: San Francisco)

Philadelphia Phillies (5)
1915, 1950, 1980 (best record: Houston, 1983 (best record: Los Angeles), 1993 (best record: Atlanta)

Pittsburgh Pirates (9)
1901, 1902, 1903, 1909, 1925, 1927, 1960, 1971, 1979

San Diego Padres* (2)
1984 (best record: Chicago), 1998 (best record: Atlanta)

San Francisco Giants (formerly New York Giants) (18)
1904, 1905, 1911, 1912, 1913, 1917, 1921, 1922, 1923, 1924, 1933, 1936, 1937, 1951, 1954, 1962, 1989 (best record: Chicago), 2002 (best record: Atlanta)

St. Louis Cardinals (17)
1926, 1928, 1930, 1931, 1934, 1942, 1943, 1944, 1946, 1964, 1967, 1968, 1982, 1985, 1987, 2004, 2006 (best record: New York)

Washington Nationals (formerly Montreal Expos)* (0)

AMERICAN LEAGUE – YEARS IN WHICH EACH TEAM WON THE CHAMPIONSHIP

Baltimore Orioles (formerly St. Louis Browns and original Milwaukee Brewers) (7)
1944, 1966, 1969, 1970, 1971, 1979, 1983 (best record: Chicago)

Boston Red Sox (12)
1903, 1904, 1912, 1915, 1916, 1918, 1946, 1967, 1975 (best record: Oakland), 1986, 2004 (best record: New York), 2007 (best record: tied with Cleveland)

Chicago White Sox (6)
1901, 1906, 1917, 1919, 1959, 2005

Cleveland Indians (also Cleveland Naps, Cleveland Bronchos, and Cleveland Blues) (5)
1920, 1948, 1954, 1995, 1997 (best record: Baltimore)

Detroit Tigers (10)

1907, 1908, 1909, 1934, 1935, 1940, 1945, 1968, 1984, 2006 (best record: New York)

Kansas City Royals* (2)

1980 (best record: New York), 1985 (best record: Toronto)

Los Angeles Angels of Anaheim (formerly Anaheim Angels, California Angels, and Los Angeles Angels) * (1)

2002 (best record: New York)

Milwaukee Brewers (now NL; formerly Milwaukee Brewers (AL) and Seattle Pilots (AL))* (1)
1982

Minnesota Twins (formerly the original Washington Senators) (6)
1924, 1925, 1933, 1965, 1987 (best record: Detroit), 1991

New York Yankees (formerly New York Highlanders and original Baltimore Orioles) (39)
1921, 1922, 1923, 1926, 1927, 1928, 1932, 1936, 1937, 1938, 1939, 1941, 1942, 1943, 1947, 1949, 1950, 1951, 1952, 1953, 1955, 1956, 1957, 1958, 1960, 1961, 1962, 1963, 1964, 1976, 1977 (best record: Kansas City), 1978, 1981 (best record: Oakland), 1996 (best record: Cleveland), 1998, 1999, 2000 (best record: Chicago), 2001 (best record: Seattle), 2003

Oakland Athletics (formerly Kansas City Athletics and Philadelphia Athletics) (15)
1902, 1905, 1910, 1911, 1913, 1914, 1929, 1930, 1931, 1972, 1973 (best record: Baltimore), 1974 (best record: Baltimore), 1988, 1989, 1990

Seattle Mariners* (0)

Tampa Bay Devil Rays* (0)

Texas Rangers (formerly expansion Washington Senators)* (0)

Toronto Blue Jays* (2)
1992 (best record: tied with Oakland), 1993

The Meaning of the World Series

UPDATED, 10/28/07

The World Series doesn’t decide the best team in baseball.

The World Series — like the playoffs that precede it — is nothing more than a expanded regular-season series. Teams play dozens of regular-season series in order to qualify for postseason play. If it takes dozens of such series to determine which teams are qualified for postseason play (i.e., the “best” teams), how can the World Series and the playoffs that precede it determine the “very best” of the “best”? Logically, the teams involved in postseason series would have to play each other many, many times before one of them could claim to be the “very best.”

The meaninglessness of postseason play is demonstrated by the inclusion of wild-card teams. After 162 regular-season games, a team that has finished second in its division suddenly has a chance to “prove” that it is really baseball’s best team. That is, it is allowed to “prove” in three brief rounds of postseason play what it failed to prove in 162 games. The result: wild-card teams have won four of the thirteen World Series played since their inclusion in postseason play.

Over that span (1995-2007), the World Series has been won eight times by a team with a worse regular-season record than that of its opponent. Moreover, 37 of the 78 postseason series between teams in the same league — the Division Championship Series and League Championship Series — have been won by the team with a worse regular-season record than that of its opponent. Luck, not skill, seems to have a strong hand in determining the outcome of postseason play.

Postseason play is — above all else — a way of filling seats, selling concessions, and selling broadcast rights. It delivers often-exciting games between baseball’s better teams. A series that goes down to the wire and is filled with exciting games is a baseball fan’s delight. But none of that has anything to do with deciding which of baseball’s teams is the best.

Can Money Buy Excellence in Baseball?

My measure of excellence is the fraction of games won during a regular season.

It is true that every owner, manager, coach, and player would like to win the World Series — and that some owners (especially George Steinbrenner) spend a lot of money toward that end. But the short series at season’s end — League Division Series, League Championship Series, and World Series — prove nothing about which team is better or best. It takes a lot of games to determine a team’s quality, which is why the regular season consists of 162 games.

The significance of post-season play has changed since the first World Series was played in 1903. The main impetus for starting the World Series was a desire to determine which of two league champions — who had not faced each other during the regular season — was the better team, insofar as “better” could be determined by a best-of-nine or best-of-seven series. With the advent of divisions within the two major leagues, and interleague play during the regular season, postseason play has evolved to a series of contests between teams that have faced each other during the regular season. The main impetus for the present playoff format is a desire to fill seats and to sell food, drink, memorabilia, and television rights.

Divisional play and wild-card slots make it possible for less-than-excellent teams to participate in post-season play. Short series make it possible for such teams to garner championships in post-season play. Who believes that Oakland A’s really are better than the Minnesota Twins — even though the A’s swept the Twins in their recent series — when the Twins (with a regular-season winning average of .593) beat the A’s (.574) in six of their ten regular-season games? Who believes that the Detroit Tigers really are a better team than the New York Yankees — even though the Tigers have eliminated the Yankees from postseason play — when the Yankees (.599 in the regular season) beat the Tigers (.586) in five of their seven regular-season games? I dismiss post-season play as an indicator of excellence.

With that out of the way, let’s look at fraction of games won as a function of payroll for the 1998, 2000, 2002, 2004, and 2006 seasons. Fraction of games won is available at Baseball-Reference.com; click on “Leagues” and then, for a particular year, click on the adjacent link (“NL” or “AL”) to get that league’s final, regular-season standings for that year. I obtained team payrolls for 1998, 2000, 2002, and 2004 from this spreadsheet. (Specifically, I used the totals for early April, given in the right-most column.) I used these early April payrolls for 2006. The use of payrolls for the same point in each season imparts some consistency to the analysis, even though payrolls change throughout a season because of trades, waiver claims, callups, and releases.

The following six graphs depict my statistical analysis of the data. The first five graphs treat each of the seasons individually. In the sixth graph I combine all five seasons by constructing, for each season, a payroll index for each team, setting the lowest payroll for that season equal to 1. The red plot points in all six graphs are for the Yankees; the black plot points and the least-squares fits through them are for the other 29 teams.

Several things jump out from these graphs and the underlying data:

Money can — and often does — buy excellence, but the correlation between payroll and excellence declined after 1998. This suggests that bidders for free agents have, in general, become less discriminating about the quality of those players and how much their particular skills will add to the overall performance of the acquiring teams.

The wide dispersion of points around the regression lines indicates the uncertainty involved in selecting players. There are a few teams that have been, for a time, consistently good at it (e.g., the A’s, Braves, Cards, Giants, Mets, Twins, and Yankees) and a few that have been, for a time, consistently bad at it (e.g., Cubs, Devil Rays, Marlins, and Phillies). The Yankees have gone from very good to mediocre, in terms of getting value for their payroll dollars.

The Yankees of 1998 were a “steal,” even though the team had the second-highest payroll for that season. The Yankees have since regressed to the mean, as George Steinbrenner has paid dearly to keep certain of his stars (e.g., Derek Jeter and Jorge Posada) and to acquire big-name players (e.g., Roger Clemens and Alex Rodriguez), not all of whom have delivered their money’s worth. (Yes, A-Rod, that means you.)

Nevertheless, Steinbrenner has been getting his money’s worth — in that his teams have done very well during the regular season. That’s not enough for Steinbrenner, of course, because he spends a lot of money on player salaries in order to win World Series. Six straight years of postseason futility should by now have told Steinbrenner that his main problem isn’t with the talent that he puts on the field but with Joe Torre’s inability to manage that talent effectively in postseason play.

How so? A short series involving teams with good pitchers generally is won by the team that is adept at putting a few runs on the board early by playing “small ball.” That puts the opposing team off stride and forces it to make high-risk moves in an effort to play catch-up ball. Torre’s prevalent management style — which works well over the long haul of a seaon — is not to play “small ball” but to lay back and wait for his big bats to produce runs in bunches. That strategy doesn’t work well in the postseason, when you’re up against baseball’s better teams, because those teams usually have strong pitching staffs.

And so, given another postseason disappointment for the Yankees, I fully expect Mr. Steinbrenner to replace Joe Torre — in addition to doing something about A-Rod, the Yankee bullpen, and half the starting rotation. Torre’s successor should be adept at “small ball,” and should make the Yankees practice it throughout the regular season so that they have mastered it by the time postseason play rolls around in 2007.

The Anti-Hall of Fame and Baseball "Immortals"

Baseball’s Hall of Fame is cluttered with pitchers and batters who plainly do not belong there. I hereby present my Anti-Hall of Fame: players who do not belong in the Hall of Fame.

A Hall of Fame pitcher will have

  • at least 300 wins
  • or, at least 250 wins and an ERA+ of 120 or higher. (Go here and scroll down for the definition of ERA+.)
  • or, at least 200 wins and a W-L average of .600 or better and an ERA+ of 120 or higher.
  • or, for relief pitchers, an ERA+ of 120 or higher.

The following pitchers therefore belong in my Anti-Hall of Fame:

Chief Bender
Jim Bunning
Jack Chesbro
Dizzy Dean
Don Drysdale
Dennis Eckersley
Red Faber
Rollie Fingers
Pud Galvin
Lefty Gomez
Burleigh Grimes
Jesse Haines
Waite Hoyt
Catfish Hunter
Fergie Jenkins
Addie Joss
Sandy Koufax
Bob Lemon
Ted Lyons
Rube Marquard
Hal Newhouser
Satchel Paige
Herb Pennock
Eppa Rixey
Robin Roberts
Red Ruffing
Dazzy Vance
Rube Waddell
Ed Walsh
John Ward
Vic Willis

With the removal of those 31 names, 35 pitchers would remain in the Hall of Fame.

The selection of batters for my Anti-Hall of Fame is a somewhat trickier business. Consider Johnny Bench: a lifetime .267 hitter but a great catcher and a leader on the field. Should I place a Bench in my Anti-Hall of Fame? What about Luis Aparicio, a fine shortstop who stole a lot of bases relative to his peers? The list could go on and on. So I decided to construct an anti-Hall of Fame that applies only to batting. Some players in this Anti-Hall of Fame might belong in the Hall of Fame for their other exploits, but they do not belong there for their batting skills. My batting criteria:

  • an OPS+ of at least 150 (Go here and scroll down for the definition of OPS+, which is a measure of offensive prowess that adjusts for a player’s ballpark and the era in which he played.)
  • or, at least 2,800 lifetime hits and a lifetime batting average of at least .300
  • or, an OPS+ of at least 120 and at least 2,000 lifetime base hits or a lifetime batting average of at least .300

My Anti-Hall of Fame for batters:

Luis Aparicio
Luke Appling
Richie Ashburn
Earl Averill
Frank Baker
Dave Bancroft
Lou Boudreau
Lou Brock
Willard Brown
Roy Campanella
Max Carey
Gary Carter
Frank Chance
Jimmy Collins
Joe Cronin
Larry Doby
Bobby Doerr
Johnny Evers
Carlton Fisk
Nellie Fox
Gabbby Hartnett
Billy Herman
Harry Hooper
Monte Irvin
Travis Jackson
Hughie Jennings
George Kell
George Kelly
Ralph Kiner
Tony Lazzeri
Freddie Lindstrom
Rabbit Maranville
Bill Mazeroski
Tommy McCarthy
Bid McPhee
PeeWee Reese
Phil Rizzuto
Brooks Robinson
Ryne Sandberg
Ray Schalk
Red Schoendienst
Joe Sewell
Ozzie Smith
Joe Tinker
Pie Traynor
Bobby Wallace
Lloyd Waner
John Ward
Ross Youngs
Robin Yount

The deletion of those 50 names would leave 91 batters in the Hall of Fame, including . . . Johnny Bench.

You can consult the Hall of Fame listings for pitchers and batters to see who would remain in my Hall of Fame after excluding those listed above.

But which of the 35 pitchers and 91 batters who qualify for my Hall of Fame are true baseball “immortals” who belong in a select inner circle? My criteria for “immortality” are somewhat more stringent than my criteria for membership in the Hall of Fame. An “immortal” pitcher will have at least 250 wins, a winning average of at least .600, and an ERA+ of at least 120. (A reliever qualifies with an ERA+ of at least 120.) An “immortal” batter will have an OPS+ of at least 150 or at least 2,800 hits and a lifetime batting average of at least .300.

Herewith the “immortal” pitchers:

Pete Alexander
John Clarkson
Bob Feller
Lefty Grove
Carl Hubbell
Walter Johnson
Tim Keefe
Christy Mathewson
Kid Nichols
Jim Palmer
Eddie Plank
Charley Radbourn
Tom Seaver
Bruce Sutter
Hoyt Wilhelm
Cy Young

And the “immortal” batters:

Hank Aaron
Cap Anson
Jake Beckley
Wade Boggs
George Brett
Dan Brouthers
Jesse Burkett
Rod Carew
Roberto Clemente
Ty Cobb
Eddie Collins
Roger Connor
Sam Crawford
Ed Delehanty
Joe DiMaggio
Jimmie Foxx
Frankie Frisch
Lou Gehrig
Charlie Gehringer
Hank Greenberg
Rogers Hornsby
Willie Keeler
Nap Lajoie
Mickey Mantle
Willie Mays
Johnny Mize
Paul Molitor
Stan Musial
Mel Ott
Sam Rice
Frank Robinson
Babe Ruth
Al Simmons
George Sisler
Tris Speaker
Honus Wagner
Paul Waner
Zack Wheat
Ted Williams

Thus my Hall of Fame would have an inner circle of “immortals”: 16 of 35 pitchers (vice the present number of 66) and 39 of batters 91 (vice the present number of 141). La crème de la crème.

Excellence

When it comes to athletic events, I do not root for an underdog just for the sake of doing so. An underdog is an underdog for a good reason — he, she, or it has compiled a record that is not as good as that of the athletes or teams he, she, or it is up against. I may root for an underdog because the underdog is (for some other reason) an athlete or a team that I favor. But that’s the end of it.

I prefer enduring excellence. That is why, for example, I enjoy watching Tiger Woods play golf. It will be a sad day for me when his skills diminsh to the point where he is no longer the golfer that he has been for most of the past ten years. I just hope that he is succeeded by another electrifying talent, not by a “committee” of also-rans.