A Superficially Sensible Proposal

Cato’s Tom Firey warms to the idea of raising taxes:

[R]eaders of this blog probably won’t like last weekend’s column [in The New York Times‘s “Economic View”], penned by Cornell economist Robert Frank. Frank argues that “realistic proposals for solving our budget problems must include higher revenue,” i.e., new taxes or tax increases. However, he says, those proposals are being blocked by “powerful anti-tax rhetoric [that] has made legislators at every level of government afraid to talk publicly about a need to raise taxes.”…

Frank has spent much of his academic career arguing for raising taxes on wealthier people so as to create greater income equality (some of his work can be found here, here, and here). It would thus be expected that a Cato analyst would bash Frank’s column like a piñata. But I believe there’s merit to what he writes….

Why have the tax cuts not slowed government growth? Because Uncle Sam is quite happy to borrow money. Frank points out that the national debt has increased $3 trillion since 2002, and it will likely rise an additional $5 trillion over the next decade. As NYU law professor Dan Shaviro notes in this 2004 Regulation cover story, that debt is future taxes….

This leads to the core problem of borrow-and-spend public finance: Because today’s taxpayers receive government services without paying the full cost, they (and their political leaders) are not forced to consider:

  • Is this service worth its cost?
  • Would we be better off if government spent its money differently?
  • Would we be better off if government did not tax that money away from us, but we instead spent it privately?

Instead, borrow-and-spend lets both the Big Government crowd and the Anti-Taxes crowd get what they want: the Big Government folks can keep expanding government and the Anti-Taxes folks pay lower taxes — for now.

That’s why there’s merit to Frank’s column — if we were to pay, today, the full cost of government, we’d give much more thought to the opportunity cost of government spending. I strongly suspect there’d be much less demand for government services and much stronger outcry against current spending and spending proposals….

So, Prof. Frank, I say bully for you! If we follow your proposal, I think we’ll move several steps closer to limited government.

Firey’s argument makes sense if you read it quickly and uncritically. But three things are wrong with it. First, more borrowing today doesn’t necessarily require a proportionate increase in taxes tomorrow. As I discuss here, the government’s debt can rise interminably in a growing economy. (See also this and this for my views about the notion that government borrowing “crowds out” private investment.)

Second, tax increases usually mean higher marginal tax rates. (“Soak the rich.”) But economic growth is financed and fueled by people at the high end of the income distribution, and by people who strive for the high end. Higher taxes = slower economic growth. It’s as simple as that.

Third, higher tax rates won’t change the political equation. Government spending comprises myriad specific programs, each with its own constituency (in and out of government). Voters and interest groups support politicians who promise (and deliver) specific programs that seem desirable (like the proverbial free lunch). Firey lists some of those programs:

Medicare Part D, the proposed farm bill, the latest round of energy subsidies, more and more corporate welfare, No Child Left Behind, and a whole new, giant federal agency

Would the supporters of Medicare Part D have backed off had they thought that taxes would rise in order to fund Part D? I very much doubt it. Despite the prospect of a tax increase, Part D would have yielded a net financial gain for its beneficiaries, psychic gains and political clout for the private interest groups that pushed it, a larger government bureaucracy (which is a plus, in Washington), and so on. In the perverse world of government, higher spending is an excuse for raising taxes. (Harry Hopkins, FDR’s close adviser, is said to have put it this way: “We shall tax and tax, and spend and spend, and elect and elect.“)

The real villain of the piece is the Supreme Court, for its failure to enforce the constitutional doctrine of limited and enumerated powers — a failure that, in large part, can be traced to the New Deal era. The Court has allowed the federal government to do things for which the federal government has no constitutional mandate. Moreover, the unleashed federal government has fostered (through mandates and grants) the transformation of State and local governments from being providers of basic services (e.g., schools, streets, police, and courts) to being providers of a panoply of “social services.”

In sum, the rise of big government cannot be traced to low taxes. It can be traced, instead, to the failure of the executive and legislative branches of the federal government to honor the Constitution, and the failure of the Supreme Court to enforce it.

Economists As Moral Relativists

Russell Roberts — an econ prof at George Mason University with whom I usually agree — says this about the use of performance-enhancing drugs by baseball players:

When everyone cheats, it’s not cheating any more.

First, not “everyone” cheated. Second, cheating is cheating.

One example does not prove that all economists are moral relativists. But, in more than forty years of associating with economists and reading their work, I have observed that most economists focus on efficiency to the exclusion of morality.

How’s that for a generalization?

An FDR Reader

Thanks to John Ray for bringing my attention to these items:

How FDR Made the Depression Worse,” by Robert Higgs (Feb 1995)
Tough Questions for Defenders of the New Deal,” by Jim Powell (06 Nov 2003)
The Real Deal,” by Amity Shlaes (25 Jun 2007)

Related posts at Liberty Corner include:

Getting it Perfect” (04 May 2004)
The Economic Consequences of Liberty” and an addendum, “The Destruction of Income and Wealth by the State” (01 Jan 2005)
Calling a Nazi a Nazi” (12 Mar 2006)
Things to Come” (27 Jun 2007)
FDR and Fascism” (30 Sep 2007)
A Political Compass: Locating the United States” (13 Nov 2007)
The Modern Presidency: A Tour of American History since 1900” (01 Dec 2007)

Our descent into statism didn’t begin with FDR. (His cousin Teddy got the ball rolling downhill.) But FDR compounded an economic crisis, then exploited it to put us firmly on the path to the nanny state. The rest, as they say, is history.

Thus we now have a “compassionate conservative” as president, and several “Republican” candidates for president who would have been comfortable as New Deal Democrats. Calvin Coolidge must be spinning in his grave at hypersonic speed.

The Economic Divide on the Right: Distributists vs. Capitalists

Guest post:

Too much capitalism does not mean too many capitalists, but too few capitalists.—G.K. Chesterton

Chesterton probably never realized how close to the truth he really came, and it’s unfortunate that this flash of paradox did not enlighten his views on economics in general. He was an advocate of distributism. This is a “third way” economic school popular in certain traditional conservative and Catholic circles. However, it also has its conservative (and Catholic) critics.

I note this as an ex-distributist who admits to the validity of some of Hilaire Belloc’s insights in his foundational distributist tome, The Servile State, without agreeing to its solution. Belloc’s main grievance is what he sees as the collusion of big government and big business in the creation of economic monopolies; a fact also lamented by the free-market theorist Friedrich Hayek who spoke positively of aspects of Belloc’s work in The Road to Serfdom. Seen in that light, the problem is not that there is too much capitalism, but that there isn’t enough. The roadblock to economic independence is heavy taxation and regulation, which ultimately weigh heavier on the small entrepreneur than on the big capitalist. The latter has the clout necessary to get around such problems or even turn them to his own advantage. Unfortunately, distributism takes many anti-capitalist myths at face value and tries to bring about greater property ownership (a noble goal) through yet more regulation, seeking a redistribution of wealth that is hardly distinguishable from socialism.

My own disenchantment with distributists initially had more to do with their methods than their ideas. They often advanced their position as a point of political (and theological) correctness; this despite the fact that very few advocates of that system have a solid grounding in economic theory. For that reason, I am pleased to see that Catholic libertarian Tom Woods (writing with Marcus Epstein and Walter Block) in The Independent Review, offers a perceptive and generally fair critique of the concept. The essay takes into account the good intentions of Belloc and his friend Chesterton (men who made invaluable contributions in so many other areas). But in the end, sincerity cannot make up for flawed reasoning. As the article states,

the creation and maintenance of a distributist economy would have required state action on a scale that, given Chesterton’s and Belloc’s arguments against socialism, would have violated their own principles. Moreover, the distributist argument, although superficially plausible, advanced a number of key claims in a manner that suggested they were beyond debate, when in fact they were quite debatable—and in some cases flatly false. An enormous body of scholarly work published since the time Chesterton and Belloc wrote has undermined their narrative in virtually every particular. (“Chesterton and Belloc: A Critique,” The Independent Review, Spring 2007).

This is more than editorializing here. Hard economic and historical facts are cited by the authors. So please take the time to read it if you’re unconvinced.

N.B. While I don’t agree with The Independent Review that the market paradigm can be applied to all instances of human activity, free trade can still do much good if left to operate in a sensible and just manner.

Whither the Stock Market?

UPDATED (12/14/07)

I have, for several years, been tracking what is now called the Dow Jones Wilshire 5000 Total Market Index, in particular, the D-J Wilshire 5000 Full Cap, a capitalization-weighted index of U.S. stocks. The index now, and since its inception, has included more than 5,000 stocks, and is reputed to offer the best measure of the overall performance of U.S. stocks, in terms of price. (See this paper about the origin and calculation of the index, and this chart for a broad comparison of the Wilshire 5000 some other U.S. stock indices.)

My spreadsheet on the D-J Wilshire 5000 Full Cap goes back to December 1970, the first month for which the index was calculated. (The official site no longer provides data for the period December 1970 through December 1987.) In addition to tracking the current-dollar value of the index, I have converted it to an inflation-adjusted index by applying the CPI-U (available here, among other places). Here is a picture of the inflation-adjusted index from December 1970 through September 2007 (to enlarge, right-click and select “open in new tab”):

The black line at the left covers the period from December 1970, through the bull-market peak in December 1972, to the bear-market bottom in September 1974. (There was a secondary bottom in July 1982, but its inflation-adjusted value was 49 percent higher than that of the bottom in September 1974.) The green line covers the period from the bear-market bottom in September 1974, through the bull-market peak in March 2000, to the bear-market bottom in September 2002. The black line at the right covers the period from the bear-market bottom in September 2002 to September 2007 (the latest month for which I have the CPI-U).

The regression line fits the entire period, December 1970-September 2007, and indicates real growth in stock prices of 10.4 percent annually. The real rate of price growth from the bottom in September 1974 to the peak in March 2000 was 12.1 percent. But how many investors get in at the bottom and out at the top? A more realistic measure of long-run returns to stock investors during the past 30-odd years is the real rate of price appreciation from the bottom in September 1974 to the bottom in September 2002: 8.5 percent annually. That’s nothing to sneeze at, mind you; patience pays off when it comes to the stock market. (UPDATE: The real rate of return on the index from September 1974 through November 2007 was 9.0 percent, which is almost identical to the exponential trend for the period after removing the “bubble” that began late in 1996 and ended early in 2001. This underscores the idea that it is reasonable to expect something like an 8.5 real rate of return, in the long run.)

In light of the stock market’s recent volatility, which reminds me of the volatility that preceded the crash of 2000-2002, I have had second thoughts about the sustainability of the current bull market. (My first thoughts are here.) The market’s recovery since the bottom in September 2002 has brought it back to the inflation-adjusted peak reached in March 2000. As a result, the market may now be meeting some “resistance” (in addition to other factors that may be roiling it, such as the price of oil, uncertainty about the economy, and uncertainty about interest rates). The resistance, if it is that, would be led by those investors who were in the market at its peak in 2000, and held on through the bottom in 2002. Many of them may now be trying to cash out as they break even (in real terms), especially after having reaped (on average) a real, annual gain of more than 13 percent since the market bottomed five years ago.

If I am right about the import of volatility and the possibility of resistance , the broad market may be headed toward a secondary bottom, one not as deep as the bottom reached in September 2002. Long bull markets often are interrupted by dips (see graph above). (In fact, in the long view, the U.S. stock market has been a bull market since its inception — a bull market punctuated by dips known as crashes. See this table and this graph, for example.) The first dip in the bull market of 1974-2000 began in earnest around November 1980. That dip did not end until 20 months later, when the market reached a secondary bottom in July 1982.

Is it possible that the current bull market reached a temporary peak in May of this year, and is now descending toward a secondary bottom that it will not reach for a few years? Consider the parallels between the market of 1970-1982 and the market of the past nine years:

A reversal that lasts a year or two seems entirely possible to me.

I have only one thing to add: Don’t bail out now, unless you absolutely, positively need the money. I could be wrong about the reversal. In any event, stocks are for the long run.

Related post: “Whither the Stock Market? (II)” (16 Jan 2008)

The Way to Look at Inflation

Lew Rockwell, touting the gold standard, plots the cumulative consumer price index on an arithmetic scale, thus making it seem as if inflation is rampant. It’s not.

The best way to depict the change of a cumulative quantity over time is to depict the quantity logarithmically. On a logarithmic scale, a change of “x” percent covers the same vertical distance, regardless of the base from which the change occurs. That is not so for an arithmetic scale, where a change of, say, 10 percent from 100 (10) looks much smaller than a change of 10 percent from 1,000 (100). If the figure of interest is the percentage change (as it is in the case of inflation), the use of an arithmetic scale is bound to overstate recent inflation, relative to inflation in earlier years.

Here’s a more realistic picture of inflation from 1913 to the present:

Source: U.S. Department of Commerce, Bureau of Labor Statistics, Consumer Price Index, All Urban Consumers (CPI-U) (U.S. city average, all items, 1982-84 = 100), available here.

Compared with the 1910s, 1940, and 1970s, inflation has been rather tame for the past 25 years.

UPDATE: Rockwell’s blogging colleague, Jeffrey Tucker, plots a measure of the money supply in the same, dishonest way: arithmetically.

Huh?

A lucid and rather sympathetic exposition of Austrian (Hayekian) economics by J. Bradford DeLong, an admitted non-believer (see second paragraph under IV.B).

Related posts:
Liberty and Its Prerequisites (scroll down to “The Evolution of Libertarian Thought: The Unification of Economic and Personal Liberty”)
More Hayek

See also: F.A. Hayek Articles & Books, Etc. (links)

The Laffer Curve, "Fiscal Responsibility," and Economic Growth


The Laffer Curve and Supply-Side Economics

The Laffer curve is the centerpiece of so-called supply-side economics. The idea behind both concepts is straightforward. Here it is, in my words:

Taxes inhibit economic activity, especially because progressive tax rates reduce saving among persons with higher incomes and, thereby, reduce the flow of funds available for growth-producing capital investments (e.g., new manufacturing equipment, better computers, R&D on drugs that improve the health of workers and others). Lower tax rates therefore foster a higher rate of economic growth. The economic growth that is fostered by tax-rate reductions may, in some instances, cause tax revenues to rise.

Many commentators accept that reductions in tax rates spur economic growth. Far fewer accept that faster economic growth will, in turn, cause tax revenues to rise. (For various views on the matter, see this, this, this, this, this, and this.)

Questions and Brief Answers

The Laffer hypothesis, and criticisms of it, stir me to ask (and answer) these questions:

  1. Would tax rates below (above) the current level spur (inhibit) economic growth?
  2. If so, by how much?
  3. At what tax rate would revenues be maximized?
  4. Are tax revenues more important than economic growth?

My brief answers are these:

  1. Yes, changes in tax rates cause economic growth to move in the opposite direction.
  2. By a lot.
  3. It is possible to estimate the rate at which tax revenues are maximized, but who would want to maximize them, other than a “fiscally responsible” (i.e., tax-and-spend) “liberal”?
  4. Only to a tax-and-spend “liberal.”

In what follows, I enlarge on those answers.

The Laffer Curve, in Theory

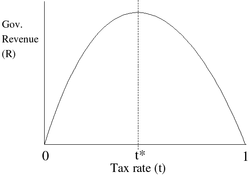
I begin with this depiction of the Laffer curve (via Wikipedia):

t* represents the rate of taxation at which maximal revenue is generated. Note: This diagram is not to scale; t* could theoretically be anywhere, not necessarily in the vicinity of 50% as shown here.

Many criticisms of the Laffer curve are recited here (not all of which I accept). My main reservation about the curve is its span:

  • With real taxes (i.e., government spending) at zero or close to it, the rule of law would break down and the economy would collapse. Thus the curve should not extend to zero on the x-axis.
  • With real taxes (i.e., government spending) at very high rates (much about the level of 50 percent, which the U.S. reached in World War II), the economy would be subsumed by government.

The Proper Range of the Laffer Curve

With regard to the first problem, I would set the minimum tax rate at 15 percent of GDP. The normal peacetime burden of government spending between the end of the Civil War and the eve of the Great Depression ranged from 5 to 10 percent of GDP,1 enough to maintain law and order and to provide minimal “social services.” To that I would add 5 to 10 percent for the kind of defense that we need in these parlous times. (See this post, for example.)

I therefore consider a tax rate of 15 percent to be the lowest rate of interest along the x-axis of the Laffer curve. I include in that 15-percent rate taxes levied by all levels of government, not only to to fund governmental functions (e.g., justice and defense) but also to fund social transfers (e.g., Social Security).

As for the second problem, at a very high tax rate we would have a command economy (as in the former Soviet Union). At a tax rate of 100 percent, for example, government would have to confiscate everyone’s income, then turn around and refund that income to everyone in the form of government-dictated access to goods and services. Those goods and services would, of necessity, be produced by the populace at the direction of government; there would be no private sector.2 Everyone — excepting brave black-marketeers — would be a government employee or contractor. The distribution of income in a Soviet-style economy does not, of course, match the distribution of income in a market economy. A Soviet-style economy, rather, operates on the following principle: “From each according to his ability, to each — especially the commissariat and its favorites — according to his needs.”

The U.S. economy was practically a command economy during World War II, when government commandeered as much as 50 percent of the nation’s output. (See the graph in the footnote to this post.) I therefore regard 50 percent as the highest meaningful value along the x-axis of the Laffer curve.

Quantifying the Laffer Curve and More Important Values

In sum, the Laffer curve is relevant over the range of a 15-percent to 50-percent tax rate. And the Laffer curve can be quantified over that range. To quantify it, I draw on “The Macroeconomic Effects of Tax Changes: Estimates Based on a New Measure of Fiscal Shocks,” by Christina D. Romer and David H. Romer, both of the Department of Economics at the University of California, Berkeley. (A free copy of the paper is available here. A copy is available here for $5.)

The Romers’ estimate, among other things, the effects of exogenous changes in taxes on GDP. (“Exogenous” meaning tax cuts aimed at stimulating the economy, as opposed — for example — to tax increases aimed at reducing government deficits.) Here is the key finding, from pages 21 and 22 of the free version of the paper:

Figure 4 summarizes the estimates by showing the implied effect of a tax increase of one percent of GDP on the path of real GDP (in logarithms), together with the one-standard-error bands. The effect is steadily down, first slowly and then more rapidly, finally leveling off after ten quarters. The estimated maximum impact is a fall in output of 3.0 percent. This estimate is overwhelmingly significant (t = –3.5). The two-standard-error confidence interval is (–4.7%,–1.3%). In short, tax increases appear to have a very large, sustained, and highly significant negative impact on output. Since most of our exogenous tax changes are in fact reductions, the more intuitive way to express this result is that tax cuts have very large and persistent positive output effects.

The Romers assess the effects of tax cuts over a period of only 12 quarters (3 years). Some of the resulting growth in GDP during that period takes the form of greater spending on capital investments, the payoff from which usually takes more than 3 years to realize. So, a 1-percent tax cut yields more than a 3-percent rise in GDP, over the longer run. How much more? About 0.25 percent. Thus a tax cut of 1 percent of GDP yields a total, long-run increase in GDP of about 3.25 percent.3

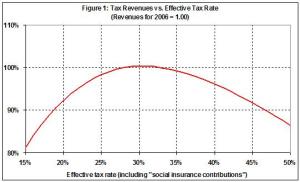
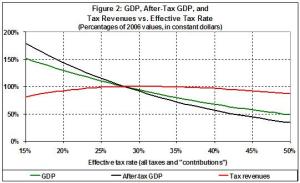
With that number in hand, and knowing the current, effective tax rate (28 percent of GDP in 20064), it is then easy to compute GDP, tax revenues, and after-tax GDP as a function of the overall tax rate. The following graphs display those values in index form, where 1.00 is the value in 2006. Figure 1 is my estimate of the Laffer curve. Figure 2 contrasts the Laffer curve with more important values, namely, the effects of tax-rate changes on GDP and after-tax GDP.


Questions and Answers, Revisited

I return now to the earlier questions, and expand on my brief answers to them:

  1. Q. Would tax rates below/above the current level spur/inhibit economic growth? A. Yes, lower tax rates would spur growth and higher tax rates would inhibit growth — markedly, in both cases.
  2. Q. If so, by how much? A. Reducing taxes to an effective rate of 15 percent of GDP, for example, would lead to an increase in GDP of about 50 percent and an increase in after-tax GDP of about 80 percent. An effective tax rate of 40 percent, on the other hand, would lead to a one-third decrease in GDP and a 45-percent decrease in after-tax GDP.
  3. Q. At what tax rate would revenues be maximized? A. An increase in the effective tax rate from 28 percent to 30 percent would cause tax revenues to rise by 0.3 percent (that’s three-tenths of 1 percent). Wow! As a result of that “fiscally responsible” increase, GDP would drop by 6 percent and after-tax GDP would drop by 9 percent.
  4. Q. Are tax revenues more important than economic growth? A. No. Why? First, see the answer to question number 3. Then, consider this: It is blind stupidity to focus on tax revenues. The economy does not exist for the purpose of generating tax revenues, it exists for the purpose of providing goods and services for today’s use and “wealth” (in such forms as housing and savings) for use over the longer term (e.g., for our children’s education and our retirement). It is necessary to divert a minimal fraction of economic output to government (about 15 percent, nowadays), for the purpose of protecting ourselves and our economic activities from predators, foreign and domestic. Any diversion beyond that is pure waste.

The Laffer Curve Puts the Emphasis on the Wrong Economic Variable

I cannot over-emphasize this point: The Laffer curve does a great disservice by emphasizing tax revenues, when the proper emphasis is on economic growth. Government doesn’t create jobs; on balance, it only destroys them, through taxation (and regulation).

By focusing on tax revenues, Lafferites play into the hands of “fiscally responsible” (i.e., tax-and-spend) “liberals” (i.e. Leftists). The Left is interested in neither fiscal responsibility nor economic growth. The Left simply wants to raise taxes in order to pay for more social goodies, and that’s that. In return for those goodies, most of us — even including the Left’s protégés — would get less of everything. The proof of that statement is found not only in the Romers’ analysis, but also in the case study of economic suicide that is Michigan, and in the retrogressive economic history of the United States.

Yet, the Left (i.e., Charlie Rangel and friends) want to pay for their social goodies by levying punitive taxes on the so-called “super-rich” — those high-earning, highly productive citizens who, on the one hand, finance economic growth and, on the other hand, implement it through hard work, entrepreneurship, and innovativeness. They already subsidize the rest of us when it comes to taxes (e.g., here, here, here, here, and here). Forcing the “rich” to pay more will only cause economic harm to the rest of us.

(UPDATE, 10/31/07: It is good news that the tax-rate cuts in 2003 seem to have yielded higher tax revenues, because the apparent correlation between lower tax rates and higher revenues seems to confirm the Laffer effect. It is bad news that tax revenues have risen, because the money would have been used more productively in the private sector. My take, however, is that tax revenues have risen mainly because of cyclical growth. I don’t doubt the stimulus afforded by tax-rate cuts; I simply doubt the presence of a Laffer effect at the effective tax rate in 2003, which was 26 percent.

This, on the other hand is good news: lower taxes for the highest earners. The highest earners save and invest more than the rest of us. And that means more economic growth for all of us.

If you’re super-duper rich — as is Warren Buffet — and you think your taxes are too low, take this advice: Voluntarily write a check to the Treasury, and shut up. But don’t propound a rise in marginal tax rates at the high end of the income distribution.)

Coda

So, Mr. Laffer is entirely correct when he writes:

Lower tax rates change people’s economic behavior and stimulate economic growth….

Unfortunately, instead of stopping there, he adds:

…which can create more–not less–tax revenues.

Tax-rate reductions (down to about 15 percent of GDP) will always stimulate economic growth, but they will not always result in higher tax revenues. The mistake that Mr. Laffer and his followers make is to argue that tax cuts lead inexorably to higher tax revenues. In doing so, they play into the hands of tax-and-spend Leftists.

Growth, growth, growth! That’s the winning mantra.
__________
1. See “Martin’s estimates” in Series F216-225, “Percent Distribution of National Income or Aggregate Payments, by Industry, in Current Prices: 1869-1968,” in Chapter F, National Income and Wealth, Historical Statistics of the United States, Colonial Times to 1970: Part 1.

2. Aggregate income (the claims on or distribution of output) must be equal to the aggregate of all types of output.Income and output (the two faces of GDP) in a closed economy (no imports or exports) can be expressed in terms of certain parameters:

Income = C + S + T
Output = C + I + G,
where the parameters are defined as follows:
C = consumption (private-sector consumption of goods and services produced domestically, excluding consumption that is subsidized by government transfer payments to the beneficiaries of such programs Social Security and Medicare)
S = saving (private-sector income not consumed, taxed, or spent on imports)
I = private-sector investment (output invested by non-governmental entities in technology, buildings, equipment, etc., for the purpose of increasing the future output of goods and services)
T = taxes, including transfer-payment taxes for Social Security, etc.
G = government spending (including spending that is subsidized by transfer payments for such programs as Social Security and Medicare)

(These definitions vary from the standard version in that any spending subsidized by government transfer payments for such programs as Social Security and Medicare is included in G rather than C . These definitions also implicitly reject a role for government in saving and investment, for reasons spelled out in my post, “Joe Stiglitz, Ig-Nobelist.”)

It is trivial to show that as government commandeers all output (G = GDP), the values for C and I must shrink to zero.

But, since C (if not I) cannot be reduced to zero without starving the populace and thus reducing its output to zero, government must allocate some G to C. That which it does not allocate to C or fritter away in entirely wasteful endeavors becomes S (and therefore I), by default. But under such a regime, C, S, and I become entirely different — quantitatively and qualitatively — than they would be under a quasi-free-market regime, such as we have in the United States.

Related posts:
Why Government Spending Is Inherently Inflationary
Trade, Government Spending, and Economic Growth

3. Figure 14.c on page 70 of the free version of the Romers’ paper indicates that a 1-percent tax cut leads to a rise in fixed, nonresidential (i.e., business) investment of about 6 percent. Given that business investment is about one-tenth of GDP (see table 3, here), business investment accounts for about 1.8 percentage points of a 3 percentage point rise in GDP (6 x 1/10 x 3 = 1.8).

More importantly, that 1.8-percent rise in investment spending yields, over the longer run, something like an additional 0.25-percent growth in GDP, assuming a rate of return on business investment (capital) of 10-15 percent. See, for example, the bottom panel of figure 3 in “Growth, Productivity, and the Rate of Return on Capital,” by Charles Adams and Bankim Chadha. (For more about investment and its economic effects, see this tutorial.)

Additional growth of 0.25 percent a year might seem like small change, but over 25 years it adds 5 percent to GDP. That’s $660 billion in 2006 dollars — more than $200 per capita.

4. Taxes collected by all levels of government in the U.S. in 2006 (including “social insurance contributions”) amounted to $3,697 billion. GDP in 2006 was $13,195 billion. (These estimates are from the U.S. Department of Commerce, Bureau of Economic Analysis, National Income and Product Accounts, tables 1.1.5 and 3.1, respectively.) Thus the effective tax rate in 2006 was 28.0 percent.

Worth Revisiting

I sometimes use Site Meter to determine which of the posts at this blog have been of special interest to visitors. Pleasantly surprised am I to find that “Science, Axioms, and Economics” has been drawing some traffic. I consider it to be among Liberty Corner‘s best offerings.

Friday’s Best Reading

Links and excerpts:

The Laffer Curve Straw Man,” by Daniel Mitchell (Cato-at-Liberty)

The real issue is whether certain changes in tax policy will have some impact on economic activity. If an increase (decrease) in tax rates changes behavior and causes a reduction (increase) in taxable income, then revenues will not rise (fall) as much as “static” revenue-estimating models would predict. This is hardly a radical concept, and evidence of Laffer-Curve effects is very well established in the academic literature.

Sociologists Discover Religion,” by Heyecan Veziorglu (campusreportonline.net)

Associate Professor Dr. Jeffrey Ulmer from Pennsylvania State University examines the degree to which religiosity increases self-control. He points out that religious observance builds self-control and substance use is lower in stronger moral communities.

Eminent Scientist Censored for Truth-Telling [about genes and IQ],” by John J. Ray (Tongue Tied 3)

…There is no inconsistency in saying that blacks as a whole are less intelligent while also acknowledging that some individual blacks are very intelligent. What is true of most need not be true of all.

Scientists have spent decades looking for holes in the evidence [Dr. James] Watson [of DNA fame] was referring to but all the proposed “holes” have been shown not to be so. There is NO argument against his conclusions that has not been meticulously examined by skeptics already. And all objections have been shown not to hold up. There is an introduction to the studies concerned here.

Some commentators have mentioned that old Marxist propagandist, Stephen Jay Gould, as refuting what Watson said. Here is just one comment pointing out what a klutz Gould was. And for an exhaustive scientific refutation of Gould by an expert in the field, see here. [Highly recommended: LC.] Gould’s distortions of the facts really are quite breathtaking.

Hanson Joins Cult,” by Robin Hanson (Overcoming Bias)

Rumors of a weird cult of “Straussians” obsessed with hidden meanings in classic texts have long amused me. Imagine my jaw-dropping surprise then to read an articulate and persuasive Straussian paper by Arthur Melzer in the November Journal of Politics:

Leo Strauss…argued that, prior to the rise of liberal regimes and freedom of thought in the nineteenth century, almost all great thinkers wrote esoterically: they placed their most important reflections “between the lines” of their writings, hidden behind a veneer of conventional pieties. They did so for one or more of the following reasons: to defend themselves from persecution, to protect society from harm, to promote some positive political scheme, and to increase the effectiveness of their philosophical pedagogy….

Melzer convinced me with data:

By now we have seen a good number of explicit statements by past thinkers acknowledging and praising the use of esoteric writing for pedagogical purposes. What is perhaps even more striking in this context is that I have been unable to find any statements, prior to the nineteenth century, criticizing esotericism for the aforementioned problem, or indeed for any other.

This great transition is my best bet for the essential change underlying the industrial revolution:

In The Flight from Ambiguity, the distinguished sociologist Donald Levine writes: “The movement against ambiguity led by Western intellectuals since the seventeenth century figures as a unique development in world history. There is nothing like it in any premodern culture known to me”. This remarkable transformation of our intellectual culture was produced by a variety of factors, but most obviously by the rise of the modern scientific paradigm of knowledge which encouraged the view that, in all fields, intellectual progress required the wholesale reform of language and discourse, replacing ordinary parlance with an artificial, technical, univocal mode of communication

Modern growth began when enough intellectuals gained status not from ambiguity but from clarity, forming a network of specialists exchanging clear concise summaries of new insights.

The Sveriges Riksbank Prize in Economic Sciences for 2007

The Royal Swedish Academy of Sciences has awarded The Sveriges Riksbank Prize in Economic Sciences in Memory of Alfred Nobel 2007 to Leonid Hurwicz, University of Minnesota; Eric S. Maskin, Institute for Advanced Study, Princeton; and Roger B. Myerson, University of Chicago, for having initiated and developed “mechanism design theory,” which (according to the Academy),

has greatly enhanced our understanding of the properties of optimal allocation mechanisms in such situations, accounting for individuals’ incentives and private information. The theory allows us to distinguish situations in which markets work well from those in which they do not. It has helped economists identify efficient trading mechanisms, regulation schemes and voting procedures.

(For more, read this.)

“Mechanism design theory” is, in fact, a tool for centralized planning. It assumes, among other things, that there is such a thing as a “social welfare function,” when there is not. It assumes, also, that there are such things as “public goods,” and that markets “fail” to provide such goods, when there are not such failures (or would not be in the absence of government intervention). (See, for example, #15 and #16 here.) The provision of defense as a public good, for example, arises not out of economic necessity but out of political prudence. (For more on that point, see this and this, and the posts linked therein.)

Recommended reading: a post by Justin Ptak at Mises Economics Blog, and an article by Alex Tabarrok at reasononline (the only flaw of which is a too-willing acceptance of the idea of “public goods”).

Other related posts at Liberty Corner:
Socialist Calculation and the Turing Test
Second-Guessing, Paternalism, Parentalism, and Choice
Whose Incompetence Do You Trust?
Joe Stiglitz, Ig-Nobelist
Three Truths for Central Planners
Risk and Regulation
Back-Door Paternalism
Liberty, General Welfare, and the State
Science, Axioms, and Economics
Mathematical Economics
Economics: The Dismal (Non) Science
Positive Rights and Cosmic Justice: Part IV

The Ultimatum Game and Genes

Greg Mankiw points to research which suggests that our sense of “fairness” may be genetic:

The paper, published in the Oct. 1 advanced online issue of the Proceedings of the National Academy of Sciences, looked at the ultimatum game, in which a proposer makes an offer to a responder on how to divide a sum of money. This offer is an ultimatum; if the responder rejects it, both parties receive nothing.

Because rejections in the game entail a zero payoff for both parties, theories of narrow self-interest predict that any positive amount will be accepted by a responder. The intriguing finding in the laboratory is that responders routinely reject free money, presumably in order to punish proposers for offers perceived as unfair.

To study genetic influence in the game, Cesarini and colleagues took the unusual step of recruiting twins from the Swedish Twin Registry, and had them play the game under controlled circumstances. Because identical twins share the same genes but fraternal twins do not, the researchers were able to detect genetic influences by comparing the similarity with which identical and fraternal twins played the game.

The researchers’ findings suggest that genetic influences account for as much as 40 percent of the variation in how people respond to unfair offers. In other words, identical twins were more likely to play with the same strategy than fraternal twins.

More than three years ago I said this about the ultimatum game:

Being offered only one of 10 dollars [in the ultimatum game] is an insult, and accepting an insult isn’t worth a dollar, to most people. When someone who is holding 10 dollars offers you only one dollar, that person is sending you a signal about your worth in his or her eyes.

I don’t know whether the typical rejection of an insulting offer is genetic. But rejection makes sense, if you consider how people act in “real life” as opposed to being the wealth-maximizers portrayed in economics texts.

Michigan’s Economic Suicide

See this, then this, then this.

A Century of Regress

If this is true, so is this.

DoJ on Net Neutrality

According to K. Lloyd Billingsley, writing at TCS Daily, the Department of Justice has taken exactly the right stance on “net neutrality”:

Net neutrality means government regulation of the Internet, specifically a prohibition of differential charges for priority traffic. The Department of Justice thinks this is a bad idea, and would harm the development of the Internet.

“Free market competition, unfettered by unnecessary governmental regulatory restraints, is the best way to foster innovation and development of the Internet,” says the DoJ filing [with the FCC on September 6]….

“There is reason to believe that the type of regulatory restraints proposed by some commenters under the mantle of ‘neutrality’ could actually deter and delay investment and innovation, and result in less choice and higher prices to consumers of Internet services,” the Department said.

In the lexicon of net neutrality, differential or priority pricing is called “discrimination,” but the DoJ does not buy this rhetorical effort to seize the moral high ground. “Differentiating service levels and pricing, for example, is a common and often efficient way of allocating scarce resources and meeting consumer preferences,” the filing explains, using the United States Postal Service as an example.

DoJ might have used a better example than USPS. Nor is differential pricing restricted to service. The most expensive items purchased by consumers (houses and cars) are price-differentiated to a fare-thee-well. Imagine the furore if government regulators decreed that all houses and cars had to be the same and sell for the same price.

The bottom line: DoJ has it right about “net neutrality.” As I wrote here:

By the “logic” of net neutrality, everyone would be forced to accept goods and services of the same quality. That quality would be poor because there would be no incentive to produce better goods and services to earn more money in order to buy better goods and services — because they couldn’t be bought. Reminds me of the USSR.

Read the whole thing. It’s on the mark, if I do say so myself.

Things to Come, Revised

Here.

Irrationality, Suboptimality, and Voting

In “The Rational Voter?” I define rationality as the application of “sound reasoning and pertinent facts to the pursuit of a realistic objective (one that does not contradict the laws of nature or human nature).” I later say that

[m]any (a majority of? most?) voters are guilty of voting irrationally because they believe in such claptrap as peace through diplomacy, “social justice” through high marginal tax rates, or better health care through government regulation. To be perfectly clear, the irrationality lies not in favoring peace, “social justice” (whatever that is), health care, and the like. The irrationality lies in knee-jerk beliefs in such contradictions as peace through unpreparedness for war, “social justice” through soak-the-rich schemes, better health care through complete government control of medicine, etc., etc., etc. Voters whose objectives incorporate such beliefs simply haven’t taken the relatively little time it requires to process what they already know or have experienced about history, human nature, and social and economic realities….

Another way to put it is this: Voters too often are rationally irrational. They make their voting decisions “rationally,” in a formal sense (i.e., [not “wasting” time in order to make correct judgments]). But those decisions are irrational because they are intended to advance perverse objectives (e.g., peace through unpreparedness for war).

Voters of the kind I describe are guilty of suboptimization, which is “optimizing some chosen objective which is an integral part of a broader objective; usually the broad objective and lower-level objective are different.”

I will come back to suboptimal voting. But, first, this about optimization: If you aren’t familiar with the concept, here’s good non-technical definition: “to do things best under the given circumstances.” To optimize, then, is to achieve the best result one can, given a constraint or constraints. On a personal level, for example, a rational person tries to be as happy as he can be, given his present income and prospects for future income. (Note that I do not define happiness as the maximization of wealth.) A person is not rational who allows, say, his alchololism to destroy his happiness (if not also the income that contributes to it). He is suboptimizing on his addiction instead of optimizing on his happiness.

By the same token, a person who votes irrationally also suboptimizes. A vote may “make sense” at the moment (just as another drink “makes sense” to an alcoholic), but it is an irrational vote if the voter does not (a) vote as if he were willing to live by the consequences if his vote were decisive and/or (b) take the time to understand those consequences.

In some cases, a voter’s irrationality is signaled by the voter’s (inner) reason for voting; for example: to feel smug about having voted, to “protest” or to “send a message” (without being able to explain coherently the purpose of the protest or message), or simply to reinforce unexamined biases by voting for someone who seems to share them. More common (I suspect) are the irrational votes that are cast deliberately for candidates who espouse the kinds of perverse objectives that I cite above (e.g., peace without preparedness for war).

Why is voter irrationality important? Does voting really matter? Well, it’s easy to say that an individual’s vote makes very little difference. But that just isn’t true. Consider the presidential election of 2000, for example, where the outcome of the election depended on about five hundred votes out of the almost six million cast in Florida. I recall that Florida was thought to be safely in Bush’s column, until after all the votes had been cast.

If you are certain that your vote won’t make a difference (as in Massachusetts, for example), don’t bother to vote — unless the act of voting, itself, gives you satisfaction. Otherwise, always vote as if your vote will make a difference to you and those about whom you care. Vote as if your vote will be decisive. To vote otherwise is irrational, in and of itself.

The next (necessary) step is to vote correctly. Short-sighted voters (i.e., irrational ones) vastly underestimate the importance of voting correctly. As Glen Whitman points out, there is a tendency to

give[] too little attention to the political dynamics of…a mandate, instead naively assuming that the mandate could be crafted once-and-for-all in a wise and lobbying-resistant fashion.

That is to say, voters (not to mention those who profess to understand voters) overlook the slippery slope effects of voting for those who promise to “deliver” certain benefits. It is true that the benefits, if delivered, would temporarily increase the well-being of certain voters. But if one group of voters reaps benefits, then another group of voters also must reap them. Why? Because votes are not won, nor offices held, by placating a particular class of voter; many other classes of them must be placated as well.

The “benefits” sought by voters (and delivered by politicians) are regulatory as well as monetary. Many voters (especially wealthy, paternalistic ones) are more interested in controlling others than they are in reaping government handouts (though they don’t object to that either). And if one group of voters reaps certain regulatory benefits, it follows (as night from day) that other groups also will seek (and reap) regulatory benefits. (Must one be a trained economist to understand this? Obviously not, because most trained economists don’t seem to understand it.)

And then there is the “peaceat-any-priceone-worldcrowd, which is hard to distinguish from the crowd that demands (and delivers) monetary and regulatory “benefits.”

So, here we are:

  • Many particular benefits are bestowed and many regulations are imposed, to the detriment of investors, entrepreneurs, innovators, inventors, and people who simply are willing to work hard to advance themselves. And it is they who are responsible for the economic growth that bestows (or would bestow) more jobs and higher incomes on everyone, from the poorest to the richest.
  • A generation from now, the average American will “enjoy” about one-fourth the real output that would be his absent the advent of the regulatory-welfare state about a century ago.

Conclusion: Voters who have favored the New Deal, the Square Deal, the Great Society, or almost any Democrat who has run for national office in the past seventy-five years have been supremely irrational. They have voted against their own economic and security interests, and the economic and security interests of their progeny.

This isn’t rocket science or advanced economics or clinical psychology. It’s common sense, a quality that seems to be lacking in too many voters — and in the politicians who prey on them. What else can you expect after seven decades in which creeping socialism and “internationalism” have been inculcated through public “education” and ratified by the courts.

HillaryCare Returns

It’s all over the blogosphere. Glen Whitman has the best take on it because he ackn0wledges the slippery-slope, camel’s nose-in-the-tent factor.

What’s next after mandating health insurance for all? How about: the kind of health care we must have, who must deliver it, how it must be delivered, at what price, and on and on into the night. It’s a poisonous prescription for America’s still-excellent — if already somewhat socialized — health-care industry.

And there’s nowhere left to turn. Canada’s out because it already has fully socialized medicine. (Canadians in search of better medical attention are coming here, for crying out loud.) Mexico’s out because it’s a third-world country with fourth-rate health care and quacks who cater to desperate, terminally ill Americans with more money than sense. Medicine on the Moon, anyone?

P.S. A good post here.

P.P.S. More about health care in Canada here.

Monopoly

This article at the website of the Ludwig von Mises Institute reinforces what I say in “Monopoly and the General Welfare.” Both items are fairly short. Read them and overcome your fear of Microsoft.

Why Ohio Is Getting Bluer

A post at RealClearPolitics notes that “Ohio Is Looking Blue” for election 2008. That’s not surprising, given that enterprising Ohioans have been fleeing the Buckeye State for decades; for example:

So, Ohio turns Blue, while sun-belt Red States (e.g., Texas and Georgia) turn a deeper shade of Red. Quelle surprise!

P.S. See also.