The prologue is here, part I is here, part II is here, and part III is here. In this post — probably the last in the series — I argue that cosmic justice (a.k.a. redistributionism) is largely futile. Those who are created less-than-equal — with respect to the attributes that yield material success — cannot be made equal by handouts, “head starts,” or affirmative action. UPDATE: For a long, well-substantiated survey about the validity of intelligence as a concept, the validity of race as a concept, persistent differences in IQ between races, and related matters, go here.
BACKGROUND
I say in Part II that
[l]iberals’ arrogant willingness to play at being gods [i.e., meting out cosmic justice through redistributionism]…rests on these deep[] (and usually unacknowledged) assumptions:
- One person’s well-being can be measured against another person’s well-being through interpersonal comparisons of utility.
- There is a kind of cosmic justice — or social welfare function — that is advanced by harming some persons for the benefit of other persons. That is, a benefit cancels a harm — at least when the benefit and harm are decided by liberals.
- Taking wealth and income from those who have “too much” does not, on balance, harm those who have “too little” by dampening economic growth and voluntary charity….
(The first and second assumptions enable [liberal redistributionists] to assert that “positive freedom entails negative freedom.” To [liberal redistributionists], there is one big “welfare pie” in sky, in which we all somehow share — despite the obvious fact that A is made worse off when some of his wealth or income is confiscated and given to B.)
…Given the foregoing, liberals see it as necessary and desirable to redistribute wealth and income from persons who have “too much” to persons who have “too little” — or “too little” of the things that wealth and income can buy. Otherwise, those who have “too little” wealth or income (or the things they can buy) would enjoy only “theoretical” freedom. But the use of the word “theoretical” is a rhetorical trick, a bit of verbal sleight-of-hand. It implies, without proof, that anyone who does not enjoy a certain “minimal” state of health, wealth, etc. — as “minimal” is defined by a liberal — simply lacks the wherewithal to strive toward ends that he or she values….
The liberal argument for redistribution, therefore, is really a circular argument intended to justify liberals’ particular sense of fitting outcomes.
A “liberal” (or “progressive”) would be quick to proclaim that most of the poor are not poor simply for lack of wherewithal (i.e., education and training); rather, they are victims of discrimination based on race, ethnicity, or gender. That is, they are “trapped by the system,” and it is the duty of liberals to rectify the system’s wrongs.
TOUGH QUESTIONS, UNPOPULAR ANSWERS
But are the poor (and other groups favored by liberals) really trapped by the system, that is, by prejudicial discrimination? Or are they generally lacking in wherewithal because they are trapped by their genetic and cultural inheritance? If the latter, as I argue here, the quest for cosmic justice through redistribution is counterproductive, largely futile, and unfair. How so?
The quest for cosmic justice through redistribution is counterproductive for three reasons
- Redistribution is like giving a person a fish instead of teaching him how to fish; if he becomes dependent on the handout he is less likely to better himself, within the scope of his ability.
- Because redistribution reduces the rewards that accrue to superior achievement it leads to a lower rate of economic growth — to the detriment of all, including those for whom liberals’ hearts bleed. (For more about the counterproductive effects of redistribution, see this, this, and this.)
- The lowering of rewards for superior achievement (i.e., taxation) reduces voluntary charity. And yet it is voluntary charity that is most likely to help those in need better themselves. Why? Because voluntary donors, operating through truly non-governmental organizations (i.e., not the Red Cross, United Way, and their ilk) are personally committed to — and vigilant about — the effective use of their contributions.
The quest is largely futile because — contrary to liberal rhetoric and political correctness (which are much the same thing) — all races, ethnic groups, and genders are not equal when it comes to mental and behavioral inheritance. (Races, ethnic groups, and genders differ broadly in their mental and behavioral traits, but each race, ethnic group, and gender is not And it is one’s mental and behavioral inheritance that largely determines one’s income. homogeneous, even though liberals like to treat them as if they were.) Redistribution — in any form (e.g., welfare payments, preferential hiring and promotion of “protected” groups) — does not offset the “barriers” of race, ethnicity, and gender because, in the main, it cannot do so. Because liberals will not admit the futility of redistribution they are bound to redouble and perpetuate it, as they have done for more than 70 years.
As to the unfairness of redistribution, I think Anthony de Jasay hits it on the head in “Risk, Value, and Externality“:
Stripped of rhetoric, an act of social justice (a) deliberately increases the relative share….of the worse-off in total income, and (b) in achieving (a) it redresses part or all of an injustice….This implies that some people being worse off than others is an injustice and that it must be redressed. However, redress can only be effected at the expense of the better-off; but it is not evident that they have committed the injustice in the first place. Consequently, nor is it clear why the better-off should be under an obligation to redress it….
For more about the counterproductive and unfair nature of redistribution, see parts II and III (linked above). My focus, from here on, is the essential futility of the redistrutionist urge.
BEGINNING AT THE BEGINNING
Hypotheses
The rest of this post summarizes some of the evidence that is available with respect to relationships between genes, intelligence, and behavior. Much of the evidence is controversial not because it is false but because (a) some of its authors are controversial* and (b) it tells a politically incorrect story:
- There are heritable differences in behavior and intelligence.
- Those differences show up in education and income.
- Those differences run (generally) along the lines of race, ethnicity, and gender.
Those who deny such evidence do so, I believe, because their political leanings preclude objectivity. They are committed to the dispensation of cosmic justice in the service of “equality.” They are therefore committed to the enforcement of discrimination in favor of certain classes of persons. Their first, loudest, and everlasting reaction to evidence which indicates that races, ethnic groups, and genders are not created equal when it comes to income-producing aptitudes is to cry “racism” and “sexism.”
Disclaimer
Thus this anticipatory disclaimer:
I anticipate — and reject — accusations that I am a racist and a misogynist. A racist is “a person with a prejudiced belief that one race is superior to others.” A misogynist hates women. I hew to neither trait.
I am very far from being a woman-hater; women are (among other things) essential to civil society, without which liberty is impossible (e.g., see this). More generally, I do not believe that a particular race, ethnic group, or gender is a superior one — in the sense of being entitled to a position of power over other races or ethnic groups or another gender. I do believe, based on evidence of the kind I sample below, that there are very real, measurable, and persistent differences in aptitudes across races, ethnic groups, and genders, and that those differences underlie persistent differences in the average incomes earned by various races, ethnic groups, and genders.
My belief is based not on prejudice: “an adverse judgment or opinion formed beforehand or without knowledge or examination of the facts.” I was once a prejudiced (i.e., ignorant) liberal, a believer in cosmic justice. Facts, experience, and reason have led me away from that benighted persuasion.
The careful reader will observe that the evidence I sample here most decidedly does not support any claim of “white supremacy.” White supremacy in the United States involves the presumption that whites are superior to blacks. But there is more to it than that. White supremacy also encompasses anti-Semitism and prejudice against such “non-white” groups as Arabs and Asians. Moreover, white supremacists in the United States usually are anti-Catholic, and they consider persons of Eastern and Southern European origin to be of inferior stock. The IQ measures I cite here decidedly favor Ashkenazi Jews and East Asians over the particular kinds “whites” favored by white supremacists (e.g., the “Herrenvolk“).
Intelligence, a Central Concept
I should now elaborate on the concept of intelligence — in particular, IQ or “general intelligence” — and its importance in the context of this post. I do not deny the possibility of “multiple intelligences.” But, for the purpose of this post, the relevant kind of intelligence is
a property of mind that encompasses many related abilities, such as the capacities to reason, plan, solve problems, think abstractly, comprehend ideas and language, and learn….
Despite the variety of concepts of intelligence, the most influential approach to understanding intelligence (i.e., with the most supporters and the most published research over the longest period of time) is based on psychometric testing. Such intelligence quotient (IQ) tests include the Stanford-Binet, Raven’s Progressive Matrices, the Wechsler Adult Intelligence Scale and the Wechsler-Bellevue.
All forms of IQ tests correlate highly with one another. The traditional view is that these tests measure g or “general intelligence factor“. g can be derived as the principal factor using the mathematical method of factor analysis.
Why is IQ the relevant kind of intelligence? Arnold Kling explains:
[T]he reality is that the intelligences that feed into IQ are what drive economic success. I have an unwritten essay on the meadow and the food court. It’s a way of capturing Gregory Clark’s economic history in a metaphor.
In a meadow economy, the human race is a grazing herd. The naturalists are the ones who eat the best. This was the economy up until about 1800 everywhere, and it still applies in the underdeveloped world today.
In the West since 1800, we’ve been moving to the food court economy, where we use complex recipes and convoluted trading mechanisms to translate basic ingredients into fancy consumption goods. Overall, most of the value nowadays is in the recipes, not in the ingredients.
SAMPLES OF THE EVIDENCE
Nature Outweighs Nurture
Bruce Sacerdote’s “What Happens When We Randomly Assign Children to Families?” (October 2004) directly addresses the issue of nature versus nurture. Wading through the statistics, we come to this key conclusion:
[T]ransmission of education and income for adoptees is much less strong than for non-adoptees. Hence, by definition, either initial endowments [i.e., genetically transmitted traits] or the interaction between family environment and initial endowments must be driving a large portion of the transmission of income and education to children.
In sum, according to “Nature versus nurture” at Wikipedia,
[e]vidence suggests that family environmental factors may have an effect upon childhood IQ, accounting for up to a quarter of the variance. On the other hand, by late adolescence this correlation disappears, such that adoptive siblings are no more similar in IQ than strangers.[5] Moreover, adoption studies indicate that, by adulthood, adoptive siblings are no more similar in IQ than strangers (IQ correlation near zero), while full siblings show an IQ correlation of 0.6. Twin studies reinforce this pattern: monozygotic (identical) twins raised separately are highly similar in IQ (0.86), more so than dizygotic (fraternal) twins raised together (0.6) and much more than adoptive siblings (~0.0). [6] Consequently, in the context of the “nature versus nurture” debate, the “nature” component appears to be much more important than the “nurture” component in explaining IQ variance in the general adult population of the United States.
Cultural Differences That Influence Income Are Heritable
I turn now to Nicholas Wade of The New York Times, whose International Herald Tribune article (“Cultural Differences: A DNA Link?,” March 2006) suggests that an
explanation for such long- lasting character traits [as social interdependence] may be emerging from the human genome. Humans have continued to evolve throughout prehistory and perhaps to the present day, according to a new analysis of the genome reported last week by Jonathan Pritchard, a population geneticist at the University of Chicago.
So human nature may have evolved as well.
If so, scientists and historians say, a fresh look at history may be in order. Evolutionary changes in the genome could help explain cultural traits that last over many generations as societies adapted to different local pressures….
In a study of East Asians, Europeans and Africans, Pritchard and his colleagues found 700 regions of the genome where genes appear to have been reshaped by natural selection in recent times. In East Asians, the average date of these selection events is 6,600 years ago….
Some of the genes are active in the brain and, although their role is not known, may have affected behavior….
Some geneticists believe the variations they are seeing in the human genome are so recent that they may help explain historical processes.
“Since it looks like there has been significant evolutionary change over historical time, we’re going to have to rewrite every history book ever written,” said Gregory Cochran, a population geneticist at the University of Utah.
“The distribution of genes influencing relevant psychological traits must have been different in Rome than it is today,” he added. “The past is not just another country but an entirely different kind of people.”
John McNeill, a historian at Georgetown University in Washington, said “it should be no surprise to anyone that human nature is not a constant” and that selective pressures have probably been stronger in the last 10,000 years than at any other epoch in human evolution….
The political scientist Francis Fukuyama has distinguished between high-trust and low-trust societies, arguing that trust is a basis for prosperity. Since his 1995 book on the subject, researchers have found that oxytocin, a chemical active in the brain, increases the level of trust, at least in psychological experiments.
Oxytocin levels are known to be under genetic control in other mammals.
It is easy to imagine that in societies where trust pays off, generation after generation, the more trusting individuals would have more progeny and the oxytocin-promoting genes would become more common in the population.
If conditions should then change, and the society be engulfed by strife and civil warfare for generations, oxytocin levels might fall as the paranoid produced more progeny.
Napoleon Chagnon for many decades studied the Yanomamo, a warlike people who live in the forests of Brazil and Venezuela. He found that men who had killed in battle had three times as many children as those who had not. Since personality is heritable, this would be a mechanism for Yanomamo nature to evolve and become fiercer than usual.
Since the agricultural revolution, humans have to a large extent created their own environment. But that does not mean the genome has ceased to evolve. The genome can respond to cultural practices as well as to any other kind of change.
Northern Europeans, for instance, are known to have responded genetically to the drinking of cow’s milk, a practice that began in the Funnel Beaker Culture that thrived 5,000 to 6,000 years ago. They developed lactose tolerance, the unusual ability to digest lactose in adulthood….
The most recent example of a society’s possible genetic response to its circumstances is one advanced by Cochran and Henry Harpending, an anthropologist at the University of Utah.
In an article last year they argued that the unusual pattern of genetic diseases found among Ashkenazi Jews (those of Central and Eastern Europe) was a response to the demands for increased intelligence imposed when Jews were largely confined to the intellectually demanding professions of money lending and tax collection.
Though this period lasted only from A.D. 900 to about 1700, it was long enough, the two scientists argue, for natural selection to favor any variant gene that enhanced cognitive ability….
But the variant genes common among the Ashkenazi do not protect against any known disease. In the Cochran and Harpending thesis, the genes were a response to the demanding social niche into which Ashkenazi Jews were forced and the nimbleness required to be useful to their unpredictable hosts.
No one has yet tested the Cochran-Harpending thesis, which remains just an interesting, though well worked out, conjecture. But one of its predictions is that the same genes should be targets of selection in any other population where there is a demand for greater cognitive skills. That demand might have well have arisen among the first settled societies where people had to deal with the quite novel concepts of surpluses, property, value and quantification.
And indeed Pritchard’s team detected strong selection among East Asians in the region of the gene that causes Gaucher’s disease, one of the variant genes common among Ashkenazim.
Intelligence and Race
To this point I have reviewed evidence that nature (i.e., genetic inheritance) generally outweighs nurture (i.e., environmental factors) in determining intelligence and income. Also, I have reviewed evidence that suggests the heritability of certain cultural traits (e.g., the kind of group solidarity that leads to economic betterment). Consider, now, some evidence about intelligence as it relates directly to race.
From “Race and Intelligence” at Wikipedia:
The modern controversy surrounding intelligence and race focuses on the results of IQ studies conducted during the 20th century, mainly in the United States and some other industrialized nations. In almost every testing situation where tests were administered and evaluated correctly, the mean IQ of Blacks was approximately one standard deviation below that of Whites. [That is, the average white person has an IQ higher than about two-thirds of all black persons: ED.]….
It is a matter of debate whether IQ differences between races in the U.S. are…entirely environmental or…partly genetic. Several published consensus statements agree that the large differences between the average IQ scores of Blacks and Whites in the U.S. cannot be attributed to biases in test construction, nor can they be explained just by simple differences in socio-economic status, however they are still well with in the range that may be attributed to other environmental factors….
But are inter-racial IQ differences “well within the range that may be attributed to…environmental factors”? Charles Murray, writing in Commentary about two years ago (article now behind paywall), reviews what had been learned about gender, race, and IQ since the publication of his (and the late Richard Herrnstein’s) The Bell Curve (1994). As for race, Murray reviews the evidence at length and concludes
that we know two facts beyond much doubt. First, the conventional environmental explanation of the black-white difference [in IQ] is inadequate. Poverty, bad schools, and racism, which seem such obvious culprits, do not explain it. Insofar as the environment is the cause, it is not the sort of environment we know how to change, and we have tried every practical remedy that anyone has been able to think of. Second, regardless of one’s reading of the competing arguments, we are left with an IQ difference that has, at best, narrowed by only a few points over the last century. I can find nothing in the history of this difference, or in what we have learned about its causes over the last ten years, to suggest that any faster change is in our future.
John J. Ray, an Australian psychometrician, observes that
[McElwain and Kearney] constructed a test that WAS biased — but biased towards blacks rather than towards whites. They included in their test (the Queensland Test or QT) only those items that blacks responded well to and which actually could be shown to be valid predictors of problem solving performance among blacks. In effect, blacks constructed the test themselves — by providing the responses used to select the individual questions within the test.
But you know what happened, don’t you? On a test intrinsically biased against them, whites still greatly outperformed blacks. So there really is an underlying difference between blacks and whites. The difference is not just the result of naively constructed tests.
Some (e.g., Thomas Sowell) have argued that the persistence of the inter-racial IQ gap is owed to black culture — “black redneck” culture, in Sowell’s words. But, as I say here,
[i]f “black redneck” culture is the cause of the inter-racial gap in IQ, and if blacks choose to perpetuate the “black redneck” culture, then the perpetuation of the IQ gap might as well be genetic. For, it will be the result of blacks’ self-imposed servitude to the forces of ignorance.
And it well may be that the “black redneck” culture has become a genetically heritable trait.
Finally, on this topic, let us hear again from Rushton. In a review of Lynn’s book, Race Differences in Intelligence: An Evolutionary Analysis (2006), he says:
Lynn’s book represents the culmination of more than a quarter of a century’s work on race differences in intelligence. It was in 1977 that he first ventured into this field – some would say minefield – with the publication of two papers on the IQ in Japan and Singapore. Both showed that the East Asians obtained higher means than white Europeans in the United States and Britain….
His conclusions are that the East Asians (Chinese, Japanese and Koreans) have the highest mean IQ at 105. These are followed by the Europeans (IQ 100). Some way below these are the Inuit (Eskimos) (IQ 91), South East Asians (IQ 87), Native American Indians (IQ 87), Pacific Islanders (IQ 85), South Asians and North Africans (IQ 84). Well below these come the sub-Saharan Africans (IQ 67) followed by the Australian Aborigines (IQ 62). The least intelligent races are the Bushmen of the Kalahari desert together with the Pygmies of the Congo rain forests (IQ 54).
After the ten chapters setting out the evidence for each of the ten races there follows a chapter on the reliability and validity of the measures. These show that the studies have high reliability in the sense that different studies of racial IQs give closely similar results. For instance, East Asians invariably obtain high IQs, not only in their own native homelands but in Singapore, Malaysia, Hawaii and North America. To establish the validity of the racial IQs he shows that they have high correlations with performance in the international studies of achievement in mathematics and science. Racial IQs also have high correlations with national economic development, providing a major contribution to the problem of why the peoples of some nations are rich and others poor. He argues further that the IQ differences between the races explain the differences in achievement in making the Neolithic transition from hunter-gathering to settled agriculture, the building of early civilizations, and the development of mature civilizations during the last two thousand years.
Lynn tackles the problem of the environmental and genetic determinants of race differences in intelligence and concludes that these contribute about equally to the phenotypic differences. He argues that the consistency of racial IQs in many different locations can only be explained by powerful genetic factors….
He elaborates the argument he has advanced over the last fifteen years that the race differences in intelligence have evolved as adaptations to colder environments as early humans migrated out of Africa. In North Africa and South Asia, and even more in Europe and Northeast Asia, these early humans encountered the problems of having to survive during cold winters when there were no plant foods and they had to hunt big game to survive. They also had to solve the problems of keeping warm. These required greater intelligence than was needed in tropical and semi-tropical equatorial Africa where plant foods are plentiful throughout the year….His analysis relating race differences in intelligence to exposure to low winter temperatures has recently been independently corroborated by Templer and Arikawa (2005)….
To the arguments presented by Jensen (1998) for a substantial genetic determination of the difference in intelligence between blacks and whites in the United States, Lynn adds a more general one. He advances the general principle of evolutionary biology that wherever subspecies, strains or races have evolved in different environments they invariably develop differences in all characteristics for which there is genetic variation as a result of mutations occurring in some subspecies and of adaptations to different environments, and asserts that intelligence cannot be an exception. He concludes witheringly that:
“The position of environmentalists that over the course of some 100,000 years peoples separated by geographical barriers in different parts of the world evolved into ten different races with pronounced genetic differences in morphology, blood groups and the incidence of genetic diseases, and yet have identical genotypes for intelligence, is so improbable that those who advance it must either be totally ignorant of the basic principles of evolutionary biology or else have a political agenda to deny the importance of race. Or both.”
Intelligence and Gender
On to the gender gap in IQ. There is a male-female gap, in favor of males, but it is much smaller than the black-white gap. In “Sex differences on the progressive matrices: A meta-analysis,” Intelligence, September-October 2004) Richard Lynn and Paul Irwing report this:
A meta-analysis…of 57 studies of sex differences in general population samples on [Raven’s] Progressive Matrices….showed that there is no difference among children aged 6–14 years, but that males obtain higher means from the age of 15 through to old age. Among adults, the male advantage is…equivalent to 5 IQ points. These results disconfirm the frequent assertion than there are no sex differences on the progressive matrices and support a developmental theory that a male advantage appears from the age of 15 years….
Given that [an] increasing female advantage in educational achievement coexists with somewhat lower scores among adult women on the progressive matrices, it can be inferred that there are other factors predominantly possessed by women that facilitate this achievement. Possibly, this may be stronger work motivation. Thus, it has been found in the United States that women obtain lower mean scores on the SAT-M [Scholastic Aptitude Test for Mathematics] but they did not obtain lower math grades (Wainer & Steinberg, 1992). The most probable explanation is that women’s stronger work motivation compensates for their lower test scores.
Rushton and Douglas N. Jackson confirm the male-female IQ gap in “Males have greater g: Sex differences in general mental ability from 100,000 17- to 18-year olds on the Scholastic Assessment Test” (Intelligence, September-October 2006). This is from the abstract:
In this study we found that 17- to 18-year old males averaged 3.63 IQ points higher than did their female counterparts on the 1991 Scholastic Assessment Test (SAT). We analysed 145 item responses from 46,509 males and 56,007 females (total N=102,516) using a principal components procedure. We found (1) the g factor [general intelligence] underlies both the SAT Verbal (SAT-V) and the SAT Mathematics (SAT-M) scales with the congruence between these components greater than 0.90; (2) the g components predict undergraduate grades better than do the traditionally used SAT-V and SAT-M scales; (3) the male and the female g factors are congruent in excess of .99; (4) male–female differences in g have a point-biserial effect size of 0.12 favoring males (equivalent to 3.63 IQ points); (5) male–female differences in g are present throughout the entire distribution of scores; (6) male–female differences in g are found at every socioeconomic level; and (7) male–female differences in g are found across several ethnic groups. We conclude that while the magnitude of the male–female difference in g is not large, it is real and non-trivial.
Jennifer Roback Morse, writing at Townhall.com on the concept of male-female equality, adds this:
Cambridge professor of Psychology and Psychiatrist Simon Baron-Cohen [who] reports on numerous studies that have found differences in skill levels between men and women. In his book, The Essential Difference: the Truth about the Male and Female Brain, Dr. Baron-Cohen explains that sex differences in math have been documented in children as young as seven years old. And when you look at the different aspects of math, an even more interesting fact emerges. There is no difference in the ability to calculate, or the “primary mathematical abilities.” The difference shows up in the “secondary abilities,” such as geometry, spatial relationships and problem-solving.
For instance, boys tend to perform better than girls at a test called the Mental Rotation Test. The examiner shows someone two shapes and asks whether they are mirror images of each other. This ability to visualize a shape even when rotated in space helps in a whole variety of other skills, including building things from plans, interpreting schematic drawings, tying knots or reading maps.
That is to say, males generally outperform females in key dimensions of intelligence, such as the capacity to reason, solve problems, and think abstractly. Why? Because male and female brains differ in fundamental ways. To put it another way, the female genome produces a somewhat different brain structure than that of the male genome.
Intelligence and Income: Intra-National Differences
Intelligence correlates with income and race on two levels: intra-nationally (within the U.S.) and internationally. Looking at the U.S., let us begin here:
Relation between IQ and earnings in the U.S.
| IQ |
<75 |
75–90 |
90–110 |
110–125 |
>125 |
| Age 18 |
2,000 |
5,000 |
8,000 |
8,000 |
21,000 |
| Age 26 |
3,000 |
10,000 |
16,000 |
20,000 |
42,000 |
| Age 32 |
5,000 |
12,400 |
20,000 |
27,000 |
48,000 |
| Values are the average earnings (1993 US Dollars) of each IQ sub-population. |
Next, consider this, from La Griffe du Lion, writing in March 2000:
Figure 3 shows how math SAT scores increase with family income for both whites and blacks….However, black students from families earning more than $70,000 (1995 dollars) score lower than white students whose families earned less than $10,000. Figure 4 shows more of the same for the verbal SAT. Here too, the wealthiest blacks score below the poorest whites. (Complete data can be found in Appendix B.)

For more, we go to the abstract of Anne Case and Christine Paxson’s NBER Working Paper No. 12466 (“Stature and Status: Height, Ability, and Labor Market Outcomes,” August 2006):
On average, taller people earn more because they are smarter. As early as age 3 — before schooling has had a chance to play a role — and throughout childhood, taller children perform significantly better on cognitive tests. The correlation between height in childhood and adulthood is approximately 0.7 for both men and women, so that tall children are much more likely to become tall adults. As adults, taller individuals are more likely to select into higher paying occupations that require more advanced verbal and numerical skills and greater intelligence, for which they earn handsome returns. Using four data sets from the US and the UK, we find that the height premium in adult earnings can be explained by childhood scores on cognitive tests. Furthermore, we show that taller adults select into occupations that have higher cognitive skill requirements and lower physical skill demands.
Finally, on the intra-national level, there is Jay L. Zagorsky’s paper, “Do you have to be smart to be rich? The impact of IQ on income, wealth, and financial distress.” (The paper, which has received much publicity, is still “in press” at the journal, Intelligence.) Zagorsky confirms the positive relationship between IQ and income but then, anomalously, posits no relationship between IQ and wealth (i.e., net worth):
How important is intelligence to financial success? Using the NLSY79, which tracks a large group of young U.S. baby boomers, this research shows that each point increase in IQ test scores raises income by between $234 and $616 per year after holding a variety of factors constant. Regression results suggest no statistically distinguishable relationship between IQ scores and wealth. Financial distress, such as problems paying bills, going bankrupt or reaching credit card limits, is related to IQ scores not linearly but instead in a quadratic relationship. This means higher IQ scores sometimes increase the probability of being in financial difficulty.
How could IQ positively affect income but not wealth, given that (for most of us) wealth is derived from income? Zagorsky doesn’t know, and admits as much; all he offers are non-quantitative guesses. Many others have made much of Zagorsky’s “findings” (envious Leftists, for the most part), but I have not yet found a critique of it by an academic economist. (It may be too soon for that; the paper was published only a few months ago.)
Here are some of my reactions to the paper. To begin with, IQ, wealth, and income are highly correlated, as you might expect. This is from Zagorsky’s paper:
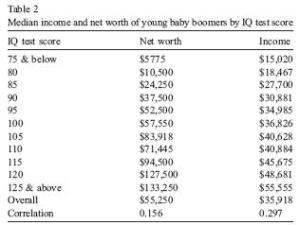 The correlations at the bottom of the table are Zagorsky’s stated correlations between between IQ and net worth and IQ and income, respectively. Those correlations are for the entire data set (N=7403). But the correlations for the data given in table are as follows:
IQ and net worth — 0.981
IQ and income — 0.984
Net worth and income — 0.970
The point is that the low correlations reported by Zagorsky are, in fact, significant. There is a lot of “noise” in the data, but the underlying trends are what you would expect. That leads me to suspect that Zagorsky set out to find what he found. Here are some of my concerns and objections about what he found and how he found it:
- There is the obvious anomaly in table 2, at the cell represented by IQ 110, where (a) net worth is lower than at IQ 105 and (b) income is barely higher than at IQ 105. How could that be if there are about 700 for that IQ cell, as one would expect given 11 IQ cells and a sample size >700?
- For married persons, Zagorsky divided family income and wealth by two, so as to avoid a “bias” toward married persons. What that does, of course, is bias the results toward single persons, who generally earn less and have less wealth than married persons. (See, for example, the correlations for “ever married” and “divorced” in table 1 of the paper.) The income and wealth of a married person is his or her income and wealth, legal fictions aside. Family income and wealth is higher but not fully accounted for because the income and wealth contributed by a “non-working” spouse generally goes unrecognized. Dividing the income and wealth of married persons in half is a shady trick and/or an indication of Zagorsky’s incompetence.
- In any event, Zagorsky wasn’t satisfied with the obviously strong relationships between IQ, income and wealth, so he used regression analysis to “control” for other factors other than income that might determine wealth. In the end, Zagorsky simply runs regression after regression, most of them meaningless because he uses the “kitchen sink” style of analysis: throwing in every variable at hand (e.g., siblings, ever married, ever divorced, heavy smoker, light smoker, and self-esteem(?)). It is regression analysis at its worst: a data-mining fishing expedition, pure and simple.
- Where Zagorsky reports the results of regressions on a limited number of (mostly) relevant variables (table 3), the regression that best fits the data (highest r-squared) yields a positive coefficient on IQ.
- Zagorsky draws largely on self-reported survey data (a major weakness, in itself) for persons aged 40 to 47 years. That is, Zagorsky’s sample represents persons who, for the most part, are a decade or three from their peak earnings and wealth. And persons with higher IQs will tend to accumulate wealth more rapidly than those with lower IQs because (a) they will have learned more from their past mistakes and (b) over a decade or three wealth usually grows at a rate that is closer to exponential than linear (compound interest, stocks for the long run, and all that).
- Finally, it is clear that Zagorsky is in over his head. He is not an economist or statistician but, rather, some kind of sociologist. His home base is Ohio State’s Center for Human Resource Research. Some of his other research (if you can call it that) undermines the so-called findings that I have summarized here.
In sum, Zagorsky’s paper is junk. I felt obliged to acknowledge it because the “finding” about IQ and wealth garnered a lot of attention when the paper was published earlier this year.
Intelligence and Income: International Differences
I return to Rushton’s review of Lynn’s Race Differences: An Evolutionary Analysis:
Lynn’s book…tak[es] a global perspective and consists of a review more than 500 studies published world wide from the beginning of the twentieth century up to the present. He devotes a chapter to each of ten races, differentiated by Cavalli-Sforza, Menozzi and Piazza (1994) into “genetic clusters”, which he regards as a transparent euphemism for races.
His conclusions are that the East Asians (Chinese, Japanese and Koreans) have the highest mean IQ at 105. These are followed by the Europeans (IQ 100). Some way below these are the Inuit (Eskimos) (IQ 91), South East Asians (IQ 87), Native American Indians (IQ 87), Pacific Islanders (IQ 85), South Asians and North Africans (IQ 84). Well below these come the sub-Saharan Africans (IQ 67) followed by the Australian Aborigines (IQ 62). The least intelligent races are the Bushmen of the Kalahari desert together with the Pygmies of the Congo rain forests (IQ 54).
After the ten chapters setting out the evidence for each of the ten races there follows a chapter on the reliability and validity of the measures. These show that the studies have high reliability in the sense that different studies of racial IQs give closely similar results. For instance, East Asians invariably obtain high IQs, not only in their own native homelands but in Singapore, Malaysia, Hawaii and North America. To establish the validity of the racial IQs he shows that they have high correlations with performance in the international studies of achievement in mathematics and science. Racial IQs also have high correlations with national economic development, providing a major contribution to the problem of why the peoples of some nations are rich and others poor. He argues further that the IQ differences between the races explain the differences in achievement in making the Neolithic transition from hunter-gathering to settled agriculture, the building of early civilizations, and the development of mature civilizations during the last two thousand years.
Lynn tackles the problem of the environmental and genetic determinants of race differences in intelligence and concludes that these contribute about equally to the phenotypic differences. He argues that the consistency of racial IQs in many different locations can only be explained by powerful genetic factors. He works out the genetic contribution in most detail for the sub-Saharan Africans. His argument is that sub-Saharan Africans in the United States experience the same environment as whites, as regards determinants of intelligence. He argues that they have as good nutrition as whites, as shown by their having the same average height in studies going back to World War 1, and they have approximately the same education as whites. He presents evidence that blacks in the southern states have very little white ancestry and have an IQ of about 80, and that proposes that this can be adopted as the genotypic IQ of blacks, i.e. the IQ that blacks attain when they are reared in the same environment as whites. The IQ of blacks in sub-Saharan Africa is a good deal lower at 67. Hence, the adverse environment in sub-Saharan Africa, which he regards as consisting principally of poor nutrition and health, contributes about 13 IQ points to the low IQ in sub-Saharan Africa. Lynn’s estimate is not too different from that advanced in 1969 by Jensen to the effect that about two thirds of the low IQ of blacks in the United States is attributable to genetic factors, and the more recent estimate of Rushton and Jensen (2005) that the figure is around 80 percent. Lynn has (unsurprisingly for those familiar with his work) put a bit more weight on the genetic factor.
Lynn (with Tatu Vanhannen) had earlier (2002) written IQ and the Wealth of Nations (summary and criticisms, here). That book seems to be an outgrowth of a Lynn-Vanhannen article in The Mankind Quarterly (“National IQ and Economic Development: A Study of Eighty-One Developing Nations,” Summer 2001). (For corroboration of Lynn and Vanhannen’s findings about the positive influence of IQ on national output, see Garrett Jones and W. Joel Schneider’s “Intelligence, Human Capital, and Economic Growth: A Bayesian Averaging of Classical Estimates (BACE) Approach,” June 2005.)
Gerhard Meisenberg, writing in “IQ Population Genetics: It’s Not as Simple as You Think” (The Mankind Quarterly, Winter 2003), offers a comprehensive view of the evolutionary causes of IQ differences across geographic regions and the effects of those differences on GDP. Meisenberg draws on the Lynn-Vanhannen data and many other sources. Meisenberg says that
[s]ome scholars, most notably Richard Lynn and Philippe Rushton, propose climate and ecology as selective forces. According to Lynn, the dependence on big-game hunting in northern climates necessitated complex social organization with efficient cooperation and intelligent planning, while tropical populations could always fall back on cognitively undemanding food gathering (Lynn, 1991).
Rushton emphasizes the need for close family ties and high parental investment in harsh climates. While most childhood mortality in the tropics was caused by uncontrollable endemic diseases, most childhood mortality in the arctic was due to the predictable challenges of seasonal food shortages and the rigors of the climate. These challenges demanded intelligent planning in addition to stable families (Rushton, 1995).
These theories postulate that physical and cognitive race differences evolved at roughly the same time, starting about 100,000 years ago when modern humans first ventured out of the tropics and into the inhospitable wastelands of central and northern Asia. Thus both Lynn and Rushton predict that intelligence genes cluster with climate-selected physical traits such as skin color. Both make the specific prediction that intelligence is highest in Mongoloids, lowest in Negroids, and intermediate in Caucasoids.
This prediction is borne out by the data in Table 1. The average IQ is 97.1 for Mongoloids, 93.9 for Caucasoids, and 69.6 for Negroids. IQ also correlates with latitude (Pearson’s r = 0.7559) and per-capita GDP (r = 0.7348). However, in multiple regression models with either latitude or GDP or both as copredictors of IQ, race remains a statistically significant predictor at the P
La Griffe du Lion has solved the puzzle. First, some background. La Griffe’s analysis of March 2002, highlights the “puzzle”:
In Figure 2, the [Lynn-Vanhannen] data [table here] is [sic] divided into contributions from four groups: blacks, (European) whites, East Asians and “others.” I did not include the outliers: South Africa, Barbados, Qatar and China.
Figure 2. Per capita GDP by racial group. “White” here means European white; “East Asian” means the racially homogenous polities: Taiwan, South Korea, Hong Kong, and Japan.
La Griffe, in a later post (May 2004) addresses the seeming anomaly in the relationship between IQ and GDP. As shown in the figure directly above, four East Asian (or Northeast Asian) countries (Hong Kong, South Korea, Japan, and Taiwan), which have the highest average IQs, do not have the highest per capita GDPs. The short of it is this: GDP is best explained by verbal IQ, as opposed to a measure of IQ that encompasses both verbal and quantitative skills. Thus figure 7:
 La Griffe observes that the IQ of (North)east Asians
is bifurcated. NE Asians have the highest IQ of all peoples other than Ashkenazim. They owe that superior IQ, however, to extraordinary visuospatial ability, which, despite verbal shortcomings, lifts their IQ above that of Europeans….
Among the races, only NE Asians and Amerindians exhibit this particular kind of verbal-nonverbal cognitive split. For other races verbal and general IQ averages have similar values, making the distinction between the two transparent to smart fraction theory. In the 12 studies reporting both general and verbal IQ for NE Asians, the general-verbal gap averaged 6.5 IQ points….
[T]he spectacular visuospatial ability of NE Asians, while accounting for their high [overall] IQ scores, does not necessarily make them good capitalists. Hunting strategies have little to do with wealth production. And a new tool, irrespective of point of origin, is now soon available worldwide. The structure of NE Asian intelligence did not come about in response to pressures to be attorneys or editors or production managers or copywriters or salesmen or programmers or systems analysts or insurance adjusters or purchasing agents or account executives.
In sum, IQ strongly determines both personal income and, therefore, per capita GDP. Verbal IQ turns out to be an important (negative) determinant of income in those (few) cases where it is a relatively weak component of overall IQ.
But what about the influence of income on IQ? Let’s return to Meisenberg’s article:
The massive rise of IQ that took place in many countries over the past century shows conclusively that environmental effects can have a powerful effect on the average intellectual level of large populations. Presumably one or another aspect of “standard of living” is responsible for this secular trend: education, nutrition, health care, mass media, or, most likely, a combination of all of these.
Gross domestic product adjusted for purchasing power (GDP in Table 1) is an indicator for the population’s “standard of living”. If a high standard of living does indeed raise IQ test performance, then GDP should be an independent predictor of national IQ even when the effects of race and latitude are partialled out.
When race, latitude and GDP are used as co-predictors, GDP does indeed have an independent effect in predicting national IQ (P = 0.0007). In this model, race and latitude remain powerful independent predictors, each with P Flynn effect [link added: ED] these results suggest that the causal arrow points both ways. High intelligence produces a high standard of living, which in turn raises intelligence even more. Thus intelligence and economic development are mutually reinforcing in a positive feedback loop….
This feedback loop explains…the rise in mental test performance that has become known as the Flynn effect.
This feedback loop between intelligence and standard of living can explain the great magnitude of the IQ differences between nations. It predicts that even in cases where genetic differences affecting mental ability are small, the observed phenotypic differences become amplified because the slightly more gifted populations achieve a higher standard of living which raises their measured intelligence even more, which in turn raises their standard of living yet further. Similar “amplifier effects” have previously been proposed as explanations for the Flynn effect (Dickens and Flynn, 2001).
There you have it: The smarter get richer and the richer get smarter, not at the expense of the poorer and not-as-smart but by virtue of their genes and the material advantages afforded by those genes. Forceful transfers of income and wealth from the smarter and richer to the not-so-mart and poorer might be helpful to the latter — but more likely not, as I argue earlier. But such transfers definitely diminish the ability of the smarter and richer to help the not-so-smart in more lastingly productive ways: through technological advancement, job creation, mutually beneficial trade, and well-targeted charity.
CONCLUSION
Redistribution in an effort to make us “more equal” is not only counterproductive and unfair, it is futile. Or if not entirely futile, largely wasteful. All human beings (or at least those who are citizens and lawful residents of the U.S.) deserve equal rights. But the equal rights they deserve are the negative rights of the original Constitution, not the positive rights sought by generations of so-called liberals and progressives. There is nothing “liberal” or “progressive” (in the root meanings of those words) about redistribution.
Some related posts:
The Cost of Affirmative Action
Affirmative Action: A Modest Proposal
Race, Intelligence, and Affirmative Action
Affirmative Action: Two Views from the Academy
Affirmative Action, One More Time
Much Food for Thought
After the Bell Curve
A Footnote . . .
The Main Causes of Prosperity
Why Class Warfare Is Bad for Everyone
Fighting Myths with Facts
Debunking More Myths about Income Inequality
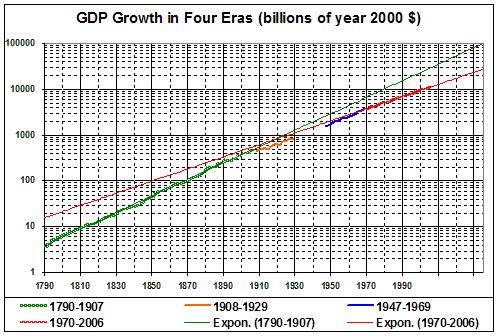
A Century of Progress?
Socialist Calculation and the Turing Test
Taxes, Charitable Giving, and Republicanism
Productivity Growth and Tax Cuts
Zero-Sum Thinking
Liberty, General Welfare, and the State
The Causes of Economic Growth
Republicanism, Economic Freedom, and Charitable Giving
The Last(?) Word about Income Inequality
Status, Spite, Envy, and Income Redistribution
Things to Come
__________
* The more controversial scientists whose work I sample here are Charles Murray, J. Phillipe Rushton, Richard Lynn, and Napoleon Chagnon.
Murray is controversial mainly for The Bell Curve, which brought to a wide audience the large body of long-standing evidence of persistent inter-racial differences in IQ. Rushton and Lynn are controversial because of their findings on race, gender, and intelligence, and because of their affiliation with the Pioneer Fund. The Fund’s roots and some of its current connections are tainted with the label “white supremacist.” The Fund (website here) has responded to those allegations. Whether Rushton, Lynn, and others who produce similar research are white supremacists is beside the question of the validity of their research. Judge for yourself.
Chagnon is controversial for other reasons, namely the ethics (or purported lack thereof) in his field work. (For Chagnon’s statements about the controversy, go here. See also Steven Malanga’s review of Chagnon’s Noble Savages, “Welcome to the Jungle,” City Journal, April 13, 2014.) In the “small world” department, I note that Chagnon hails from the village where my maternal grandparents raised ten children. The doctor who delivered many of those children bore the name Napoleon Chagnon. The sketchy biographical information about the anthropologist (p. 6, here) indicates that he was not the son of the medical doctor, but given the village’s small population (perhaps 500 when the anthropologist was born), it seems likely that he was related to and named for the medical doctor (a grandson, perhaps). And it was in honor of “old Doc Chagnon” that my maternal grandparents chose Napoleon as the middle name of the tenth and last of their children.