Hillary Clinton seems to be the “conservative” contender for the Democrat nomination. Who’d have thunk it fifteen years ago, when HillaryCare went down in flames?
But, fifteen years ago, who’d have thunk that the GOP would become Democrat-Lite?
Hillary Clinton seems to be the “conservative” contender for the Democrat nomination. Who’d have thunk it fifteen years ago, when HillaryCare went down in flames?
But, fifteen years ago, who’d have thunk that the GOP would become Democrat-Lite?
Barack Obama and his Obama-maniacs like to complain about “gotcha” politics and “distractions,” as if Obama’s relationships with whitey-hating Rev. Jeremiah Wright and unrepentant terrorist Bill Ayers have nothing to do with Obama’s fitness for the presidency. What Obama and his idolizers fear, of course, is the revelation of Obama’s political agenda, which he has succeeded in masking behind his “nice guy” persona, — in spite of his wife’s over-explained, anti-American slur, and his having (in 2007) the Left-most voting record among U.S. Senators.
Wolf Howling does an excellent job of piercing Obama’s defenses. WH also points to a similar analysis by the estimable Charles Krauthammer. I will not try to redo what WH and Krauthammer have done so well. My aim here is to address a charge that lurks in the background, if it hasn’t yet been raised by Obama, his camp, and his camp followers.
That charge? Raising the issue of Obama’s associations with Wright and Ayers is the kind of gutter politics that is sometimes called the politics of personal destruction, if it isn’t plain old racism. (My rule of thumb: The charge of racism in twenty-first century America is a first and last refuge of any politician or public figure who wants to shift the focus of debate from his own views, accomplishments, or agenda.)
It ain’t “personal destruction” if (a) it’s true and (b) it’s relevant to a person’s fitness to hold office (whether elected or appointed). Bill Clinton wasn’t a “victim” of the politics of personal destruction when he was impeached by the House of Representatives; he was a “victim” of his own perjury and deliberate failure to honor his oath of office.
As Wolf Howling and Charles Krauthammer explain so well, Barack Obama’s associations with Jeremiah Wright and Bill Ayers are a legitimate focus of attention. And those associations will remain a legitimate focus of attention for as long as Obama feeds at the public trough or seeks to do so.
UPDATED (04/09/08, 04/10/08)
According to economist Dani Rodrik, the author of the following graph (one Larry Bartels) claims to have shown that
[w]hen a Republican president is in power, people at the top of the income distribution experience much larger real income gains than those at the bottom–a difference of 1.5 percent per year going from the bottom to the top quintile in the income distribution. The situation is reversed when a Democrat is in power: those who benefit the most are the lower income groups.
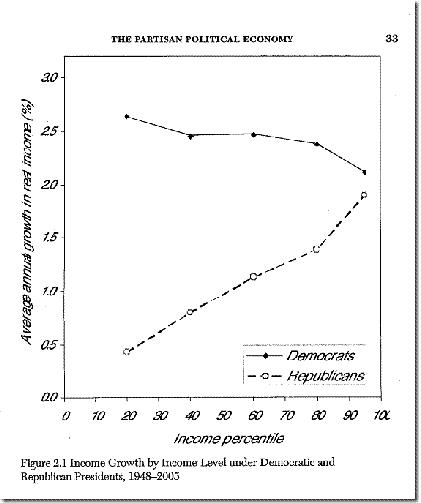
Source: Dani Rodrik’s Weblog, “American political economics in one picture.”
As I discuss below, the graph is deceptive because of the period it encompasses. Taking into account the downward trend in real GDP growth that began a century ago, and the timing of Democrat and Republican presidencies from Truman’s second term onward, the graph shows only this: Republican presidents (when they had congressional support) enacted tax and regulatory policies that encouraged economic growth. The rewards of stronger growth, naturally, went mainly (though not exclusively) to those who contributed the most to growth, namely, risk-takers and highly skilled persons. Conversely, Democrat presidents (when they had congressional support, which was more often) enacted tax and regulatory policies that discouraged economic growth, which harmed high earners more than low earners.
Nor is this table conclusive of anything:
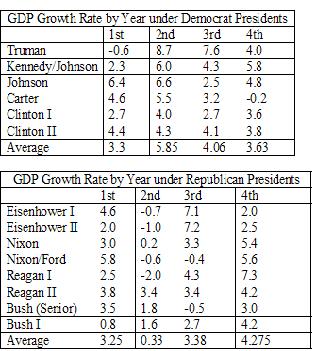
Source: Marginal Revolution, “More on Bartels“
The preceding graph and table both mask the long, downward trend in the real rate of GDP growth, which I document in this post. Thus:

Why the downward trend in real GDP growth? See this post. In sum, the downward trend is due to the policies of (most) presidents and Congresses since the early 1900s: deliberate expansion of the regulatory-welfare state, with almost no opposition from the Supreme Court after the mid-1930s.
Here’s a closer look at the GDP trend since Truman’s first year as an elected president:
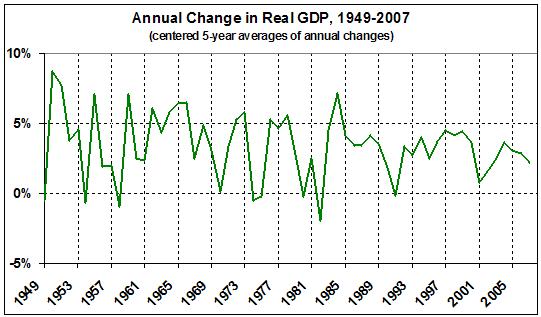
Source: Year-over-year changes in real GDP computed from estimates of real GDP available at Louis D. Johnston and Samuel H. Williamson, “What Was the U.S. GDP Then?“ MeasuringWorth.Com, 2008.
Given the long, downward trend in the real rate of GDP growth, it is statistical nonsense to pin the growth rate in any given year to a particular year of a particular president’s term. It is evident that GDP growth has been influenced mainly by the cumulative, anti-growth effects of government regulation. And GDP growth, in any given year, has been an almost-random variation on a downward theme.
As an additional piece of evidence for that proposition, I offer this: The strongest correlation between the year of a presidential term (i.e., first, second, etc.) and real GDP growth during 1949-2007 does not involve a one-year lag (as Dani Rodrik’s post suggests) but a one-year lead. There is a positive statistical relationship between growth rate and Democrat presidencies for the period 1949-2007 only because Democrats sat in the White House in half of the years from 1949 through 1981 and less than a third of the years after that. But Democrats weren’t responsible for the higher growth rate of those earlier years. They were, if anything, responsible for the lower growth rate of the later years. It took decades for the cumulative regulatory and redistributive effects of the New Deal, Fair Deal, and Great Society to be felt. But felt they were, eventually, even during the years of the so-called Clinton boom — when the liar-in-chief compounded them.
A more useful analysis of the influence of government policy on growth is found in this post. It is about the Laffer curve and the real stimulus afforded by tax cuts, regardless of the president’s party affiliation.
UPDATE: Paul Krugman, of course, is eager to believe the pseudo-relationship “discovered” by Bartels.
SECOND UPDATE: An analysis by The Corner‘s Jim Manzi corroborates my points.
I noted last week that Senator Obama has for some reason not taken the opportunity to put some of his Schedule C income into a tax-deferred retirement account. Now that Senator Clinton and her husband have released their tax return, I see they also passed up the chance…. I believe each of them could have put $44,000 into a SEP-IRA, but apparently, … they chose not to.
Why? I suggested two hypotheses for Senator Obama: bad tax advice or the expectation of much higher future tax rates. For the Clintons, a third hypothesis is possible: Given their substantial income ($16 million in 2006), the chance of sheltering $88,000 may be too trivial to bother with.
There is a fourth hypothesis: Bill spent the money at Emperors Club VIP or somewhere north of Bear Mountain Ridge. And a fifth one: He is still paying hush money to Susan McDougal and Webster Hubbell.
(I objected to muckraking about Sen. Debbie Stabenow’s husband, Thomas Athans, because he is not on a government payroll, as far as I know. Ex-president (fortunately) Bill Clinton receives a large government pension, a munificent expense account, lavish offices, a pre-humous memorial in the form of a presidential library, and costly Secret Service protection because of the office he once held, thanks (not) to H. Ross Perot. Clinton (born William Jefferson Blyth III) is a “public figure” of the second-worst sort: in a class with James Earl “Jimmy” Carter, though not as foul as Mohammed Abdel Rahman Abdel Raouf Arafat al-Qudwa al-Husseini, Mao Tse-tung, Ioseb Vissarionovich Jugashvili, or Adolf (Schicklgruber) Hiedler. Given Clinton’s detestable performance as governor, president and ex-president — and the fact that he is the only president to have plea-bargained his way out of a perjury charge — he deserves more ridicule than any thousand writers could heap on him in a millennium of trying.)
The follies of Thomas Athans, husband of Senator Debbie Stabenow (D-Mich.), shouldn’t be an occasion for gloating by right-wing outlets (e.g., Newsmax.com and Michelle Malkin’s eponymous blog). Athans is not a government official. Stabenow, who is an egregious senator in her own right, shouldn’t be judged by or held to account for her husband’s peccadilloes.
Malkin quite rightly points out, however, that Republicans — who in the election campaign of 2006 were accused of fomenting a “culture of corruption” — have no monopoly on corruption. Never did have. Never will have.
UPDATED 03/27/08
Scott Rasmussen’s tracking poll was the best of the bunch in 2004. Given Rasmussen’s credibility, I turn to his polls about general-election matchups for an accurate view of what the Rev. Wright hath wrought, with respect to Barack Obama’s presidential prospects. Obama’s chance of winning the Democrat nomination hasn’t fallen much (which says a lot about Democrats), but he has fallen behind Hillary Clinton as a prospective opponent of John McCain.
In other words, Clinton has (prospectively) become the tougher opponent for McCain, but mainly because of Obama’s slippage. McCain has gained significant ground against both Democrats. — adding 6 points to his lead over Clinton and notching a positive 14-point swing in his matchup with Obama. It isn’t due to MCain’s words or deeds, but to the Rev. Wright, Obama’s defense of black racism, and the Clinton-Obama mud-fest. (Cackle! Cackle!)
My ninth forecast (04/30/08) is here.
The Presidency – Method 1
Intrade posts State-by-State odds odds on the outcome of the presidential election in November. I assign all of a State’s electoral votes to the party whose nominee that is expected to win that State. Where the odds are 50-50, I split the State’s electoral votes between the two parties.
As of today, the odds point to this result:
Democrat — 298 electoral votes (EVs)
Republican — 240 EVs
The Presidency – Method 2
I have devised a “secret formula” for estimating the share of electoral votes cast for the winner of the presidential election. (The formula’s historical accuracy is described in my second forecast.) The formula currently yields these estimates of the outcome of this year’s presidential election:
Democrat — 261 to 307 EVs
Republican — 231 to 277 EVs
The GOP fares less well by method 2 than it did in my seventh forecast. But methods 1 and 2 have re-converged, which gives me more confidence in the estimates yielded by both.
U.S. Senate
Democrats will net three Senate seats: picking up one each in Colorado, New Hampshire, New Mexico, and Virginia; losing one in Louisiana. The balance in the Senate will change from 51 Democrats (including Lieberman and Sanders, both nominally independent) and 49 Republicans to 54 Democrats and 46 Republicans. The prospect of a GOP win in Louisiana is new since my seventh forecast.
Barack Obama’s white Leftist defenders are reprising an old form of racial condescension. Tom Wolfe called it “radical chic.” Wolfe coined the term in Radical Chic & Mau-Mauing the Flak Catchers to
describe[] an intriguing phenomenon of the late Sixties: the courting of romantic radicals—Black Panthers, striking grapeworkers, Young Lords—by New York’s socially elite.
Socially elite Leftists, that is.
Here’s an excerpt (of an excerpt) of Wolfe’s book:
…There seem to be a thousand stars above and a thousand stars below, a room full of stars a penthouse duplex full of stars, a Manhattan tower full of stars, with marvelous people drifting through the heavens, Jason Robards, John and D. D. Ryan, Gian-Carlo Menotti, Schuyler Chapin, Goddard Lieberson, Mike Nichols, Lillian Hellman, Larry Rivers, Aaron Copland, Richard Avedon, Milton and Amy Greene, Lukas Foss, Jennie Tourel, Samuel Barber, Jerome Robbins, Steve Sondheim, Adolph and Phyllis Green, Betty Comden, and the Patrick O’Neals . . .
. . . and now, in the season of Radical Chic, the Black Panthers. That huge Panther there, the one Felicia is smiling her tango smile at, is Robert Bay, who just forty-one hours ago was arrested in an altercation with the police, supposedly over a .38-caliber revolver that someone had, in a parked car in Queens at Northern Boulevard and 10th Street or some such unbelievable place and taken to jail on a most un-usual charge called “criminal facilitation.” And now he is out on bail and walking into Leonard and Felicia Bernstein’s thirteen-room penthouse duplex on Park Avenue. Harassment & Hassles, Guns & Pigs, Jail & Bail—they’re real, these Black Panthers. The very idea of them, these real revolutionaries, who actually put their lives on the line, runs through Lenny’s duplex like a rogue hormone….
The thrill of seeing Obama consort knowingly with anti-Americans (his wife, his pastor) must transport his fans on the Left into a Bernsteinian swoon of ecstasy.
Barack Obama’s speech about racism in America vied for blogospheric attention with today’s oral argument in District of Columbia v. Heller (the U.S. Supreme Court’s first Second Amendment case since 1939).
Here are some key passages from Obama’s speech:
The profound mistake of Reverend Wright’s sermons is not that he spoke about racism in our society. It’s that he spoke as if our society was static; as if no progress has been made; as if this country – a country that has made it possible for one of his own members to run for the highest office in the land and build a coalition of white and black; Latino and Asian, rich and poor, young and old — is still irrevocably bound to a tragic past. But what we know — what we have seen – is that America can change. That is true genius of this nation. What we have already achieved gives us hope – the audacity to hope – for what we can and must achieve tomorrow.
In the white community, the path to a more perfect union means acknowledging that what ails the African-American community does not just exist in the minds of black people; that the legacy of discrimination – and current incidents of discrimination, while less overt than in the past – are real and must be addressed. Not just with words, but with deeds – by investing in our schools and our communities; by enforcing our civil rights laws and ensuring fairness in our criminal justice system; by providing this generation with ladders of opportunity that were unavailable for previous generations. It requires all Americans to realize that your dreams do not have to come at the expense of my dreams; that investing in the health, welfare, and education of black and brown and white children will ultimately help all of America prosper….
This time we want to talk about the crumbling schools that are stealing the future of black children and white children and Asian children and Hispanic children and Native American children. This time we want to reject the cynicism that tells us that these kids can’t learn; that those kids who don’t look like us are somebody else’s problem. The children of America are not those kids, they are our kids, and we will not let them fall behind in a 21st century economy. Not this time.
This time we want to talk about how the lines in the Emergency Room are filled with whites and blacks and Hispanics who do not have health care; who don’t have the power on their own to overcome the special interests in Washington, but who can take them on if we do it together.
This time we want to talk about the shuttered mills that once provided a decent life for men and women of every race, and the homes for sale that once belonged to Americans from every religion, every region, every walk of life. This time we want to talk about the fact that the real problem is not that someone who doesn’t look like you might take your job; it’s that the corporation you work for will ship it overseas for nothing more than a profit.
It’s the politics of victimhood. It’s the politics of socialism. It’s the politics of class warfare. It’s the politics of economic ignorance. Not a word about cultural influences or dependency on the state. Not a word about the growth of real income at all levels (not just at the top). Not a word about upward economic mobility, which is the norm in America. Not a word about the fact that economic progress depends upon that “dirty” profit motive.
Obama’s speech may be “eloquent,” in some sense. But it fully reveals him for the dangerous demagogue that he is: a latter-day FDR.
As for the Second Amendment, I predict a 5-4 decision in D.C. v. Heller that upholds an individual right to own a handgun for the purpose of self-defense, subject to “reasonable” regulation in the interest of safety. Some of the dissenters will maintain, illogically, that handguns should be prohibited in jurisdictions with high rates of crime (e.g., D.C.). As if criminals honor bans on handgun ownership. And so it goes, in the upside-down world of liberalism.
Here.
Margaret Thatcher often is quoted as saying that “there is no such thing as society.” But when Mrs. Thatcher said that, she was arguing against the entitlement mindset, as in ” ‘society’ owes me a roof over my head and three meals a day.” As she put it, “people must look to themselves first. It’s our duty to look after ourselves and then, also to look after our neighbor.”
What Mrs. Thatcher meant to say is that people shouldn’t look to the state (and, thus, to taxpayers) for charity. “Look[ing] after our neighbor” is a clear acknowledgment of the primacy of society (as against the state) as the source of legitimate charity, that is, voluntary charity.
The question now becomes: What is society?
“Society” is not easily defined; it is a word with many meanings, most of them vague. In that respect, it resembles “culture.” And the two words sometimes are used to mean the same thing. Where to begin?
What Society Is Not, and Is
I begin by defining what society is not. It is not merely an economic arrangement: an arms’ length exchange of goods and services for mutual benefit. Nor is it merely a political arrangement, such as the vesting of power in a government for the purpose of making and enforcing laws within a specified geographical area.
There is more to society than economic and political arrangements. The “more” is mutual respect. Mutual respect implies trust, and with trust goes forbearance — a willingness to forgo retribution and violence for slights and trespasses, until one is mightily provoked. (That is why, for example, “redneck culture” is a culture — a way of life — but not the basis of a society.)
There are three outward signs of mutual respect: politeness, thoughtfulness, and neighborliness — practiced in combination, not singly or in twos. Politeness is simple civility: “please,” “thank you,” and the like. (Easier said than done, these days.) Thoughtfulness goes a step beyond politeness; it is seen in such simple acts as returning a stray animal to its owner or picking up litter along a public thoroughfare. Neighborliness (true voluntarism) goes well beyond thoughtfulness; it boils down to burden-sharing, that is, helping others in need through direct action (e.g., cutting a sick neighbor’s grass or bringing her a meal).
As the saying goes, “what goes around comes around.” Mutual respect is impossible where politeness, thoughtfulness, and neighborliness are met consistently with their opposites, which can be characterized as disdain, hostility, or enmity, depending on the virulence of the contrary behavior. To put it positively, by acting (or not acting) in certain ways we foster mutual respect, which repays us with the trust and forbearance of others. This is, of course, the “Golden Rule,” stated in other words.
Mutual respect, by my rigorous definition, is meaningless in the abstract; it must be tested and proved through continuous social contact. Mutual respect is therefore meaningful only to the extent that it is found among persons who are well known to each other and who have frequent social contact with each other. Family and work contacts, like cocktail-party contacts, may involve mere role-playing and politeness. You can pick your friends but not your family or, in most cases, your co-workers. This is not to rule out families and workplaces as venues for mutual respect, but simply to note that they do not rely on mutual respect for their sustenance.
Social Units, the Extent of a Society, and Alliances of Convenience
How many persons can be comprised in a cohesive social unit that adheres around mutual respect? An individual probably can have a relationship of mutual respect (as I define it) with no more than 150 persons (and probably far fewer). A cohesive social unit is most likely to be a nuclear family, an extended family, a rural community, a very small village (or part of a larger one), or a neighborhood in a town, suburb, or city.
A social unit can be likened to a physical atom: an entity with a nucleus (an individual or small number of tightly bonded individuals), surrounded by some number of other persons who are connected to the nucleus by mutual respect. Just as a chemically bonded group of atoms forms a compound, an interlocking network of social units forms a society. By interlocking network, I mean that some (perhaps most) members of each social unit (outside its nucleus) also are nuclei or members of other social units.
How far can a society extend; that is, how many interlocking social units can it comprise? That depends on the extent to which the various social units possess common socio-economic (i.e., cultural) characteristics. (See below.) For, though it is true that a culture does not make a society, a society is bound to have a dominant set of cultural characteristics. It is not in the nature of human beings to bond in mutual respect without the “glue” of core cultural values, or social norms. The more disparate the range of cultural characteristics in a given geographic area (such as the United States), the greater the number of distinct (and possibly antipathetic) societies will be found in that geographic area. This nation is not a society, even though the word “society” often is used (incorrectly) instead of “nation.”
What about those persons who are not members of a social unit? It takes no more than casual experience of life in cities and suburbs to confirm that most of the denizens thereof are not members. (Nodding acquaintances with neighbors, memberships in churches and clubs, and a few friendships with work associates do not a society make.) I am not denigrating those who live in social isolation — whether it is urban, suburban, or even rural — but merely saying that they are not members of a social unit, and that their numbers have been growing faster than the nation’s population. (For more on this point, see this article by Robert Putnam, author of Bowling Alone: America’s Declining Social Capital. See also this table, prepared by the Census Bureau, which documents the growing urbanization of America.)
There is no such thing as American society because not only are Americans too often socially isolated, but also they are too disparate in their cultural characteristics. What we have (for the most part) is not mutual respect but indifference and state-imposed order. More than that, we have state-imposed behavioral norms, which — in and of themselves — have contributed to the breakdown of societal bonds. We are left with some number of distinct (and probably dwindling) societies, around which are spread a vast number of unaffiliated, loosely affiliated, or simpatico individuals.
Distinct societies and unaffiliated persons may, despite their social separation, join in common cause. In the United States, for example, there was until recent decades broad agreement about the ends and means of ensuring “domestic tranquility” and providing for “the common defence.” But cultural diversity begets political strife, which intensifies as the state (goaded and led by élites) undermines traditional societies and their cultural values. The state becomes the arbiter of moral values and the dispenser of charity. The voluntary bonds that enable societies to persist over time — and to co-exist within a nation — are therefore frayed and, eventually, snapped. The nation becomes less like a collection of distinct societies joined by common purposes and more like scorpions fighting in a bottle. (For more on this point, see “The downside of diversity” at the online edition of The Boston Globe.)
Societies in the United States
What characteristics delineate the societies that are found in the United States? The most important characteristics are moral values: definitions of right and wrong actions. In this context, moral values are deeper than generalities (e.g., murder is wrong, terrorism is wrong, theft is wrong); they extend to specific practices (e.g., abortion is murder, terrorists have legitimate grievances, government-enforced theft is theft). Other salient characteristics are:
I do not mean to say that mutual respect is impossible among persons who possess different cultural characteristics. But persistent differences (especially on fundamentals such as morality) tend to strain mutual respect and, thus, mutual forbearance. When the strain is too great, mutual respect breaks down, and restraint must be state-imposed.
Each of the characteristics listed above, beginning with moral values and running down the list, is a potential source of unity and division. Certain characteristics often appear in clusters. Think, for example, of academics in the so-called liberal arts, who tend to be pro-abortion-anti-U.S.-socialistic moral relativists, strident atheists, Ph.D.s (in impractical specialties), “toilers” in the fields of mental esoterica, upper-half to upper-quintile earners, and effete in their tastes. Those who live near each other (in the vicinity of a particular campus, for example) may sometimes form a social unit — in spite of their innate misanthropy. But those social units will exclude unlike-minded persons and members of groups toward which they (the liberal-arts academics) feign compassion (e.g., poor blacks and Latins), while living securely in their comfortable enclaves.
Which brings me to the types of society that do exist in the U.S.:
Some types of society are extensive, regionally (e.g., Mexican immigrants in Texas, Muslim Arabs in southeastern Michigan). But there is no single, large society that extends throughout the United States. And there has not been one since the demise of the rather extensive societies of early America — notably, those societies whose members represented various regions of the British Isles.
Whether today’s rather fragmented and dispersed societies will persist is another question. The United States was long a “melting pot,” wherein education, out-marriage, economic progress, and geographic mobility tended to make generic “Americans” of immigrants. But that was true mainly of white, European immigrants. “Persons of color,” whose cultures and geographic origins differ vastly — blacks, Latins, Middle Easterners, and Asians of various types — will not “melt” for a very long time, if ever. Which means that they will retain their political influence, as protégés and supporters of the vast, Left-wing alliance.
The Vast, Left-Wing Alliance and Its Anti-Social Agenda
Another type of society to be found in the U.S. is composed of liberal-arts academics. Whether there is an extensive society of such academics is doubtful. The quality of mutual respect probably is rather strained within any given social unit, and unlikely to survive the trip from campus to campus, fraught as such distances are with academic rivalries.
But there certainly is a broad, Left-wing alliance that consists of liberal-arts academics and their sycophantic students; Hollywood and New York celebrities and their hangers-on; “artists” and “intellectual workers” of most stripes; well-educated, upper-income, professionals who live in and around major metropolitan areas; and hordes of politicians (local, State, and national), who foster and benefit from the prejudices of the alliance. This broad alliance patronizes — and draws political strength disproportionately from — blacks, Latins, and labor-union members.
The Leftist alliance scorns America and traditional American values. It exalts the politics of class, ethnic, racial, and gender conflict. It has demolished the long-standing, trans-societal agreement to ensure “domestic tranquility” and provide for “the common defence.” (See, for example, this, this, this, this, this, this, this, this, this, this, this, this, and many of the posts at this blog in the category “Leftism – Statism – Democracy.”) If there were an American society, the Left would not be part of it.
Conclusion
There is such a thing as society, contra Margaret Thatcher. But that “thing” is not the state. It is not even a single “thing”; it is a multitude of them.
Members of a true society may, by virtue of their membership, depend on other members of the same society for succor in times of need. But citizenship in the United States is not membership in a society.
Moreover, citizenship in the United States is no longer what it once was: membership in a broad alliance dedicated to justice and defense. Thanks to the vast, Left-wing alliance, U.S. citizenship has become a passport to statism.
Does this article from Friday’s issue of The Washington Times validate my earlier comments on race and the election?
…20 percent of white Democratic voters say they would defect to Mr. McCain if Mr. Obama is the Democratic Party’s nominee — twice the number who would cross over if Sen. Hillary Rodham Clinton wins the nomination, Pew [Research Center] found.
Clearly Obama is getting lots of white support because Hillary is so unsavory, yet it is clear that the ethnocentric bloc is out there.
UPDATED (03/12/08)
My eighth forecast is here.
The Presidency – Method 1
Intrade posts State-by-State odds odds on the outcome of the presidential election in November. I assign all of a State’s electoral votes to the party whose nominee that is expected to win that State. Where the odds are 50-50, I split the State’s electoral votes between the two parties.
As of today, the odds point to this result:
Democrat —
306302 electoral votes (EVs)Republican —
232236 EVs
That’s a loss of 7 EVs for the GOP candidate since my sixth forecast, which I issued 18 days ago.
The Presidency – Method 2
I have devised a “secret formula” for estimating the share of electoral votes cast for the winner of the presidential election. (The formula’s historical accuracy is described in my second forecast.) The formula currently yields these estimates of the outcome of this year’s presidential election:
Democrat nominee —
286 to 333226 to 263 EVsRepublican nominee —
205 to 252265 to 312 EVs
That’s a loss for the GOP nominee of 8 or 9 EVs since my sixth forecast. Methods 1 and 2 are tracking well with each other have diverged. I suspect that the betting at Intrade doesn’t yet reflect the swing toward McCain. That swing has been precipitated by the Clinton-Obama mud-fest and, for many white Democrats, the prospect of Obama at the head of the ticket.
U.S. Senate
Democrats will pick up four Senate seats, one each in Colorado, New Hampshire, New Mexico, and Virginia. The gain will change the balance from 51 Democrats (including Lieberman and Sanders, both nominally independent) and 49 Republicans to 55 Democrats and 45 Republicans.
Wolf Howling captures it neatly, in his review of Obama’s foreign policy.
The bad news about Super Tuesday II is the Clinton resurgence.
The good news is a veritable dead heat between Clinton and Obama, which probably guarantees a mud-fest between now and the Pennsylvania primary on April 22.
The bad news is the amount of air time that will be devoted to Clinton and Obama.
The good news is that either Clinton’s or Obama’s “base” will be ticked off by what is said about their favorite candidate, and by the outcome of the Pennsylvania primary. The other good news: possible Obama-Clinton fatigue among all but die-hard Democrats.
The bad news is that Clinton and Obama might then quickly cut a deal, that is, Clinton for president, Obama for vice president.
The good news is that Obama’s “black base” will be ticked off by being pushed to the back of the bus by an uppity white woman.
The bad news is that John McCain will be almost invisible to swing voters until the GOP convention (September 1-4).
The good news is John McCain may seem like a fresh face to a lot of swing voters by the time he becomes the GOP’s official nominee.
REVISED (02/29/08)
Americans are known for “voting with their feet,” that is, for moving to a more congenial locale, often across State lines. The reasons for doing so are many (e.g., being near family, getting away from family, taking a new job, retiring to a warmer climate, retiring to a climate and terrain conducive to winter sports). One of the reasons, of course, is to reduce one’s State and local tax burden.
But moves based on tax reasons aren’t tabulated in the 2008 Statistical Abstract, Table 31 (Movers by Type of Move and Reason for Moving: 2006), which seems (in my view) to understate the frequency of moves related to climate and retirement. A comparison of the totals in Table 31 with the corresponding totals in Table 33 (Mobility Status of Resident Population by State: 2005) suggests that Table 31 is incomplete, to the tune of about 6 million Americans out of the 45 million or so who change houses, counties, States, and countries every year.
So, it’s up to me to quantify the extent to which decisions about interstate moves are influenced by State and local taxes, among other things.
1. Drawing on Table 33 (linked above), I found the rate at which Americans moved from one State to another in 2005. The answer is 2.47 percent. That is, 7.1 million of the 284.4 million Americans age 1 or older in 2005 were residents of a different State in 2004.
2. Every State gains some new residents from other States, but some States are net gainers and others are net losers. To measure a particular State’s net gain or loss, I subtracted 2.47 percent (the all-State average) from the percentage of residents who moved into that State from other States. Nevada is at one extreme, with a net gain of 3.07 percent; New York is at the other extreme, with a net loss of 1.24 percent.
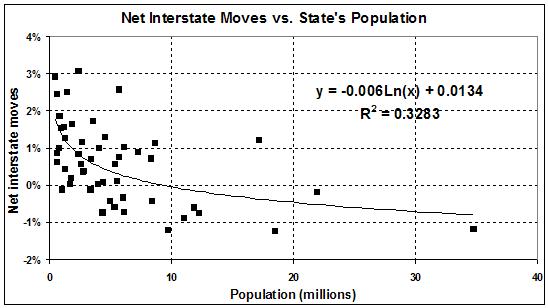
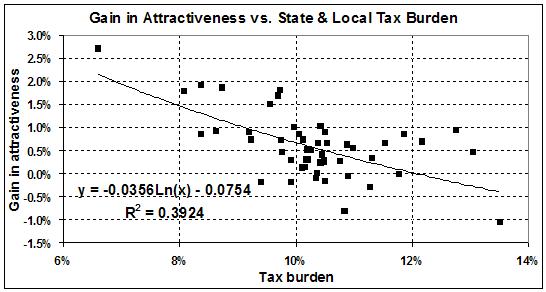
3. Overall, there is a negative correlation (-0.399) between net gain and tax burden; the lower the tax burden, the greater the gain. Graphically:

Sources: Net moves = net percentage of a State’s population gained from/lost to other States. Net moves are computed at described in the text. Tax burdens for 2004 are from this table, available via this page at the website of The Tax Foundation.
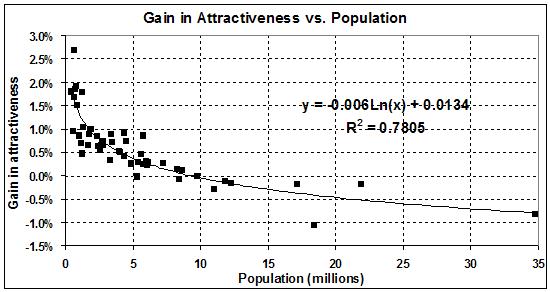
4. Tax policy evidently has a strong effect on decisions to move from State to State. Another quantifiable factor to be accounted for is population. As it turns out, the less populous a State, the greater its attraction:
 REVISED PORTION:
5. I took the obvious next step and ran a regression with natural logarithms of tax burden and population as explanatory variables, with this result:
Net population gain or loss (as a decimal fraction of previous year’s population) =
-0.049256
-0.027145 x natural logarithm of State + local tax burden (as a decimal fraction)
-0.005241 x natural logarithm State’s population (in millions)The R-squared of the equation is 0.420. The F-test on the regression and the t-statistics on the intercept and explanatory variables all are significant at the 0.995 level of confidence, or better.
In other words, after adjusting for population, a 1-percentage point increase in the tax burden from the mean rate of 10.29 percent yields a net population loss of 0.25 percent.
6. The regression equation, as indicated by its fairly low R-squared, leaves much to be explained by factors other than tax burden and population (the latter of which may be a rough proxy for work and family connections). The difference between a State’s actual net gain or loss and the net gain or loss estimated by the equation tells us something about that State’s inherent attractiveness (or unattractiveness). For example, the actual net population gain for Arizona is 2.57 percent; the estimated net gain, 0.25 percent. The difference (known as the residual) is 2.32 percent, which is the largest residual for any State. Arizona is therefore (and for obvious reasons, given its climate) an inherently attractive State. At the other end of the spectrum is Michigan, with a residual of -1.19 percent, which makes it the least inherently attractive State (for entirely fathomable reasons, given its economy).
7. So, I have two measures of a State’s attractiveness
What really matters, of course, is overall attractiveness, or the lack thereof. Unsurprisingly, the upper Midwest and Northeast dominate the list of 15 least-attractive States (those with negative values in the left panel of the table below). Inherent attractiveness (the right panel of the table below) is, nevertheless, an interesting property. The difference between overall attractiveness and inherent attractiveness is a good measure of the gain (or loss) in a State’s attractiveness because of its tax burden and/or population. Thus:
 The two graphs immediately above underscore the importance of taxes and population (that is, the lack thereof) to a State’s overall attractiveness.
States that gain or lose significantly (more than a standard deviation from the mean of 0.59%) fall into three categories:
How does your State stack up? See for yourself:
|
Overall attractiveness |
|
Inherent attractiveness |
|||
|
1 |
Nevada |
3.07% |
1 |
Arizona |
2.32% |
|
2 |
Wyoming |
2.91% |
2 |
Nevada |
2.22% |
|
3 |
Arizona |
2.57% |
3 |
Idaho |
1.46% |
|
4 |
Idaho |
2.50% |
4 |
Florida |
1.41% |
|
5 |
Alaska |
2.44% |
5 |
Wyoming |
1.12% |
|
6 |
Delaware |
1.85% |
6 |
Georgia |
1.02% |
|
7 |
Oregon |
1.72% |
7 |
Oregon |
1.01% |
|
8 |
New Mexico |
1.64% |
8 |
Hawaii |
0.87% |
|
9 |
Hawaii |
1.55% |
9 |
Washington |
0.79% |
|
10 |
Montana |
1.52% |
10 |
New Mexico |
0.65% |
|
11 |
Colorado |
1.30% |
11 |
Virginia |
0.61% |
|
12 |
New Hampshire |
1.28% |
12 |
North Carolina |
0.58% |
|
13 |
Florida |
1.21% |
13 |
Colorado |
0.57% |
|
14 |
Arkansas |
1.16% |
14 |
South Carolina |
0.51% |
|
15 |
Georgia |
1.14% |
15 |
Arkansas |
0.51% |
|
16 |
Washington |
1.02% |
16 |
Maryland |
0.28% |
|
17 |
South Carolina |
1.01% |
17 |
Utah |
0.21% |
|
18 |
South Dakota |
0.99% |
18 |
Montana |
0.02% |
|
19 |
Virginia |
0.88% |
19 |
Texas |
0.01% |
|
20 |
Vermont |
0.86% |
20 |
Kansas |
0.00% |
|
21 |
Utah |
0.83% |
21 |
Maine |
-0.03% |
|
22 |
Tennessee |
0.75% |
22 |
Delaware |
-0.07% |
|
23 |
North Carolina |
0.71% |
23 |
Vermont |
-0.09% |
|
24 |
Oklahoma |
0.69% |
24 |
Tennessee |
-0.11% |
|
25 |
North Dakota |
0.62% |
25 |
New York |
-0.17% |
|
26 |
Maryland |
0.56% |
26 |
Oklahoma |
-0.20% |
|
27 |
Kansas |
0.55% |
27 |
Alaska |
-0.26% |
|
28 |
Maine |
0.44% |
28 |
Iowa |
-0.28% |
|
29 |
Iowa |
0.38% |
29 |
Missouri |
-0.35% |
|
30 |
Mississippi |
0.36% |
30 |
California |
-0.36% |
|
31 |
West Virginia |
0.19% |
31 |
Mississippi |
-0.37% |
|
32 |
Missouri |
0.11% |
32 |
New Jersey |
-0.38% |
|
33 |
Alabama |
0.08% |
33 |
Connecticut |
-0.46% |
|
34 |
Kentucky |
0.04% |
34 |
Kentucky |
-0.48% |
|
35 |
Nebraska |
0.03% |
35 |
Pennsylvania |
-0.50% |
|
36 |
Rhode Island |
-0.13% |
36 |
New Hampshire |
-0.51% |
|
37 |
Connecticut |
-0.13% |
37 |
Wisconsin |
-0.58% |
|
38 |
Texas |
-0.17% |
38 |
Ohio |
-0.59% |
|
39 |
Indiana |
-0.33% |
39 |
Illinois |
-0.60% |
|
40 |
Minnesota |
-0.44% |
40 |
Indiana |
-0.63% |
|
41 |
New Jersey |
-0.44% |
41 |
Nebraska |
-0.63% |
|
42 |
Wisconsin |
-0.60% |
42 |
West Virginia |
-0.69% |
|
43 |
Pennsylvania |
-0.60% |
43 |
Minnesota |
-0.70% |
|
44 |
Massachusetts |
-0.72% |
44 |
Alabama |
-0.85% |
|
45 |
Louisiana |
-0.75% |
45 |
South Dakota |
-0.86% |
|
46 |
Illinois |
-0.77% |
46 |
Rhode Island |
-0.98% |
|
47 |
Ohio |
-0.89% |
47 |
Massachusetts |
-1.02% |
|
48 |
California |
-1.18% |
48 |
North Dakota |
-1.07% |
|
49 |
Michigan |
-1.20% |
49 |
Louisiana |
-1.16% |
|
50 |
New York |
-1.24% |
50 |
Michigan |
-1.19% |
No, I haven’t gone off the deep end. It’s just that I voted early in the Texas primary, and decided to vote Democrat so that I could vote against Hillary Clinton. (Believe me, it was painful to ask for a Democrat ballot.)
I had mixed feelings about voting for Obama, because (as of now) he seems more electable than Clinton. But I just couldn’t resist the urge to stick it to Hillary, in the hope that the outcome of the Texas primary sends her (and her husband) to the hell of national political impotence.
I have come to believe that Obama’s aura will dissipate as voters come to understand that his mantra of “change” is an empty political slogan. Change what? How? At what cost? The man doesn’t answer those questions. He just wants to get into the White House, decimate our defenses, enlarge government, and raise taxes. (He doesn’t say that, but that’s what’s on his agenda.)
But Obama will be found out — before election day. The Clintons will expose his emptiness before they’re through; John McCain will finish the job.
In any event, the nomination of Obama will ensure that there are as many disgruntled Clintonistas on the Democrat side as there are disgruntled conservatives on the GOP side. And if Clinton manages to steal the Democrat nomination, there will be as many deflated Obama-maniacs on the Democrat side as there are disgruntled conservatives on the GOP side.
P.S. The New York Times‘s anti-McCain smear job may backfire. If there’s anything a hard-core conservative hates more than John McCain, it’s the Times.
P.P.S. As I was saying.
My eighth forecast is here.
The Presidency – Method 1
Intrade posts State-by-State odds odds on the outcome of the presidential election in November. I assign all of a State’s electoral votes to the party whose nominee that is expected to win that State. Where the odds are 50-50, I split the State’s electoral votes between the two parties.
As of today, the odds point to this result:
Democrat — 293 electoral votes (EVs)
Republican — 245 EVs
That’s a pickup of 35 EVs for the GOP since my fifth forecast, which I updated only three days ago.
The Presidency – Method 2
I have devised a “secret formula” for estimating the share of electoral votes cast for the winner of the presidential election. (The formula’s historical accuracy is described in my second forecast.) The formula currently yields these estimates of the outcome of this year’s presidential election:
Democrat nominee — 278 to 324 EVs
Republican nominee — 214 to 260 EVs
That’s a loss for the GOP nominee of 7 to 20 EVs since my fifth forecast. The “good news” is that the ranges estimated by method 2 span the values obtained by method 1. If that remains the case, I will be more confident of my estimates as the election approaches.
U.S. Senate
No change since my fifth forecast. Democrats will pick up five Senate seats, one each in Colorado, New Hampshire, New Mexico, and Virginia, plus Mississippi or Minnesota. The gain will change the balance from 51 Democrats (including Lieberman and Sanders, both nominally independent) and 49 Republicans to 56 Democrats and 44 Republicans.
Here.
Some commentators have suggested that an Obama or Clinton presidency wouldn’t be an utter disaster, given the ability of GOP senators to stymie statist legislation by voting “nay” on cloture motions. (A cloture motion is a motion to cut off debate, that is, to stop a procedural filibuster.)
But…there may be only 44 GOP senators in the next Congress (down from 49). In that event, it could be hard to round up 41 “nays,” given the number of RINOs and half-baked conservatives on the GOP side of the aisle (e.g., Snowe and Collins of Maine, Specter of Pennsylvania, Coleman of Minnesota, Smith of Oregon). That will be especially true on critical issues where RINOs are notably soft (e.g., health care and defense).
