The Hall of Fame and Morality

Jonathan Mahler, in the course of an incoherent article about baseball, makes this observation:

This year, not a single contemporary player was voted into the Hall of Fame because so many eligible players were suspected of steroid use. Never mind that Cooperstown has its share of racists, wife beaters and even a drug dealer. (To say nothing of the spitballers.)

Those few sentences typify the confusion rampant in Mahler’s offering. The use of steroids and other performance-enhancing drugs calls into question the legitimacy of the users’ accomplishments on the field. Racism, wife-beating, and drug-dealing — deplorable as they are — do not cast a shadow on the perpetrators’ performance as baseball players. As for the spitball, it was legal in baseball until 1920, and when it was outlawed its avowed practitioners were allowed to continue using it. (Some modern pitchers have been accused of using it from time to time, but I can’t think of one who used it so much that his career is considered a sham.)

Election to the Hall of Fame isn’t (or shouldn’t be) a moral judgment. If it were, I suspect that the Hall of Fame would be a rather empty place, especially if serial adultery and alcohol abuse were grounds for disqualification.

At the risk of being called a moral agnostic, which I am not, I say this: Election to the Hall of Fame (as a player) should reflect the integrity and excellence of on-field performance. Period.

I do have strong views about the proper qualifications for election to the Hall of Fame (as a player). You can read them here, here, and here. I’ve also analyzed the statistical evidence for indications of the use of performance-enhancing drugs by a few notable players: Barry Bonds and Mark McGwire (both guilty) and Roger Clemens (unproved).

Do Managers Make a Difference?

INTRODUCTION

The activity of managing ranges from the supervision of one other person in the performance of a menial task to the supervision of the executive branch of the government of the United States. (The latter is a fair description of a president’s constitutional responsibility.) And there are many criteria for judging managers, not all of which are unambiguous or conducive to precise quantification. It may be easy, for example, to determine whether a ditch was dug on time and within budget. But what if the manager’s methods alienated workers, causing some of them to quit when the job was done and requiring the company to recruit and train new workers at some expense?

Or consider the presidency. What determines whether an incumbent is doing a good job? Polls? They are mere opinions, mostly based on impressions and political preferences, not hard facts. The passage by Congress of legislation proposed by the president? By that measure, Obama earns points for the passage of the Affordable Care Act, which if not repealed will make health care less affordable and less available.

Given the impossibility of arriving at a general answer to the tittle question, I will turn — as is my wont — to the game of baseball. You might think that the plethora of baseball statistics would yield an unambiguous answer with respect to major-league managers. As you’ll see, that’s not so.

WHAT BASEBALL STATISTICS REVEAL (OR DON’T)

Data Source

According to this page at Baseball-Reference.com, 680 different men have managed teams in the history of major-league baseball, which is considered to have begun in 1871 with the founding of the National Association. Instead of reaching that far back into the past, when the game was primitive by comparison with today’s game, I focus on men whose managing careers began in 1920 or later. It was 1920 that marked the beginning of the truly modern era of baseball, with its emphasis on power hitting. (This modern era actually consists of six sub-eras. See this and this.) In this modern era, which now spans 1920 through 2013, 399 different men have managed major-league teams. That is a sizable sample from which I had hoped to draw firm judgments about whether baseball managers, or some of them, make a difference.

Won-Lost Record

The “difference” in question is a manager’s effect — or lack thereof — on the success of his team, as measured by its won-lost (W-L) record. For the benefit of non-fans, W-L record, usually denoted W-L%, is determined by the following simple equation: W/(W + L), that is, games won divided by games won plus games lost. (The divisor isn’t number of games played because sometimes, though rarely, a baseball game is played to a tie.) Thus a team that wins 81 of its 162 games in a season has a W-L record of .500 for that season. (In baseball statistics, it is customary to omit the “0” before the decimal point, contrary to mathematical convention.)

Quantifying Effectiveness

I’m about to throw some numbers at you. But I must say more about the samples that I used in my analysis. The aggregate-level analysis described in the next section draws on the records of a subset of the 399 men whose managerial careers are encompassed in the 1920-2013 period. The subset consists of the 281 men who managed at least 162 games, which (perhaps not coincidentally) has been the number of games in a regulation season since the early 1960s. I truncated the sample where I did because the W-L records of mangers with 162 or more games are statistically better (significance level of 0.05) than the W-L records of managers with fewer than 162 games. In other words, a manager who makes it through a full season is likely to have passed a basic test of management ability: not losing “too many” games. (I address this subjective assessment later in the post.)

Following the aggregate-level analysis, I turn to an individual-level analysis of the records of those managers who led a team for at least five consecutive seasons. (I allowed into the sample some managers whose fifth full season consisted of a partial season in year 1 and a partial season in year 6, as long as the number of games in the two partial seasons added to the number of games in a full season, or nearly so. I also included a few managers whose service with a particular team was broken by three years or less.) Some managers led more than one team for at least five consecutive seasons, and each such occurrence is counted separately. For reasons that will become evident, the five seasons had to begin no earlier than 1923 and end no later than 2010.  The sample size for this analysis is 63 management tours accomplished by 47 different managers.

Results and Inferences: Aggregate Level

“Just the facts” about the sub-sample of 281 managers:

Number of games managed vs W-L record

The exponential equation, though statistically significant, tells us that W-L record explains only about 21 percent of the variation in number of games managed, which spans 162 to 5,097.

Looking closer, I found that the 28 managers in the top decile of games managed (2,368 to 5,097) have a combined W-L record of .526. But their individual W-L records range from .477 to .615, and eight of the managers compiled a career W-L record below .500. Perhaps the losers did the best they could with the teams they had. Perhaps, but it’s also quite possible that the winners were blessed with teams that made them look good. In any event, the length of a manager’s career may have little to do with his effectiveness as a manager.

Which brings me to the next topic.

Results and Inferences: Individual Level

This view is more complicated.  As mentioned above, I focused on those 47 managers who on 63 separate occasions led their respective teams for at least five consecutive seasons (with minor variations). To get at each manager’s success (or failure) during each management tour, I compared his W-L record during a tour with the W-L record of the same team in the preceding and following three seasons.

My aim in choosing five years for the minimum span of a manager’s tenure with a team was to avoid judging a manager’s performance on the basis of an atypical year or two. My aim in looking three years back and three years ahead was to establish a baseline against which to compare the manager’s performance. I could have chosen on time spans, of course, but a plausible story ensues from the choices that I made.

First, here is a graphical view of the relationship between each of the 63 managerial stints and the respective before-and-after records of the teams involved:

Manager's W-L record vs. baseline

A clue to deciphering the graph: Look at the data point toward the upper-left corner labeled “Sewell SLB 41-46.” The label gives the manager’s last name (Sewell for Luke Sewell, in this case), the team he managed (SLB = St. Louis Browns), and the years of his tenure (1941-46). (In the table below, all names, teams, and dates are spelled out, for all 63 observations.) During Sewell’s tenure, the Browns’ W-L record was .134 points above the average of .378 attained by the Browns in 1938-40 and 1947-49. That’s an impressive performance, and it stands well above the 68-percent confidence interval. (Confidence intervals represent the range within which certain percentages of observations are expected to fall.)

The linear fit (equation in lower-left corner) indicates a statistically significant negative relationship between the change in a team’s fortunes during a manager’s tenure and the team’s baseline performance. The negative relationship means that there is a strong tendency to “regress toward the mean,” that is toward a record that is consistent with the quality of a team’s players. In other words, the negative relationship indicates that a team’s outstanding or abysmal record my owe nothing (or very little) to a manager’s efforts.

In fact, relatively few managers succeeded in leading their teams significantly far (up or down) from baseline performance. Those managers are indicated by green (good) and red (bad) in the preceding graph.

The following table gives a rank-ordering of all 47 managers in their 63 management stints. The color-coding indicates the standing of a particular performance with respect to the trend (green = above trend, red = below trend). The shading indicates the standing of a particular performance with respect to the confidence intervals: darkest shading = above and below the 95-percent confidence interval; medium shading = between the 68-percent and 95-percent confidence intervals; lightest shading = between the 68-percent confidence intervals.

Ranking of manager's performances

Of the 63 performances, 4 of them (6.3 percent) lie outside the 95-percent confidence interval; 13 of them (20.6 percent) are between the 68-percent and 95-percent confidence intervals; the other 46 (73.0) percent are in the middle, and statistically indistinguishable.

Billy Southworth’s tour as manager of the St. Louis Cardinals in 1940-45 (#1) stands alone above the 95-percent confidence interval. Two of Bucky Harris’s four stints rank near the bottom (#61 and #62) just above Ralph Houk’s truly abysmal performance as manager of the Detroit Tigers in 1974-78 (#63).

Southworth’s tenure with the Cardinals is of a piece with his career W-L record (.597), and with his above-average performance as manager of the Boston Braves in 1946-51 (# 18). Harris had a mixed career, as indicated by his overall W-L record of .493 and two above-average tours as manager (#22 and #26). Houk’s abysmal record with the Tigers was foretold by his below-average tour as manager of the Yankees, a broken tenure that spanned 1961-73 (#47).

Speaking of the Yankees, will the real Casey Stengel please stand up? Is he the “genius” with an above-average record as Yankees manager in 1949-60, (#13) or the “bum” with a dismal record as skipper of the Boston Bees/Braves in 1938-42 (#56)? (Stengel’s ludicrous three-and-a-half-year tour as manager of the hapless New York Mets of 1962-65 isn’t on the list because of its brevity. It should be noted, however, that the Mets improved gradually after Stengel’s departure, and won the World Series in 1969.)

Stengel is one of seven managers with a single-season performance below the 68-percent confidence level. Four of the seven — Harris, Houk, Stengel, and Tom Kelly (late of the Minnesota Twins) — are among the top decile on the games-managed list. The top decile also includes seven managers who turned in performances that rank above the 68-percent confidence interval: Earl Weaver, Bobby Cox, Al Lopez, Joe Torre, Sparky Anderson, Joe McCarthy, and Charlie Grimm (#s 2-4 and 6-9).

I could go on and on about games managed vs. performance, but it boils down to this: If there were a strong correlation between the rank-order of managers’ performances in the preceding table and the number of games they managed in their careers, it would approach -1.00. (Minus because the the best performance is ranked #1 and the worst is ranked #68.) But the correlation between between rank and number of games managed in a career is only -0.196, a “very weak” correlation in the parlance of statistics.

In summary, when it comes to specific management stints, Southworth’s performance in 1940-45 was clearly superlative; the performances of Harris (1929-33, 1935-42) and Houk (1974-78) were clearly awful. In between those great and ghastly performance lie a baker’s dozen that probably merit cheers or Bronx cheers. A super-majority of the performances (the 73 percent in the middle) probably have little to do with management skills and a lot to do with other factors, to which I will come.

The Bottom Line

It’s safe to say that the number of games managed is, at best, a poor reflection of managerial ability. What this means is that (a) few managers exert a marked influence on the performance of their teams and (b) managers, for the most part, are dismissed or kept around for reasons other than their actual influence on performance. Both points are supported by the two preceding sections.

More tellingly, both points are consistent with the time-tested observation that “they” couldn’t fire the team, so “they” fired the manager.

CLOSING THOUGHTS

The numbers confirm what I saw in 30 years of being managed and 22 (overlapping) years of managing: The selection of managers is at least as random as their influence on what they manage. This is true not only in baseball but wherever there are managers, that is, throughout the world of commerce (including its entertainment sectors), the academy, and government.

The is randomness for several reasons. First, there is the difficulty of specifying managerial objectives that are measurable and consistent. A manager’s basic task might be to attain a specific result (e.g., winning more games than the previous manager, winning at least a certain number of games, turning a loss into a profit). But a manager might also be expected to bring peace and harmony to a fractious workplace. And the manager might also be charged with maintainng a”diverse” workplace and avoiding charges of discrimination? Whatever the tasks, their specification is often arbitrary and, in large organizations, impossible to relate the objective to an overarching organization goal (e.g., attaining a profit target).

Who knows if it’s possible to win more games or turn a loss into a profit, given the competition, the quality of the workforce, etc.? Is a harmonious workplace more productive than a fractious one if a fractious one is a sign of productive competitiveness?  How does one square “diversity” and forbearance toward the failings of the “diverse” (to avoid discrimination charges), while also turning a profit?

Given the complexity of management, at which I’ve only hinted, and the difficulty of judging managers, even when their “output” is well-defined (e.g., W-L record), it’s unsurprising that the ranks of managers are riddled with the ineffective and the incompetent. And such traits are often tolerated and even rewarded (e.g., raise, promotion, contract extension). Why? Here are some of the reasons:

  • Unwillingness to admit that it was a mistake to hire or promote a manager
  • A manager’s likeability or popularity
  • A manager’s connections to higher-ups
  • The cost and difficulty of firing a manager (e.g., severance pay, contract termination clauses, possibility of discrimination charges)
  • Inertia — Things seem to be going well enough, and no one has an idea of how well they should be going).

The good news is that relatively few managers make a big difference. The bad news is that the big difference is just as likely to be negative as it is to be positive. And for the reasons listed above, abysmal managers will not be rooted out until they have done a lot of damage.

So, yes, some managers — though relatively few — make a difference. But that difference is likely to prove disastrous. Just look at the course of the United States over the past 80 years.

Pseudoscience, “Moneyball,” and Luck

Orin Kerr of The Volokh Conspiracy endorses the following clap-trap, uttered by Michael Lewis (author of Liar’s Poker and Moneyball) in the course of a commencement speech at Princeton University:

A few years ago, just a few blocks from my home, a pair of researchers in the Cal psychology department staged an experiment. They began by grabbing students, as lab rats. Then they broke the students into teams, segregated by sex. Three men, or three women, per team. Then they put these teams of three into a room, and arbitrarily assigned one of the three to act as leader. Then they gave them some complicated moral problem to solve: say what should be done about academic cheating, or how to regulate drinking on campus.

Exactly 30 minutes into the problem-solving the researchers interrupted each group. They entered the room bearing a plate of cookies. Four cookies. The team consisted of three people, but there were these four cookies. Every team member obviously got one cookie, but that left a fourth cookie, just sitting there. It should have been awkward. But it wasn’t. With incredible consistency the person arbitrarily appointed leader of the group grabbed the fourth cookie, and ate it. Not only ate it, but ate it with gusto: lips smacking, mouth open, drool at the corners of their mouths. In the end all that was left of the extra cookie were crumbs on the leader’s shirt.

This leader had performed no special task. He had no special virtue. He’d been chosen at random, 30 minutes earlier. His status was nothing but luck. But it still left him with the sense that the cookie should be his.

So far, sort of okay. But then:

This experiment helps to explain Wall Street bonuses and CEO pay, and I’m sure lots of other human behavior. But it also is relevant to new graduates of Princeton University. In a general sort of way you have been appointed the leader of the group. Your appointment may not be entirely arbitrary. But you must sense its arbitrary aspect: you are the lucky few. Lucky in your parents, lucky in your country, lucky that a place like Princeton exists that can take in lucky people, introduce them to other lucky people, and increase their chances of becoming even luckier. Lucky that you live in the richest society the world has ever seen, in a time when no one actually expects you to sacrifice your interests to anything.

All of you have been faced with the extra cookie. All of you will be faced with many more of them. In time you will find it easy to assume that you deserve the extra cookie. For all I know, you may. But you’ll be happier, and the world will be better off, if you at least pretend that you don’t.

Never forget: In the nation’s service. In the service of all nations.

Thank you.

And good luck.

I am unsurprised by Kerr’s endorsement of Lewis’s loose logic, given Kerr’s rather lackadaisical attitude toward the Constitution (e.g., this post).

Well, what could be wrong with the experiment or Lewis’s interpretation of it? The cookie experiment does not mean what Lewis thinks it means. It is like the Candle Problem in that Lewis  draws conclusions that are unwarranted by the particular conditions of the experiment. And those conditions are so artificial as to be inapplicable to real situations. Thus:

1. The  teams and their leaders were chosen randomly. Businesses, governments, universities, and other voluntary organizations do not operate that way. Members choose themselves. Leaders (in business, at least) are either self-chosen (if they are owners) or chosen by higher-ups on the basis of past performance and what it says (imperfectly) about future performance.

2. Because managers of businesses are not arbitrarily chosen, there is no analogy to the team leaders in the experiment, who were arbitrarily chosen and who arbitrarily consumed the fourth cookie. For one thing, if a manager reaps a greater reward than his employees, that is because the higher-ups value the manager’s contributions more than those of his employees. That is an unsurprising relationship, when you think about it, but it bears no resemblance to the case of a randomly chosen team with a randomly chosen leader.

3. Being the beneficiary of some amount of luck in one’s genetic and environmental inheritance does not negate the fact that one must do something with that luck to reap material rewards. The “extra cookie,” as I have said, is generally produced and earned, not simply put on a plate to be gobbled. If a person earns more cookies because he is more productive, and if he is more productive (in part) because of his genetic and environmental inheritance, that person’s great earning power (over the long haul) is based on the value of what he produces. He does not take from others (as Lewis implies), nor does he owe to others a share of what he earns (as Lewis implies).

Just to drive home the point about Lewis’s cluelessness, I will address his book Moneyball, from which a popular film of the same name was derived. This is Amazon.com‘s review of the book:

Billy Beane, general manager of MLB’s Oakland A’s and protagonist of Michael Lewis’s Moneyball, had a problem: how to win in the Major Leagues with a budget that’s smaller than that of nearly every other team. Conventional wisdom long held that big name, highly athletic hitters and young pitchers with rocket arms were the ticket to success. But Beane and his staff, buoyed by massive amounts of carefully interpreted statistical data, believed that wins could be had by more affordable methods such as hitters with high on-base percentage and pitchers who get lots of ground outs. Given this information and a tight budget, Beane defied tradition and his own scouting department to build winning teams of young affordable players and inexpensive castoff veterans.

Lewis was in the room with the A’s top management as they spent the summer of 2002 adding and subtracting players and he provides outstanding play-by-play…. Lewis, one of the top nonfiction writers of his era (Liar’s Poker, The New New Thing), offers highly accessible explanations of baseball stats and his roadmap of Beane’s economic approach makes Moneyball an appealing reading experience for business people and sports fans alike.

The only problems with Moneyball are (a) its essential inaccuracy and (b) its incompleteness as an analysis of success in baseball.

On the first point, “moneyball” did not start with Billy Beane and the Oakland A’s, and it is not what it is made out to be. Enter Eric Walker, the subject and author of “The Forgotten Man of Moneyball, Part 1,” and “The Forgotten Man of Moneyball, Part 2,” published October 7, 2009, on a site at deadspin.com. (On the site’s home page, the title bar displays the following: Deadspin, Sports News without Access, Favor, or Discretion.) Walker’s recollections merit extensive quotation:

…[W]ho am I, and why would I be considered some sort of expert on moneyball? Perhaps you recognized my name; more likely, though, you didn’t. Though it is hard to say this without an appearance of personal petulance, I find it sad that the popular history of what can only be called a revolution in the game leaves out quite a few of the people, the outsiders, who actually drove that revolution.

Anyway, the short-form answer to the question is that I am the fellow who first taught Billy Beane the principles that Lewis later dubbed “moneyball.” For the long-form answer, we ripple-dissolve back in time …

. . . to San Francisco in 1975, where the news media are reporting, often and at length, on the supposed near-certainty that the Giants will be sold and moved. There sit I, a man no longer young but not yet middle-aged, a man who has not been to a baseball game — or followed the sport — for probably over two decades….

With my lady, also a baseball fan of old, I go to a game. We have a great time; we go to more games, have more great times. I am becoming enthused. But I am considering and wondering — wondering about the mechanisms of run scoring, things like the relative value of average versus power…. I go to the San Francisco main library, looking for books that in some way actually analyze baseball. I find one. One. But what a one.

If this were instead Reader’s Digest, my opening of that book would be “The Moment That Changed My Life!” The book was Percentage Baseball, by one Earnshaw Cook, a Johns Hopkins professor who had consulted on the development of the atomic bomb….

…Bill James and some others, who were in high school when Cook was conceiving the many sorts of formulae they would later get famous publicizing in their own works, have had harsh things to say about Cook and his work. James, for example, wrote in 1981, “Cook knew everything about statistics and nothing at all about baseball — and for that reason, all of his answers are wrong, all of his methods useless.” That is breathtakingly wrong, and arrogant. Bill James has done an awful lot for analysis, both in promoting the concepts and in original work (most notably a methodology for converting minor-league stats to major-league equivalents). But, as Chili Davis once remarked about Nolan Ryan, “He ain’t God, man.” A modicum of humility and respect is in order…. Cook’s further work, using computer simulations of games to test theory (recorded in his second book, Percentage Baseball and the Computer), was ground-breaking, and it came long before anyone thought to describe what Cook was up to as “sabermetrics” and longer still before anyone emulated it.

…I wanted to get a lot closer to the game than box seats. I had, some years before, been a radio newscaster and telephone-talk host, and I decided to trade on that background. But in a market like the Bay Area, one does not just walk into a major radio station and ask for a job if it has been years since one’s last position; so, I walked into a minor radio station, a little off-the-wall FM outfit, and instantly became their “sports reporter”; unsalaried, but eligible for press credentials from the Giants….

Meanwhile, however, I was constantly working on expanding Cook’s work in various ways, trying to develop more-practical methods of applying his, and in time my, ideas….

When I felt I had my principles in a practical, usable condition, I started nagging the Giants about their using the techniques. At first, it was a very tough slog; in those days — this would be 1979 or so, well before Bill James’ Abstracts were more than a few hundred mimeographed copies -– even the basic concepts were unknown, and, to old baseball men, they were very, very weird ideas….

In early 1981, as a demonstration, I gave the Giants an extensive analysis of their organization; taking a great risk, I included predictions for the coming season. I have that very document beside me now as I type…. I was, despite the relative crudeness of the methodology in those days, a winner: 440 runs projected, 427 scored; ERA projected, 3.35, ERA achieved, 3.28; errors projected, 103, actual errors committed, 102; and, bottom line, projected wins, 57, actual wins 56….

By this time, I had taken a big step up as a broadcaster, moving from that inconsequential little station to KQED, the NPR outlet in San Francisco, whence I would eventually be syndicated by satellite to 20 NPR affiliates across the country, about half in major markets.

As a first consequence of that move, a book editor who had heard the daily module while driving to work and thought it interesting approached me with a proposal that I write a book in the general style of my broadcasts. I began work in the fall of 1981, and the book, The Sinister First Baseman and Other Observations, was published in 1982, to excellent reviews and nearly no sales. Frank Robinson, then the Giants’ manager and a man I had come to know tolerably well, was kind enough to provide the Foreword for the book, which was a diverse collection of baseball essays….

At any rate, there I was, finally on contract with a major-league ball club, the Giants, but in a dubious situation…. I did persuade them to trade Gary Lavelle to the Blue Jays, but instead of names like John Cerutti and Jimmy Key, whom I had suggested, Haller got Jim Gott, who gave the Giants one good year as a starter and two forgettable years in the pen, plus two guys who never made the majors. But deals for Ken Oberkfell and especially for John Tudor, which I lobbied for intensely, didn’t get made (Haller called 20 minutes too late to get Oberkfell). I still remember then-Giants owner Bob Lurie, when I was actually admitted to the Brain Trust sanctum on trade-deadline day, saying around his cigar, “What’s all this about John Tudor?” (Tudor, then openly available, had a high AL ERA because he was a lefty in Fenway — this was well before “splits” and “park effects” were commonplace concepts — and I tried to explain all that, but no dice; Tudor went on to an NL ERA of 2.66 over seven seasons.)

When Robinson was fired by the Giants, I knew that owing to guilt by association (remember, Robby wrote the Foreword to my book) I would soon be gone, and so I was. My term as a consultant with the Giants was about half a season. In that brief term, I had had some input into a few decisions, but most of what I advocated, while listened to, was never acted on.

But having once crossed the major-league threshold, I was not about to sink back into oblivion. Across the Bay was an organization with a famously more forward-looking front office, with which I had already had contact. I asked, they answered, and so my career with the A’s began.

Modern analysis has shown a whole treasure chest of interesting and often useful performance metrics, but it remains so that the bedrock principle of classic analysis is simple: out-making controls scoring. What I call “classic” analysis is the principles that I presented to the Oakland Athletics in the early 1980s, which governed their thinking through 20 or so successful seasons, and which were dubbed “moneyball” by Michael Lewis in his book of that title. Because of that book, there has arisen a belief that whatever the A’s do is, by definition, “moneyball”; with the decline in their fortunes in recent years has come a corresponding belief that “moneyball” is in decline — dead, some would say [1] — because the A’s and moneyball are seen as essentially one thing.

That is simply wrong…. “Moneyball,” as the name says, is about seeking undervalued commodities [emphasis added]. In my day, what I regard as the crucial aspects of run-generation, notably on-base percentage, were seriously undervalued, so “moneyball” consisted in finding batters with those skills.

A team that today sustains one of the lowest on-base percentages in baseball, and actively acquires players with drastically low career on-base numbers, is very obviously practicing a different “moneyball” than that for which it became famed. Today’s A’s, it seems, see the undervalued commodities as “defense and athletic players drafted out of high school” (as a recent article on the organization put it). These are not your father’s A’s. What success their new tack will have remains to be seen (their present fortunes are a transition state); but “moneyball” as practiced today by the A’s seems no longer to have at its core the same analytic principles that then-GM Sandy Alderson and I worked with a quarter-century ago, and that I presented to Billy Beane in that now semi-famous paper [“Winning Baseball”]….

In 1994, Sandy promoted Billy Beane to assistant GM. At the same time, he asked me to prepare an overview of the general principles of analysis for Billy, so that Billy could get in one sitting an idea of the way the organization was looking at talent. In the end, I delivered a report titled “Winning Baseball,” with the subtitle: “An objective, numerical, analytic analysis of the principles and practices involved in the design of a winning baseball team.” The report was 66 pages long; I still grit my teeth whenever I remember that Michael Lewis described it as a “pamphlet [on page 58 of this edition of Moneyball].”…

My goal in that report, which I seem to have met, was to put the ideas — not the detailed principles, just the ideas — forward in simple, clear language and logical order, so that they would be comprehensible by and reasonable to a working front-office executive. Sandy Alderson didn’t need a document like this, then or at the outset, but he was a Harvard-trained attorney; I considered myself to be writing not just to Billy Beane but to any veteran baseball man (which, as it turned out, was just as well)….

Lewis not only demotes “Winning Baseball” to a pamphlet, but also demotes Walker to passing mention on three pages of Moneyball: 58, 62, and 63 (in the paperback edition linked above). Why would Lewis slight and distort Walker’s contributions to “moneyball”? Remember that Lewis is not a scientist, mathematician, or statistician. He is a journalist with a B.A. in art history who happened to work at Salomon Brothers for a few years. I have read his first book, Liar’s Poker. It is obviously the work of a young man with a grievance and a flair for dramatization. Moneyball is obviously the work of a somewhat older man who has honed his flair for dramatization. Do not mistake it for a rigorous analysis of the origins and effectiveness of “moneyball.”

Just how effective was “moneyball,” as it was practiced by the Oakland Athletics? There is evidence to suggest that it was quite effective. For example:


Sources and notes: Team won-lost records are from Baseball-Reference.com. Estimates of team payrolls are from USA Today’s database of salaries for professional sports teams, which begins in 1988 for major-league baseball (here). The payroll index measures the ratio of each team’s payroll in a given year to the major-league average for the same year.

The more that a team spends on player salaries, the better the team’s record. But payroll accounts for only about 18 percent of the variation in the records of major-league teams during the period 1988-2011. Which means that other factors, taken together, largely determine a team’s record. Among those factors is “moneyball” — the ability to identify, obtain, effectively use, and retain players who are “underpriced” relative to their potential. But the contribution of “moneyball” cannot be teased out of the data because, for one thing, it would be impossible to quantify the extent to which a team actually practices “moneyball.” That said, it is evident that during 1988-2011 the A’s did better than the average team, by the measure of wins per dollar of payroll: Compare the dark green regression line, representing the A’s, with the black regression line, representing all teams.

That is all well and good, but the purpose of a baseball team is not to win a high number of games per dollar of payroll; it is to win — period. By that measure, the A’s of the Alderson-Beane “moneyball” era have been successful, at times, but not uniquely so:


Source: Derived from Baseball-Reference.com.

The sometimes brilliant record of the Athletics franchise during 1901-1950 is owed to one man: Cornelius McGillicuddy (1862-1956). And the often dismal record of the franchise during 1901-1950 is owed to one man: the same Cornelius McGillicuddy. True fans of baseball (and collectors of trivia) know Cornelius McGillicuddy as Connie Mack, or more commonly as Mr. Mack. The latter is an honorific bestowed on Mack because of his dignified mien and distinguished career in baseball: catcher from 1886 to 1896; manager of the Pittsburgh Pirates from 1894 to 1896; manager of the Philadelphia Athletics from 1901 to 1950; part owner and then sole owner of the Athletics from 1901 to 1954.  (He is also an ancestor of two political figures who bear his real name and alias: Connie Mack III and Connie Mack IV.)

Mack’s long leadership and ownership of the A’s is important because it points to the reasons for the A’s successes and failures during the fifty years that he led the team from the bench. Here, from Wikipedia, is a story that is familiar to persons who know their baseball history:

[Mack] was widely praised in the newspapers for his intelligent and innovative managing, which earned him the nickname “the Tall Tactician”. He valued intelligence and “baseball smarts”, always looking for educated players. (He traded away Shoeless Joe Jackson despite his talent because of his bad attitude and unintelligent play.[9]) “Better than any other manager, Mack understood and promoted intelligence as an element of excellence.”[10] He wanted men who were self-directed, self-disciplined and self-motivated; his ideal player was Eddie Collins.[11]

“Mack looked for seven things in a young player: physical ability, intelligence, courage, disposition, will power, general alertness and personal habits.”[12]

He also looked for players with quiet and disciplined personal lives, having seen many players destroy themselves and their teams through heavy drinking in his playing days. Mack himself never drank; before the 1910 World Series he asked all his players to “take the pledge” not to drink during the Series. When Topsy Hartsel told Mack he needed a drink the night before the final game, Mack told him to do what he thought best, but in these circumstances “if it was me, I’d die before I took a drink.”[13]

In any event, his managerial style was not tyrannical but easygoing.[14] He never imposed curfews or bed checks, and made the best of what he had; Rube Waddell was the best pitcher and biggest gate attraction of his first decade as A’s manager, so he put up with his drinking and general unreliability for years until it began to bring the team down and the other players asked Mack to get rid of him.[15]

Mack’s strength as a manager was finding the best players, teaching them well and letting them play. “He did not believe that baseball revolved around managerial strategy.”[10] He was “one of the first managers to work on repositioning his fielders” during the game, often directing the outfielders to move left or right, play shallow or deep, by waving his rolled-up scorecard from the bench.[12] After he became well known for doing this, he often passed his instructions to the fielders by way of other players, and simply waved his scorecard as a feint.[16]

*   *   *

Mack saw baseball as a business, and recognized that economic necessity drove the game. He explained to his cousin, Art Dempsey, that “The best thing for a team financially is to be in the running and finish second. If you win, the players all expect raises.” This was one reason he was constantly collecting players, signing almost anyone to a ten-day contract to assess his talent; he was looking ahead to future seasons when his veterans would either retire or hold out for bigger salaries than Mack could give them.

Unlike most baseball owners, Mack had almost no income apart from the A’s, so he was often in financial difficulties. Money problems – the escalation of his best players’ salaries (due both to their success and to competition from the new, well-financed Federal League), combined with a steep drop in attendance due to World War I — led to the gradual dispersal of his second championship team, the 19101914 team, who [sic] he sold, traded, or released over the years 1915–1917. The war hurt the team badly, leaving Mack without the resources to sign valuable players….

All told, the A’s finished dead last in the AL seven years in a row from 1915 to 1921, and would not reach .500 again until 1926. The rebuilt team won back-to-back championships in 1929–1930 over the Cubs and Cardinals, and then lost a rematch with the latter in 1931. As it turned out, these were the last WS titles and pennants the Athletics would win in Philadelphia or for another four decades.

With the onset of the Great Depression, Mack struggled financially again, and was forced to sell the best players from his second great championship team, such as Lefty Grove and Jimmie Foxx, to stay in business. Although Mack wanted to rebuild again and win more championships, he was never able to do so owing to a lack of funds.

Had an earlier Michael Lewis written Moneyball in the 1950s, as a retrospective on Mack’s career as a manager-owner, that Lewis would have said (correctly) that the A’s successes and failures were directly related to (a) the amount of money spent on the team’s payroll, (b) Connie Mack’s character-based criteria for selecting players, and (c) his particular approach to managing players.  That is quite a different story than the one conveyed by the Moneyball written by the real Lewis.

Which version of Moneyball is correct? No one can say for sure. But the powerful evidence of Connie Mack’s long tenure suggests that it takes a combination of the two versions of Moneyball to be truly successful, that is, to post a winning record year after year. It seems that Lewis (inadvertently) jumped to a conclusion about what makes for a successful baseball team — probably because he was struck by the A’s then-recent success and did not look to the A’s history.

In any event, success through luck is not the moral of Moneyball; the moral is success through deliberate effort. But Michael Lewis ignored the moral of his own “masterwork” when he stood before an audience of Princeton graduates and told them that they are merely (or mainly) lucky. How does one graduate from Princeton merely (or mainly) by being lucky? Does it not require the application of one’s genetic talents? Did not most of the graduates of Princeton arrive there, in the first place, because they had applied their genetic talents well during their years in high school or prep school (and even before that)? Is one’s genetic inheritance merely a matter of luck, or is it the somewhat predictable result of the mating of two persons who were not thrown together randomly, but who had a lot in common — including (most likely) high intelligence?

Just as the cookie experiment invoked by Lewis is a load of pseudoscientific hogwash, the left-wing habit of finding luck at the bottom of every achievement is a load of politically correct hogwash. Worse, it is an excuse for punishing success.

Lewis’s peroration on luck is just a variation on a common left-wing theme: Success is merely a matter of luck, so it is the state’s right and duty to redistribute the spoils of luck.

Related posts:
Moral Luck
The Residue of Choice
Can Money Buy Excellence in Baseball?
Inventing “Liberalism”
Randomness Is Over-Rated
Fooled by Non-Randomness
Accountants of the Soul
Rawls Meets Bentham
Social Justice
Positive Liberty vs. Liberty
More Social Justice
Luck-Egalitarianism and Moral Luck
Nature Is Unfair
Elizabeth Warren Is All Wet
Luck and Baseball, One More Time
The Candle Problem: Balderdash Masquerading as Science
More about Luck and Baseball
Barack Channels Princess SummerFall WinterSpring
Obama’s Big Lie

Conducting, Baseball, and Longevity

It seems to be a matter of conventional wisdom that conductors (of musical performances) live longer than most mortals, and that that their above-average longevity something to the fact that the occupation of conducting involves vigorous arm motions. Various writers have looked into the matter of conductors’ longevity, and have come to various conclusions about it. In the late 1970s, for example, a medical doctor named Joseph Atlas published an article on the subject, a news account of which is available here. According to the news story,

Atlas selected a random sampling of 35 major decades symphony leaders and computed their longevity at 73.4 years, compared with 68.5 for the average American male.

Then he arrived at a series of conclusions.

Among them:

– Gratifying, or happy, stress promotes longevity.

– Driving motivation and the sense of fulfillment that comes with world recognition help forestall the ravages of age.

Atlas defines gratifying stress as the opposite of frustrating stress, which is the kind that can lead to coronaries….

…As yet there is no scientific documentation to back him up. His conclusions are hypothetical, he says, “more anecdotal than statistical.”…

…Among the prime examples of longevity, Atlas cites, is Leopold Stokowski, who was active and vital until his death at 95.

“Arturo Toscanini lived an active life to the age of 89, Bruno Walter to 85, Ernest Ansermet to 86, Walter Damrosch to 88, Arthur Fiedler is 84.”

There are problems with Atlas’s analysis, but — at bottom — Atlas is right about the longevity of conductors, and probably right that “gratifying stress” enhances longevity. Whether vigorous arm movement has anything to do with longevity is another matter, to which I will come.

As for the problems with Atlas’s analysis,consider this passage from Robert P. Abelson’s Statistics as Principled Argument (1995):

 The longevity datum on famous orchestral conductors (Atlas, 1978) provides a good example [of a spurious attribution of causality]. With what should the mean age at their deaths, 73.4 years, be compared? With orchestral players? With nonfamous conductors? With the general public?

All of the conductors studied were men, and almost all of them lived in the United States (though born in Europe). The author used the mean life expectancy of males in the U.S. population as the standard of comparison. This was 68.5 years at the time the study was done, so it appears that the conductors enjoyed about a 5-year extension of life and indeed, the author of the study jumped to the conclusion that involvement in the activity of conducting causes longer life. Since the study appeared, others have seized upon it and even elaborated reasons for a causal connection (e.g., as health columnist Brody, 1991, wrote, “it is believed that arm exercise plays a role in the longevity of conductors.”

However, as Carroll (1979) pointed out in a critique of the study, there is a subtle flaw in life-expectancy comparisons: The calculation of average life expectancy includes infant deaths along with those of adults who survive for many years. Because no infant has ever conducted an orchestra, the data from infant mortalities should be excluded from the comparison standard. Well, then, what about teenagers? They also are much too young to take over a major orchestra, so their deaths should also be excluded from the general average. Carroll argued that an appropriate cutoff age for the comparison group is at least 32 years old, an estimate of the average age of appointment to a first orchestral conducting post. The mean life expectancy among U.S. males who have already reached the age of 32 is 72.0 years, so the relative advantage, if any, of being in the famous conductor category is much smaller than suggested by the previous, flawed comparison. (p.4, quoted here)

But the comparison is not as flawed as Abelson makes it out to be. Consider the excerpts of an talk given in 2005 by Jeremiah A. Barondess, M.D., then president of the New York Academy of Medicine:

I have had more than a glancing interest in this subject [longevity] for a long time. I was first attracted to it many years ago when I came across a squib in the newspaper to the effect that Leopold Stokowski, then about 90 years old, had been the subject of a complaint to the authorities by a young woman whom he had pinched. Morals aside, I thought the act reflected a certain energy on Stokowski’s part, and I found myself led into a rumination about the apparent vigor, and then the differential longevity of symphonic conductors. Stokowski, as it turned out, lived for 95 years, and gave his last concert at the age of 93 at the Vence Festival in France. Toscanini lived to be 90, Sir Thomas Beecham 83, and Eugene Ormandy 86. The more general question that emerged for me had to do with who, in any frame of life, lives a long time, and why. And, if the posit about symphonic conductors was correct, what was it about them or their activities that was operational?

Was it the music? There is some evidence that the right side of the brain is more involved in processing music than the left, and blood flow studies have shown that the same areas of the brain that respond to euphoria-inducing stimuli like food, sex and some drugs also respond to stimulating music. How this might have to do with longevity is admittedly obscure; connections between pleasure and longevity have not been clearly established….

In any case, to return to symphonic conductors, the fact that that the sample was small and hardly random didn’t deter me much. Maybe it was just the successful ones who lived a long time. Maybe it was the music that did it. Maybe, if symphonic conductors really had preternatural longevity, it had something to do with waving their arms so much. That idea really intrigued me…. First of all, it’s plain that when people run they also move their arms a lot, so even if running is good for you, you may be able to get the same effect a lot more efficiently. And notice that arm waving is a form of upper body aerobic exercise, so the arms have a claim along that line as well, and, in any case, I found the idea that it might be better to play a little Mozart or Shostakovich and wave your arms in time with it much more congenial. Finally, in the case of symphonic conducting, an enormous amount of cognitive activity is involved, another element that has been linked to longevity.

Ultimately I felt more or less requited when I discovered a paper by Leonard Hayflick citing a MetLife study that involved 437 active and former conductors of major regional and community symphonies. The study started in 1956 and ended in 1975 when 118 of them had died, more than 20% at age 80 or older. The death rate for the entire group was 38% below that of the general population, and for conductors aged 50 to 59, a decade when stress and responsibilities are at their peak, the death rate was 56% less than that of the general population. I was somewhat disconcerted by a nearly simultaneous MetLife study that showed that corporate executives enjoyed longevity similar to that of orchestra conductors, punching a hole in the arm waving theory, though possibly not a definitive hole, since the study did not control for arm waving among the executives.

In any case, the conducting and arm waving thing had me hooked. The next thought, if you’ll forgive the expression, was that it might be interesting to compare longevity among baseball players who spent years in positions that involved a lot of throwing, and to compare them with those whose positions called for infrequent throwing. I tried to recruit to this question a bright young man who was taking a fellowship in general medicine with me, and he seemed interested. Accordingly (this was before every statistic in the world was available online, in fact before anything was available online), I provided him with the Encyclopedia of Baseball, thinking he could do the necessary with it. It contained data on everyone who had ever played professional baseball, the teams, the years and the positions played. The task proved too daunting for my young colleague, and it fell by the wayside under the pressure of other responsibilities, but, as evidence the idea wasn’t uniquely quirky, in 1988 a group at the University of Alabama published an article on the mortality experience of major league baseball players, in the New England Journal of Medicine. They assembled a cohort that included all players who had played their first games for a major league team in the United States between 1911 and 1915 and who survived at least until 1925. They had a cohort of 985 players to analyze, and successfully acquired follow-up information on 958 of them. Their average age at death was 70.7 years, the average year 1960. Infielders had the lowest overall mortality rate and catchers the highest; the differences were not statistically significant. Grouping all infielders may have blunted the study; it might have been better to compare first basemen, say, who throw relatively little, with pitchers or short stops. But there was an inverse association between standardized mortality ratios for the groups and the length of the player’s career; and being a baseball player in fact conferred a slight protective effect against death, with the cohort having only 94% of the deaths expected. It was most interesting to me that the data suggested that players who performed the best lived the longest, a fact that should bring some comfort to the accomplished people in this room. But my arm waving theory was not supported, at least by the gross categories established within the cohort. (“How to Live a Long Time: Facts, Factoids, and Descants,” Transactions of the American Clinical and Climatological Association, 116: 77–89)

It seems indisputable, based on the statistics cited by Barondess, that conductors and baseball players tend to outlive their peers. This leads to two questions: By how much do conductors and baseball players outlive their peers, and why do they and others, like corporate executives, outlive them? As Barondess suggests, the answer is not vigorous arm movement. If it were the answer, one would expect pitchers be longer-lived than other baseball players, and that is not the case.

But I am getting ahead of myself. Before considering what factors might yield a long life-span, I will present some statistics about conductors and baseball players.

I compiled a list of 152 conductors born after 1800 and before 1930 who are prominent enough to have Wikipedia entries. I obtained names of candidates for the list from this page at a site known as knowledgerush (which displays obnoxious banner ads), and from two lists at Wikipedia (one of 19th century conductors, the other of 20th century conductors). Of the 152 conductors, 18 are still living. The earliest year of birth of a living conductor is 1919. I therefore focused on the 112 conductors who were born in 1918 or earlier,* inasmuch as the inclusion of conductors born after 1918 (among them 18 living ones) would bias the analysis by understating the longevity of conductors born after 1918. Here is a plot of the 112 conductors’ ages at death, by year of birth:

The linear relationship between age at death and year of birth (dashed line) is statistically insignificant, but it roughly parallels the rising trend of life expectancies for white males aged 40 (the green line). (I used life expectancies for white, American males, given here, because there are no non-whites or females in the sample of 112 conductors.) In words, a person who — like almost everyone in the sample — had become a conductor by the age of 40 was very likely to outlive the general run of 40-year old white males, and to do so by a wide margin. By 1918, that margin had shrunk to about 6 years, but it was still large enough to say that conductors enjoyed unusually long lives. The trend line, however weak statistically, suggests that conductors will continue to enjoy unusually long lives.

But, as I have said, arm-waving probably is not the key to conductors’ long lives. The evidence for that assertion is found in an analysis of the longevity of baseball players. Using the Play Index (subscription) tool at Baseball-Reference.com, I compiled lists of deceased major-league players who either pitched at least 1,000 innings or played in at least 1,000 games in one of the following positions or groups of positions: pitcher, catcher, second base-third base-shortstop, first base-outfiield. I chose those groupings because pitchers use their arms intensely and often every few games; catchers use their arms somewhat less intensely than pitchers, but more often than other players; the second base-third base-shortstop positions involve less intense and frequent arm motions than pitching and catching, but more frequent (if not more intense) than the first base-outfield positions.

The total number of players in the sample is 1,039, broken down as follows: 592 pitchers; 41 catchers; 178 players at second, third, or short; and 228 players at first or outfield. A regression on age at death yields the following:

Age at death = 57.1 + 1.02 x number of seasons in major-league baseball – 0.004 x number of games played + 6.05 if played primarily (at least 90% of games) at 2b, 3b, or SS + 5.17 if played primarily at 1b or OF + 2.90 if played primarily at catcher.

The P-values on the intercept and coefficients are 1.7E-178,  7.89E-12, 0.05, 0.02, 0.05, and 0.33, respectively

What about pitchers? The positive coefficients on the non-pitching positions imply a negative coefficient on “pitcher.” The correlation between “pitcher” and “age at death” is negative and significant at better than the 1-percent level. The difference between the average age of pitchers at death (68.4 years) and the average age of other players at death (71.3 years) is statistically significant at the 1-percent level.

In sum, pitchers do not live as long as other players. And catchers, though they live longer than pitchers, do not live as long as other non-pitchers. So much for the idea that longevity is positively related to and perhaps abetted by vigorous and frequent arm motion.

What about the longevity of baseball players in relation to that of the population of white males? I derived the following graphs from the Play Index and the table of life expectancies (both linked above):

I chose 1918 as the cutoff point for ballplayers because that is the last year in the sample of 112 conductors. (As of today, only 15 of the thousands of players born in 1918 or earlier survive** — not enough to affect the comparison.) Before I bring in the conductors, I want to point out the positive trend for longevity among ballplayers (indicated by the heavy black line), especially in relation to the trend for white, 20-year old males. The linear fit, though weak, is statistically robust, and it reflects the long, upward rise in ballplayers’ longevity that is evident in the scatter plot.

I now add conductors to the mix:

For the period covered by the statistics (birth years from 1825 through 1918), conductors enjoyed a modest and significantly insignificant increase in longevity, indicated by the dashed black line. By 1918, ballplayers had almost caught up with conductors. The trends suggest that, on average, today’s MLB players can expect to live longer than today’s conductors. Conductors, nevertheless, seem destined to live longer than their contemporaries in the population at large, but not because they (conductors) wave their arms a lot.

If the secret of a long life is not a lot of arm-waving, what is it? I return to Dr. Barondess:

[W]e’ve heard for years that the best way to live a long time is to pick long-lived parents, and there is increasing evidence that the pace of aging is to a significant degree genetically determined, but environmental influences and personal behaviors are clearly also of great importance. Scandinavian studies have calculated the heritability of average life expectancy to be 20 to 30%, with environmental differences accounting for at least 70% of variation in age at death among twins. And studies of 7th Day Adventists suggest that optimizing health related behaviors could yield up to 25 years of good health beyond age 60 with a compression of morbidity toward the end of life. The authors of that study suggested that when it comes to aging well there is no such thing as the anti-aging industry’s free lunch. I think a better suggestion might be that a really good anti-aging maneuver is no lunch, in light of other studies connecting undereating with extension of life expectancy….

There are some data connecting a specific region on chromosome 4 to the longevity of centenarians and nonagenerians, and a number of longevity genes have been discovered in yeasts, worms and fruit flies. So apparently there are gerontogenes, or longevity-enabling genes, and the genetic contribution to longevity is being investigated with increasing enthusiasm….

There’s been a good deal of research activity, and perhaps even more in the public prints in recent years, with relation to diet and longevity, especially caloric restriction. These effects were first demonstrated in the 1930s, when it was shown that laboratory rats on limited diets live about 40% longer than normal and are resistant to many chronic diseases typical of aging. These studies have been replicated in yeasts, fruit flies, nematodes, fish, spiders and mice, and there are hints that the effect may also hold true for primates. Recent research on the mechanisms underlying these phenomena has shown that the effect of caloric restriction is tied to genetic factors….

Numerous mechanisms have been suggested without great clarification to this point, but it does appear that life lengthening through caloric restriction is not primarily related to retardation of disease processes, but rather to slowing of primary aging processes, and this is related to restriction of calories rather than specific nutrients….

On the other hand, specific nutrients may impact disease processes themselves…. One study suggested that pizza intake had the potential to reduce cardiovascular risk, presumably because of the tomato sauce component, and despite the cheese.

A number of other foodstuffs have been thought to enhance health prospects, including nuts, for their resveratrol content, organo-sulfur compounds in garlic and onions, and various carotenes. Cocoa, flavanol rich, is thought to be good for you; the makers of Mars Bars are working hard on this. So are blueberries, high in antioxidants, as are raspberries, cranberries and strawberries….

One study from Rome considered alcohol consumption and its effect on longevity. The study suggested that drinking 4 to 7 drinks per day, roughly 63 grams of alcohol, a dose some might think heroic, led to a two-year edge in life expectancy, but drinking more than 10 drinks was negatively associated with longevity. These drinks were 97% wine, primarily red, high in resveratrol content. Other studies have suggested that 250 to 500 cc. of red wine a day is associated with a diminished risk of macular degeneration, Alzheimer’s disease and cognitive deficits….

Several studies … have found that social networks among humans are important predictors of longevity, including participation in formal organizations, contact with friends or relatives, and so forth. In one study of African American women aged 55 to 96, those who were extremely isolated in a social sense were more than three times as likely to die within a five-year period of observation, an impact unaffected by the use of community senior services. A search for the effects on longevity of living as a recluse or a hermit produced no results, I imagine because follow-up would be difficult, but on the other hand a number of additional papers about socialization in humans turned up. One suggested that providing social support may be more beneficial than receiving it. Mortality was significantly reduced for individuals reported to be providers of support to friends, relatives and neighbors, and emotional support for spouses.

In a study from Columbia University, the impact of marital closeness on survival was examined in 305 older couples. Closeness was defined as naming one’s spouse as a confidant or as a source of emotional support, versus not naming, or being named by the spouse on at least one of the two dimensions, versus not being named. Husbands who were named by their wives as confidants or supports, but did not name them, were least likely to have died after six years. Compared with them, husbands who were not named by their wives as a confidant or source of social support, or did not name their wives, were from 3.3 to 4.7 times more likely to be dead. The results among wives showed a similar pattern, but a weaker one….

Studies of personal histories have illuminated some personality factors that may bear on longevity. One important investigation is the Nun Study, organized by David Snowden in 1986. In this longitudinal study of aging and dementia, he was looking at a convent community of nuns aged 74 to 106, retired from careers in a variety of sites, many of them as teachers. They tended not to drink or smoke, had similar diets, income, and quality of health care and had an active social network. Snowden examined short biographical notes written at an average age of 22, on entry into the order. These suggested that positive emotions in early life were associated with longevity, with a difference of nearly 7 years between the highest and lowest quartiles of positive emotion sentences. That is, positive emotional content in early life autobiographies was strongly associated with longevity six decades later. There was some sense that positive response patterns, or more rapid return to a positive outlook after negative events, serves to dampen the physiologic sequelae of emotional arousal, such as heart rate and blood pressure changes, and presumably also hormonal responses. In a word it’s best to be cheery, or at least positive.

Further to the effect of optimism and pessimism as risk factors for disease, Peterson and his group studied questionnaires filled out by 99 Harvard graduates in the classes of 1942 to ’44, when they were about 25 years of age, and then determined physical health from ages 30 to 60 as measured by examination by physicians. Pessimistic explanatory style, the belief that bad events are caused by stable, global or internal personal factors, predicted poor health at ages 45 through 60 even when physical and mental health at age 25 were controlled for, across an array of diseases ranging from gout to diabetes, kidney stones to hypertension. The correlations increased across the life span, from age 30 to 60.

With regard to the impact of cognitive activity on optimism, health, and possibly life expectancy, there is good reason to believe, as Guy McKhann and Marilyn Albert have pointed out, that the phrase “use it or lose it” applies. Maintaining one’s mental abilities is made easier through a variety of activities, including reading, doing crossword puzzles, learning ballroom dancing, using a computer and going to lectures or concerts. Studies have shown that in rats an enriched environment that includes exercise, toys, mirrors, tunnels and interaction with other rats strengthens connections between cells in the hippocampus and even increases the rate at which new cells are born. The idea of rat fraternization may be counterintuitive, but somewhere here there may be a link with the academic parable expressed in prior talks by Dick Johns on how to swim with sharks. Fraternization with rats, has, I think, a weaker set of academic projections, but I pass it along for what it’s worth.

Related to the last point is evidence of

[a] strong inverse correlation between early life intelligence and mortality … across different populations, in different countries, and in different epochs.”[3][4][5] Various explanations for these findings have been proposed:

“First, …intelligence is associated with more education, and thereafter with more professional occupations that might place the person in healthier environments. …Second, people with higher intelligence might engage in more healthy behaviours. …Third, mental test scores from early life might act as a record of insults to the brain that have occurred before that date. …Fourth, mental test scores obtained in youth might be an indicator of a well-put-together system. It is hypothesized that a well-wired body is more able to respond effectively to environmental insults…”[5]

A study of one million Swedish men found showed “a strong link between cognitive ability and the risk of death.”[6][7][8][9]

People with higher IQ test scores tend to be less likely to smoke or drink alcohol heavily. They also eat better diets, and they are more physically active. So they have a range of better behaviours that may partly explain their lower mortality risk.—-Dr. David Batty[7]

A similar study of 4,289 former US soldiers showed a similar relationship between IQ and mortality.[7][8][10]

The strong correlation between intelligence and mortality has raised questions as to how better public education could delay mortality.[11]

There is a known inverse correlation between socioeconomic position and health. A 2006 study found that controlling for IQ caused a marked reduction in this association.[12]

Research in Scotland has shown that a 15-point lower IQ meant people had a fifth less chance of seeing their 76th birthday, while those with a 30-point disadvantage were 37% less likely than those with a higher IQ to live that long.[13]

Here is my take on all of this: Conductors, baseball players, and corporate executives (among members of other identifiable groups) tend to be long-lived because they tend to be physically and mentally vigorous, to begin with. Conductors must possess stamina and intelligence to do what they do.To rise in the corporate world, one must be capable of working long hours, putting up with a lot of stress, and coping with many complex issues. And, contrary to the popular view of athletes as “dumb,” they are not (as a group); in fact, intelligence and good health (a key component of athleticism) are are tightly bound.

Moreover, conductors (who make music), ballplayers (who play a game) and corporate executives (who attain high status and high incomes) are engaged in occupations that yield what Robert Atlas calls “gratifying stress.” And, as persons who usually enjoy above-average incomes, they are likely to enjoy better diets and better health-care than most of their contemporaries.

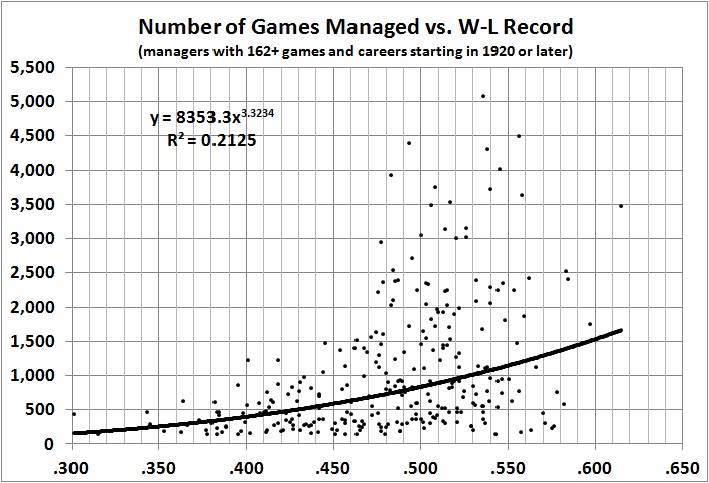
The finding that pitchers do not live as long as other ballplayers supports the view that “gratifying stress” fosters longevity, whereas “frustrating stress” may shorten a person’s life. Pitchers, uniquely among ballplayers, are credited or charged with the wins and losses of their teams. And pitchers, as a group, win only half the time — an ungratifying outcome. Further, pitchers with consistently bad records do not last long in the big leagues, and end their careers having won less than 50 percent of the games for which they were held responsible (i.e., with a won-lost record below .500). Accordingly, more pitchers end their careers with losing records than with winning records: In the history of the major leagues, from 1871 through 2011, there have been 6,744 pitchers with a career record of at least one loss; only 29 percent of them (1,935) had a career won-lost record better than .500.

I conclude that occupation — conducting, playing professional baseball, etc. — is a function of the main influences on longevity — mental and physical robustness — and not the other way around. Occupation influences longevity only to the extent that increases it (at the margin) by bestowing “gratifying stress” and/or material rewards, or reduces it (at the margin) by bestowing “frustrating stress” and/or exposure to health-or life-threatening conditions.

*   *   *

The footnotes are below the fold.
Continue reading “Conducting, Baseball, and Longevity”

Time Out

It’s not that I’m going “on hiatus” as they say in blogworld. It’s just that I have a couple of things to “share” that aren’t about politics or economics. I maintain, and occasionally update, a blog called Americana, Etc., which is about “baseball, history, humor, language, literature, movies, music, nature, nostalgia, philosophy, psychology, and other (mostly) apolitical subjects.” (Actually, I do address history, language, literature, music, philosophy, and psychology here, but not in an apolitical way.)

In a relative frenzy of activity at Americana, Etc., I added yesterday (after two weeks’ work) a post in which I compare the greatest hitters in the history of the American League. (That’s a baseball thing-y, in case you’re wondering.) The title of the post, oddly enough, is “The American League’s Greatest Hitters.” Here’s a teaser: Ichiro Suzuki supplants Ty Cobb as the best all-time hitter — batting-average-wise — in the history of the American League. To find out why, and to see the entire list of 120 top hitters, click on the link in the sentence before last. [UPDATE: With a further adjustment to take age into account, Ty Cobb reclaims his title as the all-time American League batting champion. Ichiro Suzuki drops to second place. Shoeless Joe Jackson remains in third place. Details here.]

Today’s entry is “The Quality of Films over the Decades,” in which I revisit and reaffirm earlier posts to the effect that movies have been in a long decline since 1942.

Thank you for your kind attention.

-30-