THREE GRAPHS AND ONE LINK UPDATED ON 06/08/18. SUBSTANCE OF TEXT UNCHANGED.
This entry is prompted by a recent spate of posts and articles about the rising mortality rate among non-Hispanic whites without a college degree (hereinafter working-class whites, for convenience). Thomas Lifson characterizes the trend as “a spiritual crisis”, after saying this:
White males, in large numbers, are simply losing their will to live, and as a result, they are dying so prematurely and in such large numbers that a startling demographic gap has emerged. [“Stunning Evidence that the Left Has Won its War on White Males“, American Thinker, March 26, 2017]
Later in the piece, Lifson gets to the “war” on white males:
For at least four decades, white males have been under continuous assault as bearers of “white privilege” and beneficiaries of sexism. Special preferences and privileges have been granted to other groups, but that is the least of it. More importantly, the very basis of the psychological self-worth of white males have been under attack. White males are frequently instructed by authority figures in education and the media that they are responsible for most of the evils of the modern world, that the achievements of Euro-American civilization are a net loss for humanity, stained by exploitation, racism, unfairness, and every other collective evil the progressive mind can manufacture.
Some white males are relatively unscathed by the psychological warfare, but others are more vulnerable. Those who have educational, financial, or employment achievements that have rewarded their efforts may be able to keep going as productive members of society, their self-esteem resting on tangible fruits of their work and social position. But other white males, especially those who work with their hands and have been seeing job opportunities contract or disappear, have been losing the basis for a robust sense of self-worth as their job opportunities disappear.
We now have statistical evidence that political correctness kills.
We have no such thing. The recent trend isn’t yet significant. But it is real, and government is the underlying cause.
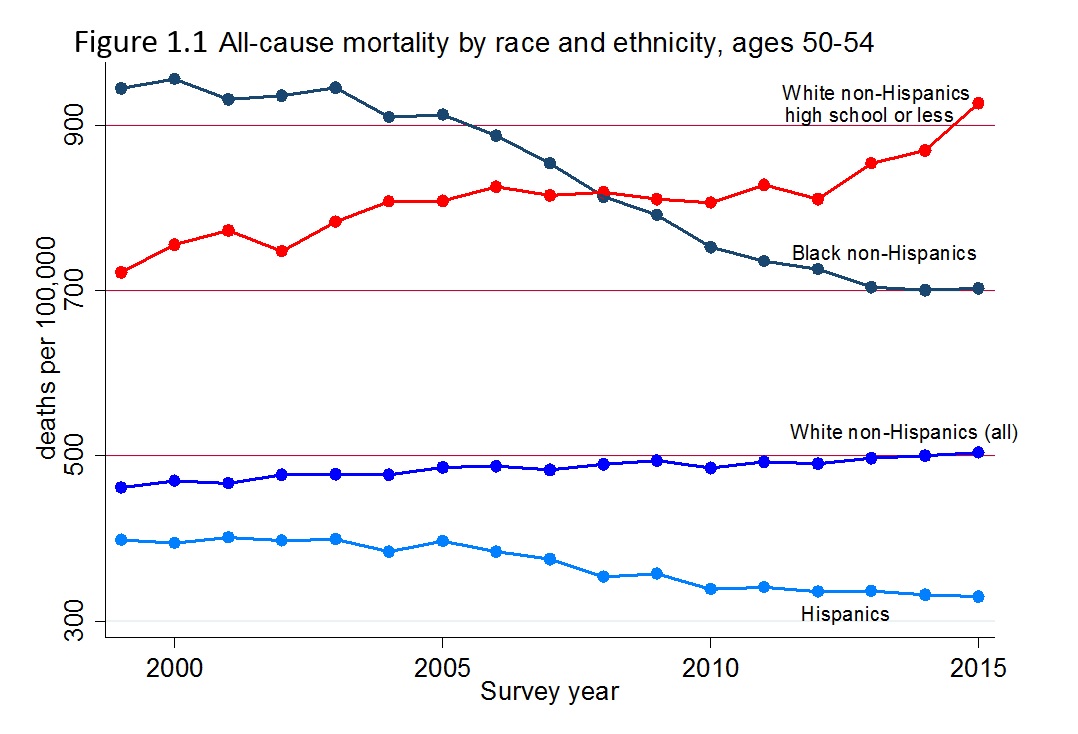
To begin at the beginning, the source of the spate of articles about the rising mortality rate of working-class whites is Anne Case and Angus Deaton’s “Mortality and Morbidity in the 21st Century” (Brookings Institution, Brookings Papers on Economic Activity (conference edition), March 17, 2017). Three of the paper’s graphs set the scene. This one shows mortality trends in the United States:
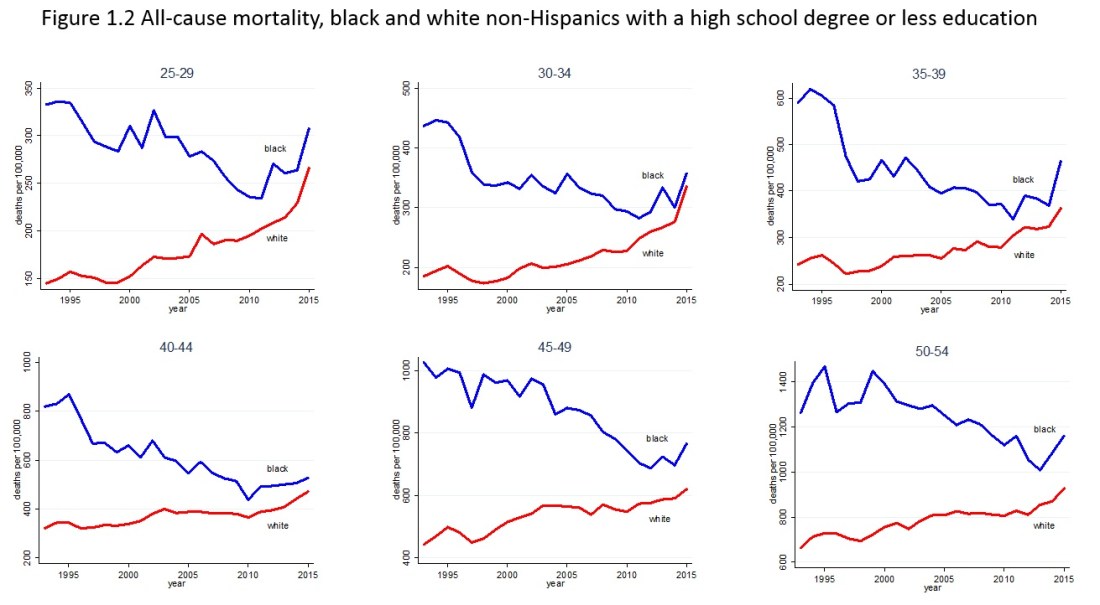
The next figure indicates that the phenomenon isn’t unique to non-Hispanic whites in the age 50-54 bracket:
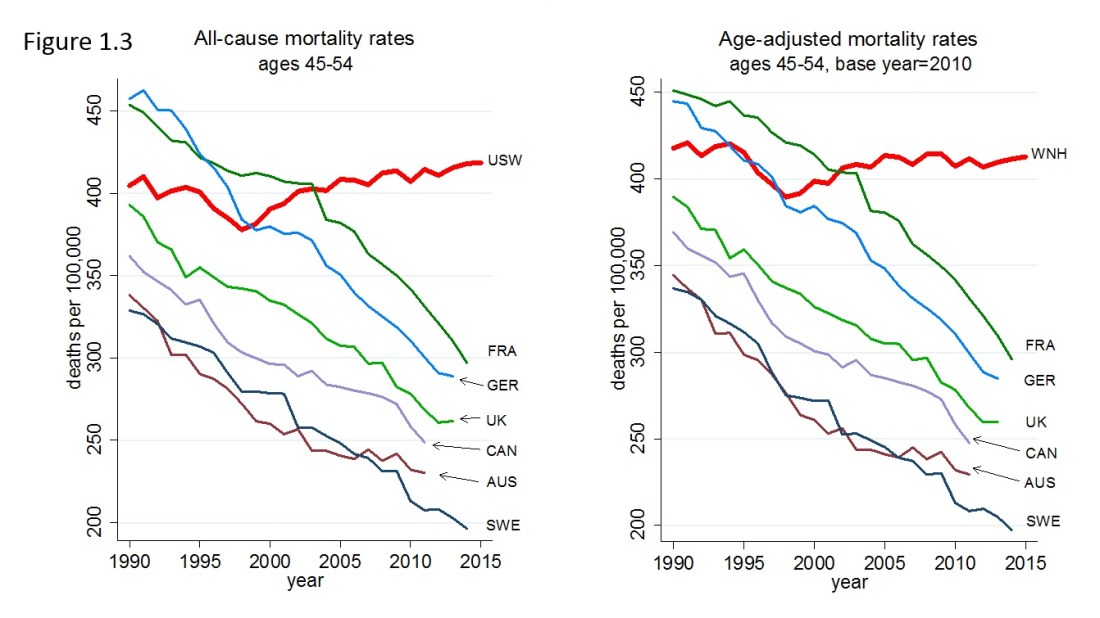
But the trend among American whites defies the trends in several other Western nations:
Whence the perverse trend? It seems due mainly to suicidal despair:

How do these recent trends stack up against the long view? I couldn’t find a long time series for drug, alcohol, and suicide mortality. But I did find a study by Feijin Luo et al. that traces suicide rates from just before the onset of the Great Depression to just before the onset of the Great Recession — “Impact of Business Cycles on US Suicide Rates, 1928–2007” (American Journal of Public Health, June 2011). Here are two key graphs from the report:
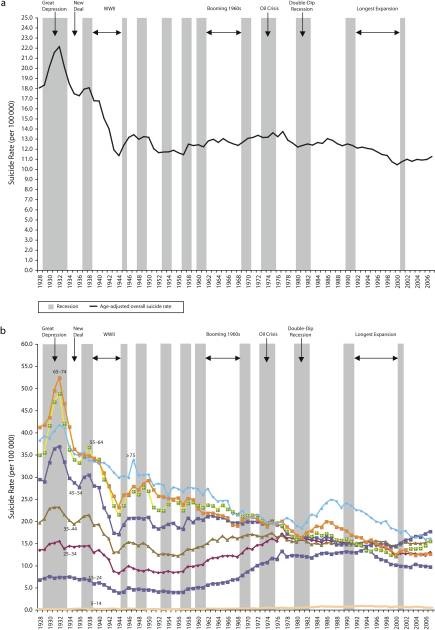
The graphs don’t reproduce well, so the following quotations will be of help:
The overall suicide rate fluctuated from 10.4 to 22.1 over the 1928–2007 period. It peaked in 1932, the last full year of the Great Depression, and bottomed in 2000. The overall suicide rate decreased from 18.0 in 1928 to 11.2 in 2007. However, most of the decline occurred before 1945; after that it fluctuated until the mid-1950s, and then it gradually moved up until the late 1970s. The overall suicide rate resumed its downward trend from the mid-1980s to 2000, followed by a trend reversal in the new millennium.
Figure 1a [top] shows that the overall suicide rate generally increased in recessions, especially in severe recessions that lasted longer than 1 year. The largest increase in the overall suicide rate occurred during the Great Depression (1929–1933), when it surged from 18.0 in 1928 to 22.1 (the all-time high) in 1932, the last full year of the Great Depression. [The Great Depression actually lasted until 1940: TEA.] This increase of 22.8% was the highest recorded for any 4-year interval during the study period. The overall suicide rate also rose during 3 other severe recessions: [the recession inside the Great Depression] (1937–1938), the oil crisis (1973–1975), and the double-dip recession (1980–1982). Not only did the overall suicide rate generally rise during recessions; it also mostly fell during expansions…. However, the overall suicide rate did not fall during the 1960s (i.e., 1961–1969), a notable phenomenon that will be explained by the different trends of age-specific suicide rates.
The age-specific suicide rates displayed more variations than did the overall suicide rate, and the trends of those age-specific suicide rates were largely different. As shown in Figure 1b [bottom], from 1928–2007, the suicide rates of the 2 elderly groups (65–74 years and 75 years and older) and the oldest middle-age group (55–64 years) experienced the most remarkable decline. The suicide rates of those groups declined in both pre- and postwar periods. The suicide rates of the other 2 middle-aged groups (45–54 years and 35–44 years) also declined from 1928–2007, which we attributed to the decrease during the war period more than offsetting the increase in the postwar period. In contrast with the declining suicide rates of the 2 elderly and 3 middle-age groups, the suicide rates of the 2 young groups (15–24 years and 25–34 years) increased or just marginally decreased from 1928–2007. The 2 young groups experienced a marked increase in suicide rates in the postwar period. The suicide rate of the youngest group (5–14 years) also increased from 1928–2007. However, because of its small magnitude, we do not include this increase in the subsequent discussion.
We noted that the suicide rate of the group aged 65–74 years, the highest of all age groups until 1936, declined the most from 1928 to 2007. That rate started at 41.2 in 1928 and dropped to 12.6 in 2007, peaking at 52.3 in 1932 and bottoming at 12.3 in 2004. By contrast, the suicide rate of the group aged 15–24 years increased from 6.7 in 1928 to 9.7 in 2007. That rate peaked at 13.7 in 1994 and bottomed at 3.8 in 1944, and it generally trended upward from the late 1950s to the mid-1990s. The suicide rate differential between the group aged 65–74 years and the group aged 15–24 years generally decreased until 1994, from 34.5 in 1928 to 1.6 in 1994.
All age groups experienced a substantial increase in their suicide rates during the Great Depression, and most groups (35–44 years, 45–54 years, 55–64 years, 65–74 years, and 75 years and older) set record-high suicide rates in 1932; but they reacted differently to many other recessions, including severe recessions such as the [1937-1938 recession] and the oil crisis. Their reactions were different during expansions as well, most notably in the 1960s, when the suicide rates of the 3 oldest groups (75 years and older, 65–74 years, and 55–64 years) declined moderately, and those of the 3 youngest groups (15–24 years, 25–34 years, and 35–44 years) rose noticeably….
[T]he overall suicide rate and the suicide rate of the group aged 45–54 years were associated with business cycles at the significance level of 1%; the suicide rates of the groups aged 25–34 years, 35–44 years, and 55–64 years were associated with business cycles at the significance level of 5%; and the suicide rates of the groups aged 15–24 years, 65–74 years, and 75 years and older were associated with business cycles at nonsignificant levels. To sumarize, the overall suicide rate was significantly countercyclical; the suicide rates of the groups aged 25–34 years, 35–44 years, 45–54 years, and 55–64 years were significantly countercyclical; and the suicide rates of the groups aged 15–24 years, 65–74 years, and 75 years and older were not significantly countercyclical.
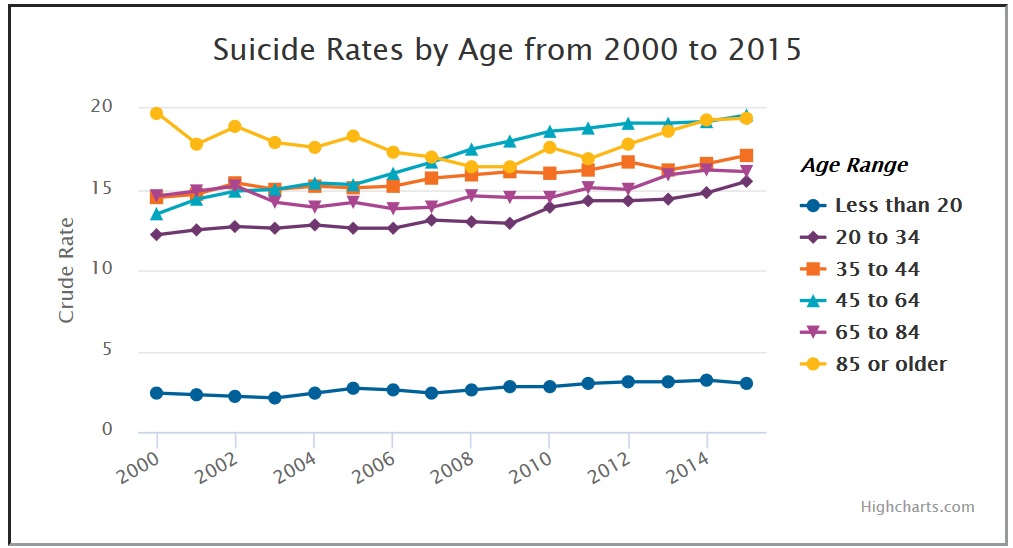
The following graph, obtained from the website of the American Foundation for Suicide Prevention, extends the age-related analysis to 2015:
And this graph, from the same source, shows that the rising suicide rate is concentrated among whites and American Indians:
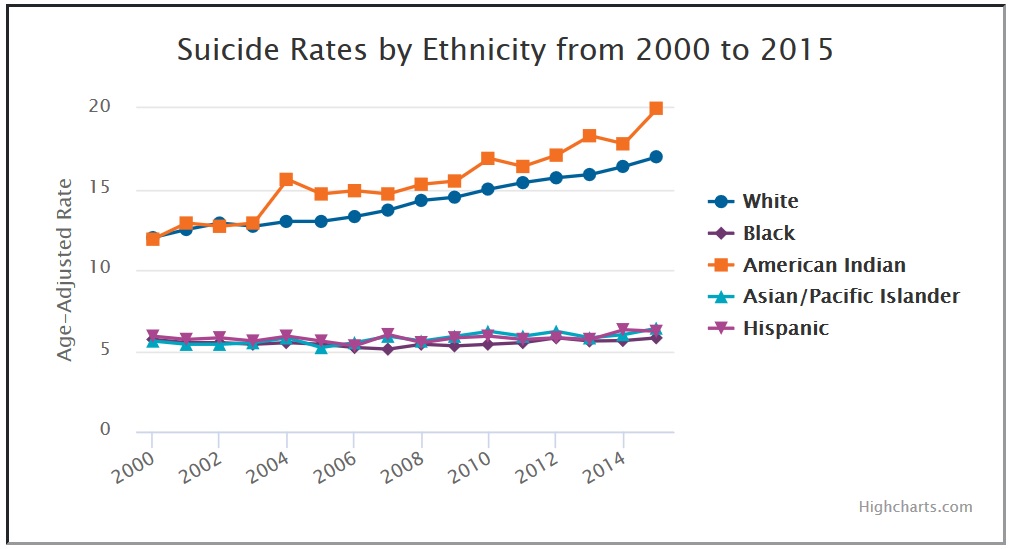
Though this graph encompasses deaths from all causes, the opposing trends for blacks and whites suggest strongly that working-class whites in all age groups have become much more prone to suicidal despair in the past 20 years. Moreover, the despair has persisted through periods of economic decline and economic growth (slow as it has been).
Why? Case and Deaton opine:
[S]ome of the most convincing discussions of what has happened to working class whites emphasize a long-term process of decline, or of cumulative deprivation, rooted in the steady deterioration in job opportunities for people with low education…. This process … worsened over time, and caused, or at least was accompanied by, other changes in society that made life more difficult for less-educated people, not only in their employment opportunities, but in their marriages, and in the lives of and prospects for their children. Traditional structures of social and economic support slowly weakened; no longer was it possible for a man to follow his father and grandfather into a manufacturing job, or to join the union. Marriage was no longer the only way to form intimate partnerships, or to rear children. People moved away from the security of legacy religions or the churches of their parents and grandparents, towards churches that emphasized seeking an identity, or replaced membership with the search for connections…. These changes left people with less structure when they came to choose their careers, their religion, and the nature of their family lives. When such choices succeed, they are liberating; when they fail, the individual can only hold him or herself responsible….
As technical change and globalization reduced the quantity and quality of opportunity in the labor market for those with no more than a high school degree, a number of things happened that have been documented in an extensive literature. Real wages of those with only a high school degree declined, and the college premium increased….
Lower wages made men less marriageable, marriage rates declined, and there was a marked rise in cohabitation, then much less frowned upon than had been the case a generation before…. [B]eyond the cohort of 1940, men and women with less than a BA degree are less likely to have ever been married at any given age. Again, this is not occurring among those with a four-year degree. Unmarried cohabiting partnerships are less stable than marriages. Moreover, among those who do marry, those without a college degree are also much more likely to divorce than are those with a degree….
These accounts share much, though not all, with Murray’s … account [in Coming Apart] of decline among whites in his fictional “Fishtown.” Murray argues that traditional American virtues are being lost among working-class white Americans, especially the virtue of industriousness. The withdrawal of men from the labor force reflects this loss of industriousness; young men in particular prefer leisure—which is now more valuable because of video games … —though much of the withdrawal of young men is for education…. The loss of virtue is supported and financed by government payments, particularly disability payments….
In our account here, we emphasize the labor market, globalization and technical change as the fundamental forces, and put less focus on any loss of virtue, though we certainly accept that the latter could be a consequence of the former. Virtue is easier to maintain in a supportive environment. Yet there is surely general agreement on the roles played by changing beliefs and attitudes, particularly the acceptance of cohabitation, and of the rearing of children in unstable cohabiting unions.
These slow-acting and cumulative social forces seem to us to be plausible candidates to explain rising morbidity and mortality, particularly their role in suicide, and with the other deaths of despair, which share much with suicides. As we have emphasized elsewhere, … purely economic accounts of suicide have consistently failed to explain the phenomenon. If they work at all, they work through their effects on family, on spiritual fulfillment, and on how people perceive meaning and satisfaction in their lives in a way that goes beyond material success. At the same time, cumulative distress, and the failure of life to turn out as expected is consistent with people compensating through other risky behaviors such as abuse of alcohol, overeating, or drug use that predispose towards the outcomes we have been discussing….
What our data show is that the patterns of mortality and morbidity for white non-Hispanics without a college degree move together over lifetimes and birth cohorts, and that they move in tandem with other social dysfunctions, including the decline of marriage, social isolation, and detachment from the labor force…. Whether these factors (or factor) are “the cause” is more a matter of semantics than statistics. The factor could certainly represent some force that we have not identified, or we could try to make a case that declining real wages is more fundamental than other forces. Better, we can see globalization and automation as the underlying deep causes. Ultimately, we see our story as about the collapse of the white, high school educated, working class after its heyday in the early 1970s, and the pathologies that accompany that decline. [Op. cit., pp. 29-38]
The seemingly rigorous and well-reasoned analyses reported by Case-Deaton and Luo et al. are seriously flawed, for these reasons:
- Case and Deaton’s focus on events since 1990 is analogous to a search for lost keys under a street lamp because that’s where the light is. As shown in the graphs taken from Luo et al., suicide rates have at various times risen (and dropped) as sharply as they have in recent years.
- Luo et al. address a much longer time span but miss an important turning point, which came during World War II. Because of that, they resort to a strained, non-parametric analysis of the relationship between the suicide rate and business cycles.
- It is misleading to focus on age groups, as opposed to birth-year cohorts. For example, persons in the 50-54 age group in 1990 were born between 1936 and 1940, but in 2010 persons in the 50-54 age group were born between 1956 and 1960. The groups, in other words, don’t represent the same cohort. The only meaningful suicide rate for a span of more than a few years is the rate for the entire population.
I took a fresh look at the overall suicide rate and its relationship to the state of the economy. First, I extended the overall, age-adjusted suicide rate for 1928-2007 provided by Luo et al. in Supplementary Table B (purchase required) by splicing it with a series for 1981-2016 from the Centers for Disease Control and Prevention. I then drew on the database at Measuring Worth to derive year-over-year changes in real GDP for 1928-2016. Here’s an overview of the two time series:
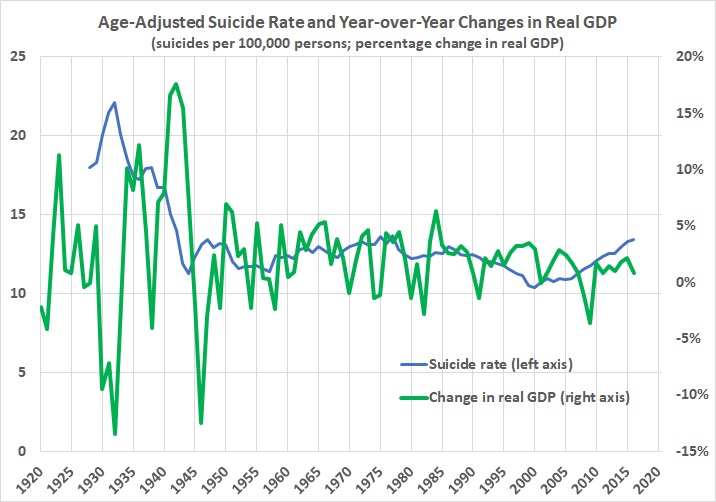
The suicide rate doesn’t drop below 15 until 1942. From 1943 through 2016 it vacillates in a narrow range between 10.4 (2000) and 13.7 (1977). Despite the rise since 2000, the overall rate still hasn’t returned to the 1977 peak. And only in recent years has the overall rate reached figures that were reached often between 1943 and 1994.
Moreover, the suicide rate from 1928 through 1942 is strongly correlated with changes in real GDP. But the rate from 1943 through 2016 (or any significant subset of those years) is not:
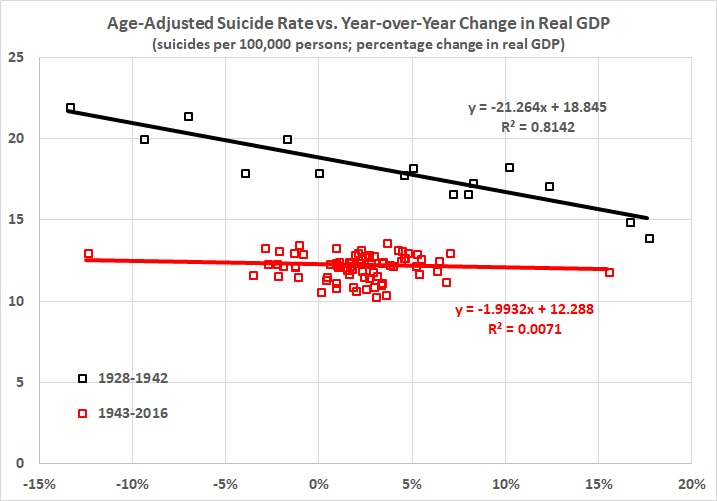
Something happened during the war years to loosen the connection between the state of the economy and the suicide rate. That something was the end of the pervasive despair that the Great Depression inflicted on huge numbers of Americans. It’s as if America had a mood transplant, one which has lasted for more than 70 years. The recent uptick in the rate of suicide (and the accompanying rise in slow-motion suicide) is sad because it represents wasted lives. But, as noted above, it hasn’t returned to its 1977 peak, and is just slightly more than one standard deviation above the 1943-2016 average of 12.3 suicides per 100,000 persons:
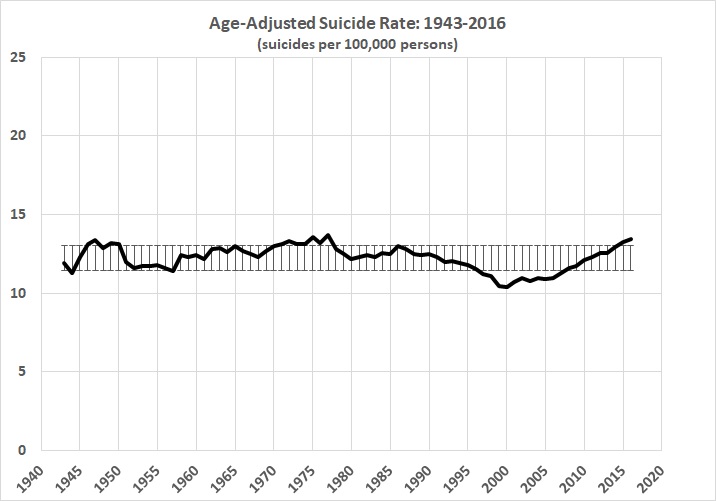
(It seems to me that researchers ought to be asking why the rate was so low for about 20 years, beginning in the 1980s.)
Perhaps the recent uptick among working-class whites can be blamed, in part, on loss of “virtue”, technological change, and globalization — as Case and Deaton claim. But they fail to notice the bigger elephant in the room: the destructive role of government.
Technological change and globalization simply reinforce the disemployment effects of the long-term decline in the rate of economic growth. I’ve addressed the decline many times, most recently in “Presidents and Economic Growth“. The decline has three main causes, all attributable to government action, which I’ve assessed in “The Rahn Curve Revisited“: the rise in government spending as a fraction of GDP, the rise in the number of regulations on the books, and the (unsurprising) effect of those variables on private business investment. The only silver lining has been a decline in the rate of inflation, which is unsurprising in view of the general slow-down of economic growth. Many jobs may have disappeared because of technological change and many jobs may have been “shipped overseas”, but there would be a lot more jobs if government had kept its hands off the economy and out of Americans’ wallets.
Moreover, the willingness of Americans — especially low-skill Americans — to seek employment has been eroded by various government programs: aid to the families of dependent children (a boon to unwed mothers and a bane to family stability), food stamps, disability benefits, the expansion of Medicaid, subsidized health-care for “children” under the age of 26, and various programs that encourage women to work outside the home, thus fostering male unemployment.
Economist Edward Glaeser puts it this way:
The rise of joblessness—especially among men—is the great American domestic crisis of the twenty-first century. It is a crisis of spirit more than of resources. The jobless are far more prone to self-destructive behavior than are the working poor. Proposed solutions that focus solely on providing material benefits are a false path. Well-meaning social policies—from longer unemployment insurance to more generous disability diagnoses to higher minimum wages—have only worsened the problem; the futility of joblessness won’t be solved with a welfare check….
The New Deal saw the rise of public programs that worked against employment. Wage controls under the National Recovery Act made it difficult for wages to fall enough to equilibrate the labor market. The Wagner Act strengthened the hand of unions, which kept pay up and employment down. Relief efforts for the unemployed, including federal make-work jobs, eased the pressure on the jobless to find private-sector work….
… In 2011, more than one in five prime-age men were out of work, a figure comparable with the Great Depression. But while employment came back after the Depression, it hasn’t today. The unemployment rate may be low, but many people have quit the labor force entirely and don’t show up in that number. As of December 2016, 15.2 percent of prime-age men were jobless—a figure worse than at any point between World War II and the Great Recession, except during the depths of the early 1980s recession….
Joblessness is disproportionately a condition of the poorly educated. While 72 percent of college graduates over age 25 have jobs, only 41 percent of high school dropouts are working. The employment-rate gap between the most and least educated groups has widened from about 6 percent in 1977 to almost 15 percent today….
Both Franklin Roosevelt and Lyndon Johnson aggressively advanced a stronger safety net for American workers, and other administrations largely supported these efforts. The New Deal gave us Social Security and unemployment insurance, which were expanded in the 1950s. National disability insurance debuted in 1956 and was made far more accessible to people with hard-to-diagnose conditions, like back pain, in 1984. The War on Poverty delivered Medicaid and food stamps. Richard Nixon gave us housing vouchers. During the Great Recession, the federal government temporarily doubled the maximum eligibility time for receiving unemployment insurance.
These various programs make joblessness more bearable, at least materially; they also reduce the incentives to find work. Consider disability insurance. Industrial work is hard, and plenty of workers experience back pain. Before 1984, however, that pain didn’t mean a disability check for American workers. After 1984, though, millions went on the disability rolls. And since disability payments vanish if the disabled person starts earning more than $1,170 per month, the disabled tend to stay disabled…. Disability insurance alone doesn’t entirely explain the rise of long-term joblessness—only one-third or so of jobless males get such benefits. But it has surely played a role.
Other social-welfare programs operate in a similar way. Unemployment insurance stops completely when someone gets a job, … [thus] the unemployed tend to find jobs just as their insurance payments run out. Food-stamp and housing-voucher payments drop 30 percent when a recipient’s income rises past a set threshold by just $1. Elementary economics tells us that paying people to be or stay jobless will increase joblessness….
The rise of joblessness among the young has been a particularly pernicious effect of the Great Recession. Job loss was extensive among 25–34-year-old men and 35–44-year-old men between 2007 and 2009. The 25–34-year-olds have substantially gone back to work, but the number of employed 35–44-year-olds, which dropped by 2 million at the start of the Great Recession, hasn’t recovered. The dislocated workers in this group seem to have left the labor force permanently.
Unfortunately, policymakers seem intent on making the joblessness crisis worse. The past decade or so has seen a resurgent progressive focus on inequality—and little concern among progressives about the downsides of discouraging work. Advocates of a $15 minimum hourly wage, for example, don’t seem to mind, or believe, that such policies deter firms from hiring less skilled workers. The University of California–San Diego’s Jeffrey Clemens examined states where higher federal minimum wages raised the effective state-level minimum wage during the last decade. He found that the higher minimum “reduced employment among individuals ages 16 to 30 with less than a high school education by 5.6 percentage points,” which accounted for “43 percent of the sustained, 13 percentage point decline in this skill group’s employment rate.”
The decision to prioritize equality over employment is particularly puzzling, given that social scientists have repeatedly found that unemployment is the greater evil…. One recent study estimated that unemployment leads to 45,000 suicides worldwide annually. Jobless husbands have a 50 percent higher divorce rate than employed husbands. The impact of lower income on suicide and divorce is much smaller. The negative effects of unemployment are magnified because it so often becomes a semipermanent state.
Time-use studies help us understand why the unemployed are so miserable. Jobless men don’t do a lot more socializing; they don’t spend much more time with their kids. They do spend an extra 100 minutes daily watching television, and they sleep more. The jobless also are more likely to use illegal drugs….
Joblessness and disability are also particularly associated with America’s deadly opioid epidemic…. The strongest correlate of those deaths is the share of the population on disability. That connection suggests a combination of the direct influence of being disabled, which generates a demand for painkillers; the availability of the drugs through the health-care system; and the psychological misery of having no economic future.
Increasing the benefits received by nonemployed persons may make their lives easier in a material sense but won’t help reattach them to the labor force. It won’t give them the sense of pride that comes from economic independence. It won’t give them the reassuring social interactions that come from workplace relationships. When societies sacrifice employment for a notion of income equality, they make the wrong choice. [“The War on Work — And How to End It“, City Journal, special issue: The Shape of Work to Come 2017]
In sum, the rising suicide rate — whatever its significance — is a direct and indirect result of government policies. “We’re from the government and we’re here to help” is black humor, at best. The left is waging a war on white males. But the real war — the war that kills — is hidden from view behind the benign facade of governmental “compassion”.
Having said all of that, I will end on a cautiously positive note. There still is upward mobility in America. Not all working-class people are destined for suicidal despair, only those at the margin who have pocketed the fool’s gold of government handouts.
Other related posts:
Bubbling Along
Economic Mobility Is Alive and Well in America
H.L. Mencken’s Final Legacy
The Problem with Political Correctness
“They Deserve to Die”?
Mencken’s Pearl of Wisdom
Class in America
Another Thought or Two about Class
The Midwest Is a State of Mind


