CO2 Fail (Revisited)

ADDENDUM BELOW

I observed, in November 2020, that there is no connection between CO2 emissions and the amount of CO2 in the atmosphere. This suggests that emissions have little or no effect on the concentration of CO2. A recent post at WUWT notes that emissions hit a record high in 2021. What the post doesn’t address is the relationship between emissions and the concentration of CO2 in the atmosphere.

See for yourself. Here’s the WUWT graph of emissions from energy combustion and industrial processes:

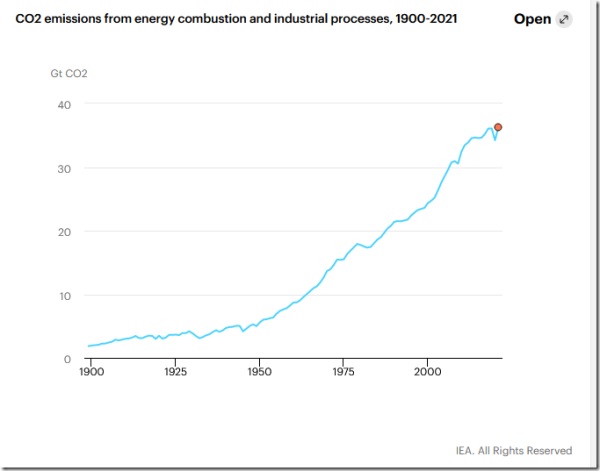
Here’s the record of atmospheric CO2:

It’s obvious that CO2 has been rising monotonically, with regular seasonal variations, while emissions have been rising irregularly — even declining and holding steady at times. This relationship (or lack thereof) supports the thesis that the rise in atmospheric CO2 is the result of warming, not its cause.

ADDENDUM (04/09/22):

Dr. Roy Spencer, in a post at his eponymous blog, writes:

[T]he greatest correlations are found with global (or tropical) surface temperature changes and estimated yearly anthropogenic emissions. Curiously, reversing the direction of causation between surface temperature and CO2 (yearly changes in SST [dSST/dt] being caused by increasing CO2) yields a very low correlation.

That is to say, temperature changes seem to drive CO2 levels, not the other way around (which is the conventional view).


Sources for CO2 levels:

https://gml.noaa.gov/ccgg/trends/gl_data.html

https://gml.noaa.gov/ccgg/trends/data.html


Related reading: Clyde Spencer, “Anthropogenic CO2 and the Expected Results from Eliminating It” [zero, zilch, zip, nada], Watts Up With That?, March 22, 2022

CO2 Fail

Anthony Watts of Watts Up With That? catches the U.N. in a moment of candor:

From a World Meteorological Organization (WMO) press release titled “Carbon dioxide levels continue at record levels, despite COVID-19 lockdown,” comes this statement about the effects of carbon dioxide (CO2) reductions during the COVID-19 lockdown:

“Preliminary estimates indicate a reduction in the annual global emission between 4.2% and 7.5%. At the global scale, an emissions reduction this scale will not cause atmospheric CO2 to go down. CO2 will continue to go up, though at a slightly reduced pace (0.08-0.23 ppm per year lower). This falls well within the 1 ppm natural inter-annual variability. This means that on the short-term the impact [of CO2 reduction] of the COVID-19 confinements cannot be distinguished from natural variability…”

Let this sink in: The WMO admits reduce carbon dioxide emissions are having no effect on climate that is distinguishable from natural variability.

The WMO acknowledges that after our global economic lockdown, where CO2 emissions from travel, industry, and power generation were all curtailed, there wasn’t any measurable difference in global atmospheric CO2 levels. Zero, zilch, none, nada.

Of course, we already knew this and wrote about it on Climate at a Glance: Coronavirus Impact on CO2 Levels. An analysis by climate scientist Dr. Roy Spencer showed that despite crashing economies and large cutbacks in travel, industry, and energy generation, climate scientists have yet to find any hint of a drop in atmospheric CO2 levels.

The graph in Watts’s post depicts CO2 readings only for Mauna Loa, and only through April 2020. The following graph covers CO2 readings for Mauna Loa (through October 2020) and for a global average of marine surface sites (through August 2020):

The bottom line remains the same: There’s nothing to see here, folks, just an uninterrupted pattern of seasonal variations.

Climate-change fanatics will have to look elsewhere than human activity for the rise in atmospheric CO2.


Data definitions and source:

https://www.esrl.noaa.gov/gmd/ccgg/trends/mlo.html

ftp://aftp.cmdl.noaa.gov/products/trends/co2/co2_mm_mlo.txt

https://www.esrl.noaa.gov/gmd/ccgg/trends/global.html

ftp://aftp.cmdl.noaa.gov/products/trends/co2/co2_mm_gl.txt