Just Another Thing or Two about COVID-19

Though it’s tough to make predictions, especially about the future, and I sort of promised not to make any more predictions about the spread of COVID-19 in the United States because the data are unreliable (examples at the link and here). But I can’t resist saying a few more things about the matter.

Specifically, since my last substantive post about COVID-19 statistics, I now project 2 million cases and 135,000 deaths by mid-August, as against my earlier projections of 1.3 million and 90,000. The new estimates rely on the same database as the old ones, so they aren’t any more reliable than the old ones.

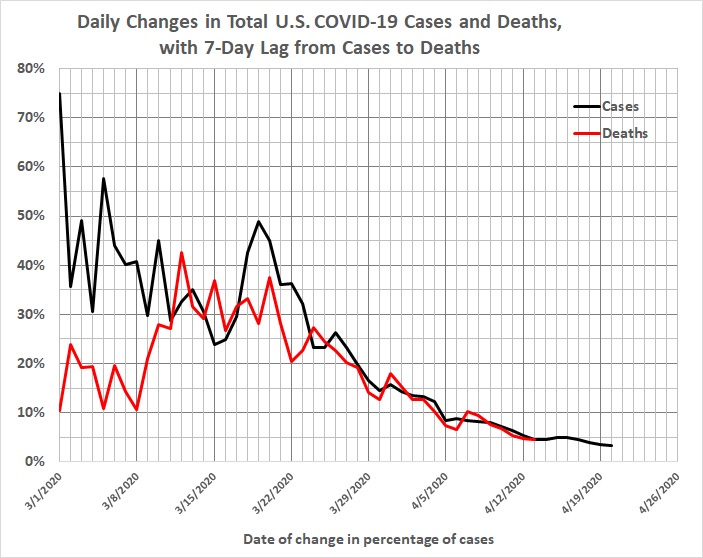
But I have revised my calculations so that they are based on 7-day average numbers of cases and deaths. This is an attempt to smooth over obvious lags in reporting (sudden drops in numbers of cases and deaths followed by sudden surges).

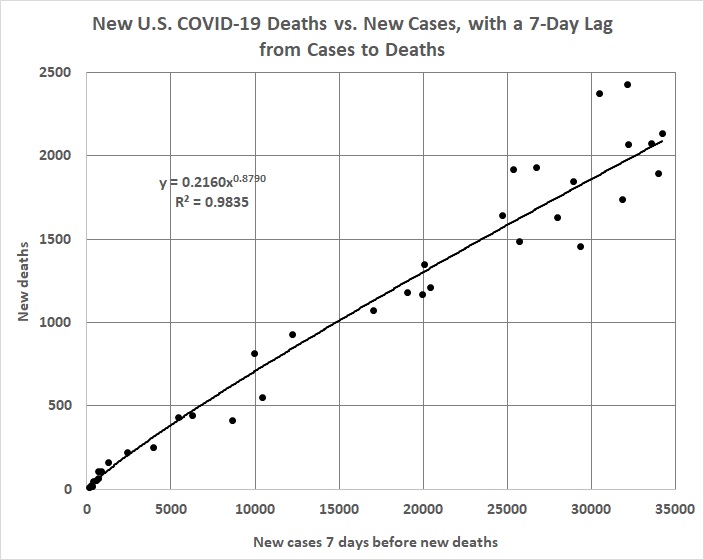
The equations in these two graphs …

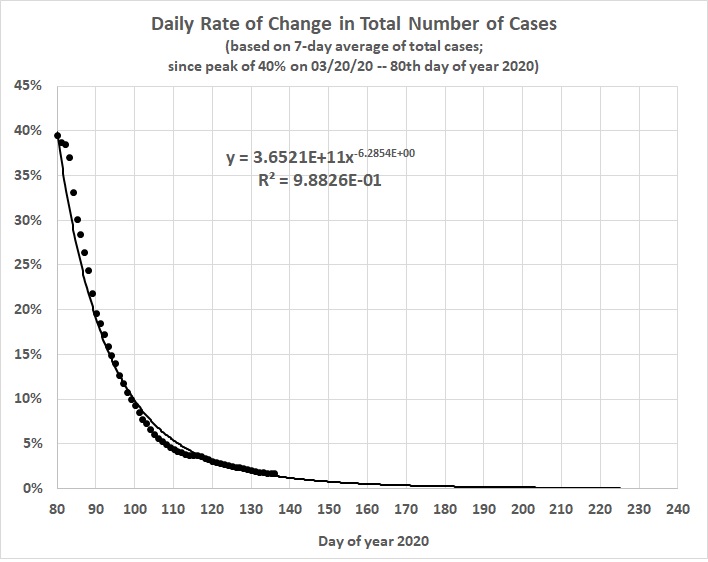
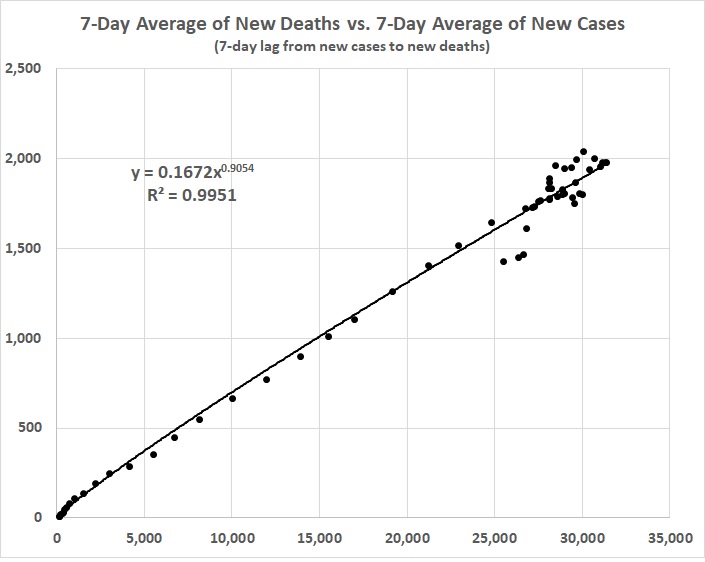
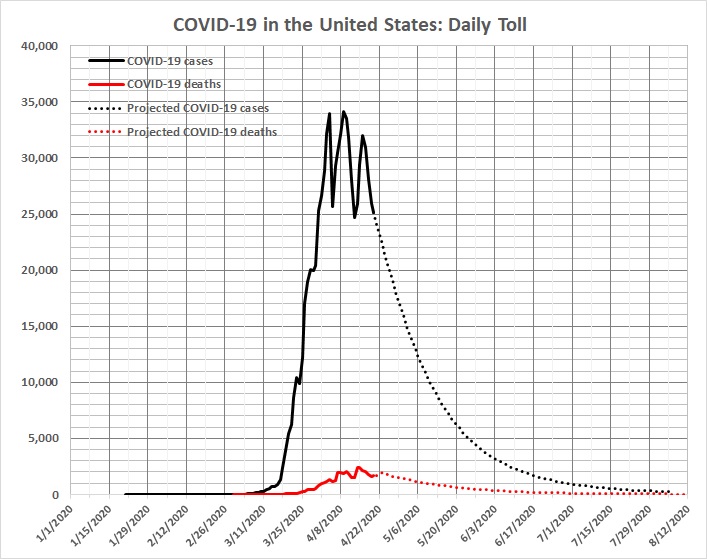
… yield these projections:

Those are nationwide numbers. The good news (pending the results of “re-opening”) is that the daily number of new cases has declined sharply from the peaks of late March and late April. But there’s still a long way to go. The first graph in this post is worrisome because recent observations are a bit above the trend line; that is, the incidence of new cases may not be declining quite as rapidly as the equation suggests.

The number of new deaths has declined also, from the peak 7-day average of 2,041 on April 21 to 1,430 as of May 15. Overall, the rate of new deaths per new case seems to have stabilized at 5.7 percent. (The overall percentage will be somewhat higher because the deaths/case rate was higher than 5.7 for quite a while.)

Of course, the situation varies widely from State to State (and, obviously, within each State):

Regional and state variations in death rates
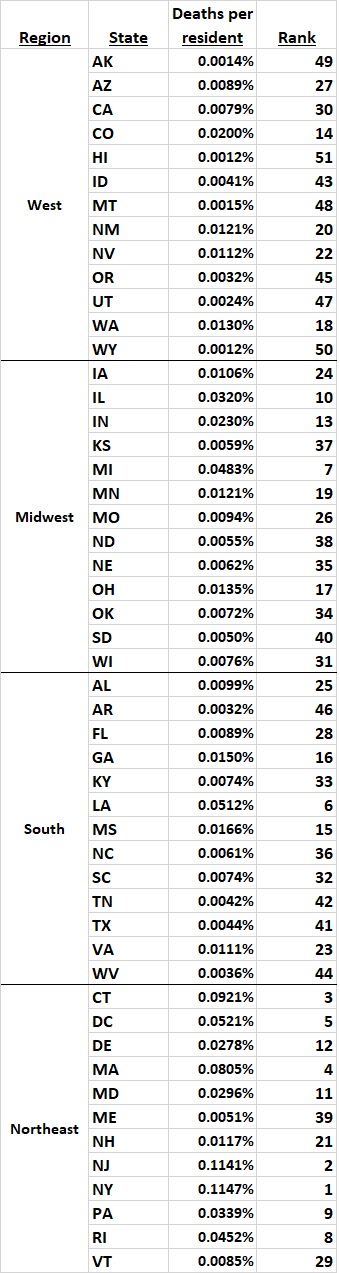
(I am using same assignment of States to regions as used by my data source.)

Nine of the 12 States of the Northeast (including D.C.) are among the top 12 in deaths per resident. The exceptions are the more rural Northeastern States: Main, New Hampshire, and Vermont.

In general, States with large, densely populated metropolitan areas have fared worse than less-urbanized States with smaller cities. That’s unsurprising, of course. But it also underscores the resistance of large swaths of the populace to “New York” rules.


Other related posts:

Contagion Nation?
“Give Me Liberty or Give Me Death”

COVID-19: Public Service Announcement

It has become obvious that COVID-19 stats are unreliable; see this, this, and this, for example. I am therefore withdrawing from the business of reporting official stats and making projections based on them. I leave that endeavor with this thought.

COVID-19 in the United States: Updated Statistics and Projections

Details here.

It is noteworthy that the 2019-2020 flu season was taking a much heavier than normal toll until COVID-19 came along. That alone should cast a lot of doubt on the COVID-19 figures being reported by the States and D.C. Then there is the problem of comorbidity, especially among older persons. In sum, there won’t be a good estimate of the actual death toll of COVID-19  until it’s possible to compute “excess” deaths — taking all other causes into account — when the final tally of deaths in 2020 becomes available a few years hence.

There is also the looming possibility that (1) the COVID-19 infection rate is vastly understated; (2) the COVID-19 fatality rate is therefore vastly overstated; and (3) millions of persons who are already immune to COVID-19 because they have already (unknowingly) recovered from it (believing that they had a cold, the flu, or allergies) and are being held hostage by lockdown orders that are killing the economy. (See this for example.)

COVID-19 in the United States: Latest Projections

UPDATED 04/21/20

Relying on data collected through April 20, I project about 1.3 million cases and 90,000 deaths by the middle of August. Those numbers are 50,000 and 6,000 higher than the projections that I published three days ago. However, the new numbers are based on statistical relationships that, I believe, don’t fully reflect the declining numbers of new cases and deaths discussed below. If the numbers continue to decline rapidly, the estimates of total cases and death should decline, too.

Figure 1 plots total cases and deaths — actual and projected — by date.

Figure 1

Source and notes: Derived from statistics reported by States and the District of Columbia and compiled in Template:2019–20 coronavirus pandemic data/United States medical cases at Wikipedia. The statistics exclude cases and deaths occurring among repatriated persons (i.e., Americans returned from other countries or cruise ships).

But there is good news in the actual and projected numbers of new cases and new deaths (Figure 2).

Figure 2

As shown in Figure 3, the daily percentage changes in new cases and deaths have been declining generally since March 19.

Figure 3

But there is, of course, a lag between new cases and new deaths. The best fit is a 7-day lag (Figure 4).

Figure 4

Figure 5 shows the tight relationship between new cases and new deaths when Figure 3 is adjusted to introduce the 7-day lag.

Figure 5

Figure 6 shows the similarly tight relationship after removing 8 “hot spots” which have the highest incidence of cases per capita — Connecticut, District of Columbia, Louisiana, Massachusetts, Michigan, New Jersey, New York, and Rhode Island.

Figure 6

Figures 5 and 6 give me added confidence that the crisis has peaked.