Facts about Hall-of-Fame Hitters

In this post, I look at the batting records of the 136 position players who accrued most or all of their playing time between 1901 and 2015. With the exception of a bulge in the .340-.345 range, the frequency distribution of lifetime averages for those 136 players looks like a rather ragged normal distribution:

Distribution of HOF lifetime BA

That’s Ty Cobb (.366) at the left, all by himself (1 person = 0.7 percent of the 136 players considered here). To Cobb’s right, also by himself, is Rogers Hornsby (.358). The next solo slot to the right of Hornsby’s belongs to Ed Delahanty (.346). The bulge between .340 and .345 is occupied by Tris Speaker, Billy Hamilton, Ted Williams, Babe Ruth, Harry Heilmann, Bill Terry, Willie Keeler, George Sisler, and Lou Gehrig. At the other end, in the anchor slot, is Ray Schalk (.253), to his left in the next slot are Harmon Killebrew (.256) and Rabbit Maranville (.258). The group in the .260-.265 column comprises Gary Carter, Joe Tinker, Luis Aparacio, Ozzie Smith, Reggie Jackson, and Bill Mazeroski.

Players with relatively low batting averages — Schalk, Killibrew, etc. — are in the Hall of Fame because of their prowess as fielders or home-run hitters. Many of the high-average players were also great fielders or home-run hitters (or both). In any event, for your perusal here’s the complete list of 136 position players under consideration in this post:

Lifetime BA of 136 HOFers

For the next exercise, I normalized the Hall of Famers’ single-season averages, as discussed here. I included only those seasons in which a player qualified for that year’s batting championship by playing in enough games, compiling enough plate appearances, or attaining enough at-bats (the criteria have varied).

For the years 1901-2015, the Hall-of-Famers considered here compiled  1,771 seasons in which they qualified for the batting title. (That’s 13 percent of the 13,463 batting-championship-qualifying seasons compiled by all major leaguers in 1901-2015.) Plotting the Hall-of-Famers’ normalized single-season averages against age, I got this:

HOF batters - normalzed BA by age

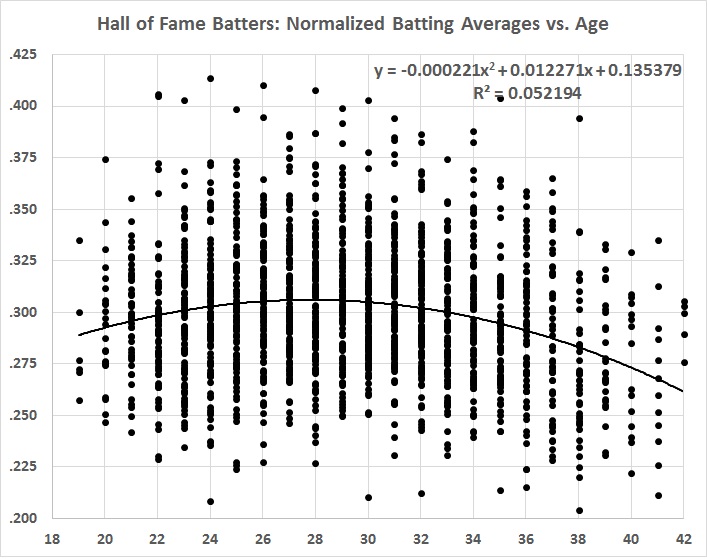
The r-squared value of the polynomial fit, though low, is statistically significant (p<.01). The equation yields the following information:

HOF batters - changes in computed mean BA

The green curve traces the difference between the mean batting average at a given age and the mean batting average at the mean peak age, which is 28.3. For example, by the equation, the average Hall of Famer batted .2887 at age 19, and .3057 at age 28.3 — a rise of .0017 over 9.3 years.

The black line traces the change in the mean batting average from age to age; the increase is positive, though declining from ages 20 through 28, then negative (and still declining) through the rest of the average Hall of Famer’s career.

The red line represents the change in the rate of change, which is constant at -.00044 points (-4.4 percent) a year.

In tabular form:

HOF batters - mean BA stats vs age

Finally, I should note that the combined lifetime batting average of the 136 players is .302, as against the 1901-2015 average of .262 for all players. In other words, the Hall of Famers hit safely in 30.2 percent of at-bats; all players hit safely in 26.2 percent of at-bats. What’s the big deal about 4 percentage points?

To find out, I consulted “Back to Baseball,” in which I found the significant determinants of run-scoring. In the years 1901-1919 (the “dead ball” era), a 4 percentage-point (.040) rise in batting average meant, on average, an increase in runs scored per 9 innings of 1.18. That’s a significant jump in offensive output, given that the average number of runs scored per 9 innings was 3.97 in 1901-1919.

For 1920-2015, a rise in batting average of 4 percentage points meant, on average, an increase in runs scored per 9 innings of 1.03, as against an average number of runs scored per 9 innings of 4.51. That’s also significant, and it doesn’t include the effect of extra-base hits, which Hall of Famers produced at a greater rate than other players.

So Hall of Famers, on the whole, certainly made greater offensive contributions than other players, and some of them were peerless in the field. But do all Hall of Famers really belong in the Hall? No, but that’s the subject of another post.

Griffey and Piazza: True Hall-of-Famers or Not?

Ken Griffey Jr. and Mike Piazza have just been voted into baseball’s Hall of Fame.

Griffey belongs there. Follow this link and you’ll see, in the first table, that he’s number 45 on the list of offensive players whom I consider deserving of the honor.

Piazza doesn’t belong there. He falls short of the 8,000 plate appearances (or more) that I would require to prove excellence over a sustained span. Piazza would be a true Hall of Famer if I relaxed the standard to 7,500 plate appearances, but what’s the point of having standards if they can be relaxed just to reward popularity (or mediocrity)?


Great (Batting) Performances

The normal values of batting average (BA), slugging percentage (SLG), and on-base plus slugging (OPS) have fluctuated over time:

Average major league batting statistics_1901-2015

In sum, no two seasons are alike, and some are vastly different from others. To level the playing field (pun intended), I did the following:

  • Compiled single-season BA, SLG, and OPS data for all full-time batters (those with enough times at bat in a season to qualify for the batting title) from 1901 through 2015 — a total of 14,067 player-seasons. (Source: the Play Index at Baseball-Reference.com.)
  • Normalized (“normed”) each season’s batting statistics to account for inter-seasonal differences. For example, a batter whose BA in 1901 was .272 — the overall average for that year — is credited with the same average as a batter whose BA in 1902 was .267 — the overall average for that year.
  • Ranked the normed values of BA, SLG, and OPS for those 14,067 player-seasons.

I then sorted the rankings to find the top 25 player-seasons in each category:

Top-25 single-season offensive records

I present all three statistics because they represent different aspects of offensive prowess. BA was the most important of the three statistics until the advent of the “lively ball” era in 1919. Accordingly, the BA list is dominated by seasons played before that era, when the name of the game was “small ball.” The SLG and OPS lists are of course dominated by seasons played in the lively ball era.

Several seasons compiled by Barry Bonds and Mark McGwire showed up in the top-25 lists that I presented in an earlier post. I have expunged those seasons because of the dubious nature of Bonds’s and McGwire’s achievements.

The preceding two paragraphs lead to the question of the commensurability (or lack thereof) of cross-temporal statistics. This is from the earlier post:

There are many variations in the conditions of play that have resulted in significant changes in offensive statistics. Among those changes are the use of cleaner and more tightly wound baseballs, the advent of night baseball, better lighting for night games, bigger gloves, lighter bats, bigger and stronger players, the expansion of the major leagues in fits and starts, the size of the strike zone, the height of the pitching mound, and — last but far from least in this list — the integration of black and Hispanic players into major league baseball. In addition to these structural variations, there are others that mitigate against the commensurability of statistics over time; for example, the rise and decline of each player’s skills, the skills of teammates (which can boost or depress a player’s performance), the characteristics of a player’s home ballpark (where players generally play half their games), and the skills of the opposing players who are encountered over the course of a career.

Despite all of these obstacles to commensurability, the urge to evaluate the relative performance of players from different teams, leagues, seasons, and eras is irrepressible. Baseball-Reference.com is rife with such evaluations; the Society for American Baseball Research (SABR) revels in them; many books offer them (e.g., this one); and I have succumbed to the urge more than once.

It is one thing to have fun with numbers. It is quite another thing to ascribe meanings to them that they cannot support.

And yet, it seems right that the top 25 seasons should include so many of Ty Cobb’s, Babe Ruth’s, and of their great contemporaries Jimmie Foxx, Lou Gehrig, Rogers Hornsby, Shoeless Joe Jackson, Nap Lajoie, Tris Speaker, George Sisler, and Honus Wagner. It signifies the greatness of the later players who join them on the lists: Hank Aaron, George Brett, Rod Carew, Roberto Clemente, Mickey Mantle, Willie McCovey, Stan Musial, Frank Thomas, and Ted Williams.

Cobb’s dominance of the BA leader-board merits special attention. Cobb holds 9 of the top 19 slots on the BA list. That’s an artifact of his reign as the American League’s leading hitter in 12 of the 13 seasons from 1907 through 1919. But there was more to Cobb than just “hitting it where they ain’t.” Cobb probably was the most exciting ball player of all time, because he was much more than a hitting machine.

Charles Leershen offers chapter and verse about Cobb’s prowess in his book Ty Cobb: A Terrible Beauty. Here are excerpts of Leershen’s speech “Who Was Ty Cobb? The History We Know That’s Wrong,” which is based on his book:

When Cobb made it to first—which he did more often than anyone else; he had three seasons in which he batted over .400—the fun had just begun. He understood the rhythms of the game and he constantly fooled around with them, keeping everyone nervous and off balance. The sportswriters called it “psychological baseball.” His stated intention was to be a “mental hazard for the opposition,” and he did this by hopping around in the batter’s box—constantly changing his stance as the pitcher released the ball—and then, when he got on base, hopping around some more, chattering, making false starts, limping around and feigning injury, and running when it was least expected. He still holds the record for stealing home, doing so 54 times. He once stole second, third, and home on three consecutive pitches, and another time turned a tap back to the pitcher into an inside-the-park home run.

“The greatness of Ty Cobb was something that had to be seen,” George Sisler said, “and to see him was to remember him forever.” Cobb often admitted that he was not a natural, the way Shoeless Joe Jackson was; he worked hard to turn himself into a ballplayer. He had nine styles of slides in his repertoire: the hook, the fade-away, the straight-ahead, the short or swoop slide (“which I invented because of my small ankles”), the head-first, the Chicago slide (referred to by him but never explained), the first-base slide, the home-plate slide, and the cuttle-fish slide—so named because he purposely sprayed dirt with his spikes the way squid-like creatures squirt ink. Coming in, he would watch the infielder’s eyes to determine which slide to employ.

There’s a lot more in the book, which I urge you to read — especially if you’re a baseball fan who appreciates snappy prose and documented statements (as opposed to the myths that have grown up around Cobb).

Cobb’s unparalleled greatness was still fresh in the minds of baseball people in 1936, when the first inductees to baseball’s Hall of Fame were elected. It was Cobb — not Babe Ruth — who received the most votes among the five players selected for membership in the Hall.

The Hall of Fame Reconsidered

Several years ago I wrote some posts (e.g., here and here) about the criteria for membership in baseball’s Hall of Fame, and named some players who should and shouldn’t be in the Hall. A few days ago I published an updated version of my picks. I’ve since deleted that post because, on reflection, I find my criteria too narrow. I offer instead:

  • broad standards of accomplishment that sweep up most members of the Hall who have been elected as players
  • ranked lists of players who qualify for consideration as Hall of Famers, based on those standards.

These are the broad standards of accomplishment for batters:

  • at least 8,000 plate appearances (PA) — a number large enough to indicate that a player was good enough to have attained a long career in the majors, and
  • a batting average of at least .250 — a low cutuff point that allows the consideration of mediocre hitters who might have other outstanding attributes (e.g., base-stealing, fielding).

I rank retired batters who meet those criteria by career wins above average (WAA) per career PA. WAA for a season is a measure of a player’s total offensive and defensive contribution, relative to other players in the same season. (WAA therefore normalizes cross-temporal differences in batting averages, the frequency of home runs, the emphasis on base-stealing, and the quality of fielders’ gloves, for example.) Because career WAA is partly a measure of longevity rather than skill, I divide by career PA to arrive at a normalized measure of average performance over the span of a player’s career.

These are the broad standards of accomplishment for pitchers:

  • at least 3,000 innings pitched, or
  • appearances least 1,000 games (to accommodate short-inning relievers with long careers).

I rank retired pitchers who meet these criteria by career ERA+,. This is an adjusted earned run average (ERA) that accounts for differences in ballparks and cross-temporal differences in pitching conditions (the resilience of the baseball, batters’ skill, field conditions, etc.). Some points to bear in mind:

  • My criteria are broad but nevertheless slanted toward players who enjoyed long careers. Some present Hall of Famers with short careers are excluded (e.g., Ralph Kiner, Sandy Koufax). However great their careers might have been, they didn’t prove themselves over the long haul, so I’m disinclined to include them in my Hall of Fame.
  • I drew on the Play Index at Baseball-Reference.com for the statistics on which the lists are based. The Play Index doesn’t cover years before 1900. That doesn’t bother me because the “modern game” really began in the early 1900s (see here, here, and here). The high batting averages and numbers of games won in the late 1800s can’t be compared with performances in the 20th and 21st centuries.
  • Similarly, players whose careers were spent mainly or entirely in the Negro Leagues are excluded because their accomplishments — however great — can’t be calibrated with the accomplishments of players in the major leagues.

In the following lists of rankings, each eligible player is assigned an ordinal rank, which is based on the adjacent index number. For batters, the index number represents career WAA/PA, where the highest value (Babe Ruth’s) is equal to 100. For pitchers, the index number represents career ERA+, where the highest value (Mariano Rivera’s) is equal to 100. The lists are coded as follows:

  • Blue — elected to the Hall of Fame. (N.B. Joe Torre is a member of the Hall of Fame, but he was elected as a manager, not as a player.)
  • Red — retired more than 5 seasons but not yet elected
  • Bold (with asterisk) — retired less than 5 seasons.

Now, at last, the lists (commentary follows):

Hall of fame candidates_batters

If Bill Mazeroski is in the Hall of Fame, why not everyone who outranks him ? (Barry Bonds, Sammy Sosa, and some others excepted, of course. Note that Mark McGwire didn’t make the list; he had 7,660 PA.) There are plenty of players with more impressive credentials than Mazeroski, whose main claim to fame is a World-Series-winning home run in 1960. Mazeroski is reputed to have been an excellent second-baseman, but WAA accounts for fielding prowess — and other things. Maz’s excellence as a fielder still leaves him at number 194 on my list of 234 eligible batters.

Here’s the list of eligible pitchers:

Hall of fame candidates_pitchers

If Rube Marquard — 111th-ranked of 122 eligible pitchers — is worthy of the Hall, why not all of those pitchers who outrank him? (Roger Clemens excepted, of course.) Where would I draw the line? My Hall of Fame would include the first 100 on the list of batters and the first 33 on the list of pitchers (abusers of PEDs excepted) — and never more than 100 batters and 33 pitchers. Open-ended membership means low standards. I’ll have none of it.

As of today, the top-100 batters would include everyone from Babe Ruth through Joe Sewell (number 103 on the list in the first table). I exclude Barry Bonds (number 3), Manny Ramirez (number 61), and Sammy Sosa (number 99). The top-33 pitchers would include everyone from Mariano Rivera through Eddie Plank (number 34 on the list in the second table). I exclude Roger Clemens (number 5).

My purge would eliminate 109 of the players who are now official members of the Hall of Fame, and many more players who are likely to be elected. The following tables list the current members whom I would purge (blue), and the current non-members (red and bold)  who would miss the cut:

Hall of fame batters not in top 100

Hall of fame pitchers not in top 33

Sic transit gloria mundi.

Signature