Lay My (Regulatory) Burden Down

UPDATE 02/05/17: The website of the Office of the Federal Register has eliminate or very cleverly hidden the source of statistics summarized in the graph below. Alternative sources, as of this date, are here and here.

The Office of the Federal Register, undoubtedly proud of its role in the imposition of rules on Americans, publishes a statistical summary of its handiwork, from which I derived the following graph:
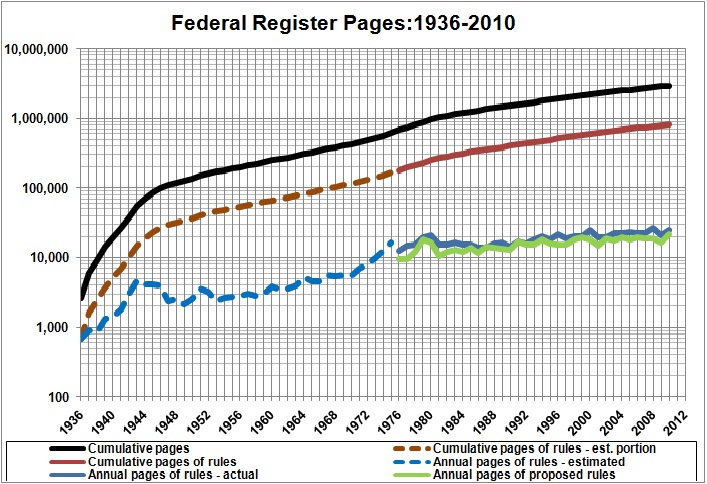

Source: Go to OFR page headed Tutorials, History, and Statistics and under Statistics click on XLS. Number of pages of rules for 1936-1975 estimated from the relationship between the number of pages of rules and the total number of pages in the Federal Register for 1976-2010.

Not all of the rules adopted since 1936 are still in effect, of course, but the graph gives a good indication of the growth and weight of the regulatory burden that hampers Americans and their enterprises. Do not take solace in the slower growth of rule-making pages since 1976; the page count continues to rise. Any number greater than zero represents the foreclosure of consumers’ and producers’ options — the further diminution of liberty, in other words.

How bad is it, economically? A report issued under the aegis of the U.S. Small Business Administration (yes, an arm of the central government) concludes that

the annual total cost of all federal regulations in 2008 was $1.752 trillion. Of this amount, the annual direct burden on business is $970 billion. Economic regulations represent the most costly category, with a total cost of $1.236 trillion, and with $618 billion falling initially on business. Environmental regulations represent the second most costly category in terms of total cost ($281 billion), and the cost apportioned to business is $183 billion. Compliance with the federal tax code is the third most costly category ($160 billion), and the cost of occupational safety and health, and homeland security regulations ranks last ($75 billion). (Nicole V. Crain and W. Mark Crain, Lafayette College, “The Impact of Regulatory Costs on Small Firms,” for SBA Office of Advocacy, September 2010, p. 48; cited and summarized on SBA’s website, here)

In other words governmental impositions in 2008 — a regulatory burden of $1.75 trillion and spending of $5.02 trillion — accounted for 47 percent of that year’s GDP ($14.29 trillion, in current dollars). As I have shown in other posts (e.g., here and here) the cumulative effect of governmental impositions is far greater than that.

Related reading: Henry I. Miller, “Red Tape and Pink Slips: Obama’s Imaginary Regulatory Reform,” The American, February 2, 2012

Related posts:
The Price of Government
The Price of Government Redux
The Mega-Depression
Ricardian Equivalence Reconsidered
The Real Burden of Government
Toward a Risk-Free Economy
The Rahn Curve at Work
The Illusion of Prosperity and Stability
The “Forthcoming Financial Collapse”
Estimating the Rahn Curve: Or, How Government Inhibits Economic Growth
The Deficit Commission’s Deficit of Understanding
Undermining the Free Society
The Bowles-Simpson Report
The Bowles-Simpson Band-Aid
Build It and They Will Pay
Government vs. Community
The Stagnation Thesis
America’s Financial Crisis Is Now
Money, Credit, and Economic Fluctuations
A Keynesian Fantasy Land
“Tax Expenditures” Are Not Expenditures
The Keynesian Fallacy and Regime Uncertainty
The Great Recession Is Not Over
Why the “Stimulus” Failed to Stimulate
Regime Uncertainty and the Great Recession
The Real Multiplier
Vulgar Keynesianism and Capitalism
Why Are Interest Rates So Low?
Economic Growth Since World War II
The Commandeered Economy
Estimating the Rahn Curve: A Sequel
The Real Multiplier (II)

The Recession Still Lingers

UPDATED 10/30/10

The latest release from the Bureau of Economic Analysis, which includes the “advance” estimate of real GDP for the third quarter of 2010, indicates that the recession isn’t over, by my definition of a recession:

  • two or more consecutive quarters in which real GDP (annualized) is below real GDP (annualized) for an earlier quarter, during which
  • the annual (year-over-year) change in real GDP is negative in at least one quarter.

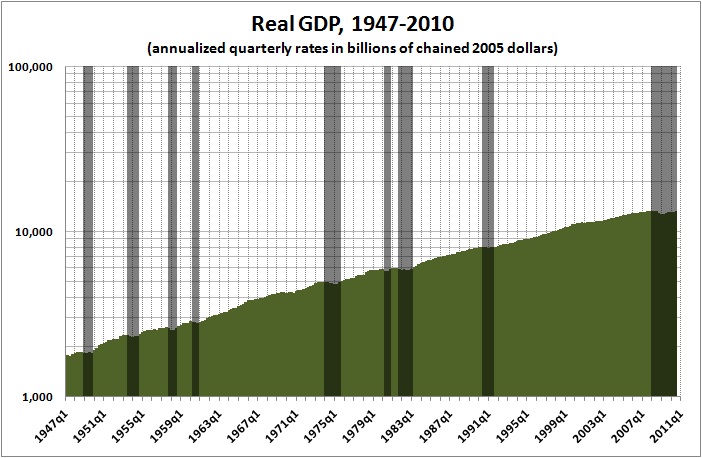
Real GDP for the third quarter was $13,260.7 billion (annualized rate, chained 2005 dollars). Although that’s better than the second quarter, it remains below the peak of $13,359.0, which was reached in the second quarter of 2008.

Here’s how real GDP has fared from the first quarter of 1947 through the third quarter of 2010 (recessions are denoted by vertical bars):

(In this version of the graph I have eliminated the 1947 recession, for lack of complete statistics, and pushed the beginning of the current recession to an earlier quarter.)

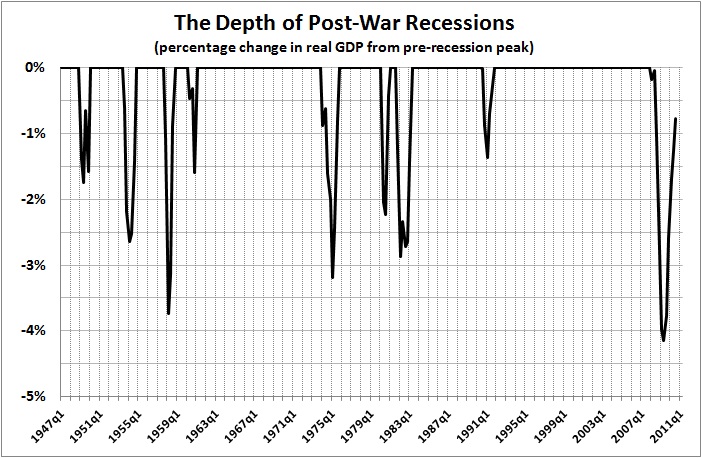
(I have added the following sentence and related graph.) Here’s a closer look at the depth and duration of post-war recessions:

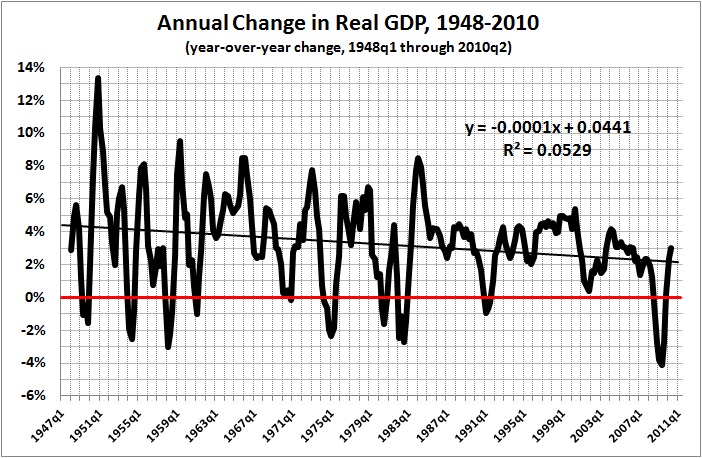
Finally, here are year-over-year changes in real GDP, from the first quarter of 1948 through the third quarter of 2010:

This graph, by the way, updates the one I used in “The Price of Government: More Evidence,” where I say:

You will notice two things about the graph. First, the economy is cyclical, thanks in part to the actions of government (e.g., the low-interest, housing-bubble recession). Second, economic growth has declined from an annual rate of around 4 percent to an annual rate of about 2 percent, because of government.

Related posts:
Economics – Growth & Decline
The Economic and Social Consequences of Government

The Price of Government: More Evidence

It is time to remind everyone of the economic toll that has been exacted by the growth of the regulatory-welfare state since the end of World War II:


Source: Bureau of Economic Analysis.

You will notice two things about the graph. First, the economy is cyclical, thanks in part to the actions of government (e.g., the low-interest, housing-bubble recession). Second, economic growth has declined from an annual rate of around 4 percent to an annual rate of about 2 percent, because of government.

Related posts:
Economics – Growth & Decline
The Economic and Social Consequences of Government

Does the CPI Understate Inflation?

REVISED AND RE-DATED

A website called Shadow Government Statistics offers an alternative estimate of inflation. According to SGS, “methodological shifts in government reporting have depressed reported inflation, moving the concept of the CPI away from being a measure of the cost of living needed to maintain a constant standard of living.” (Related post, here.) According to a chart at the linked page, year-over-year inflation is now about 9 percent, as opposed to the official government figure of about 2 percent.

The claim by SGS has merit, and not only because the definition of inflation has shifted. Specifically:

  • Government spending (at all levels) rose by 6 percentage points between 1980 and 2009. (See the graph at this post.)
  • Most government spending is inherently inflationary.

The inherently inflationary nature of government spending can be grasped by considering the case where government spending is financed by taxes:

  • Suppose that in the absence of government the GDP of the United States would be, as it is today, about $15 trillion. (Actually, as I show here, GDP would be a lot more than today’s $15 trillion were government to do nothing more than provide defense and justice.)
  • Suppose, further, that a bunch of governors arrives on the scene one fine day to announce: “You Americans need our services, so we’re going to tax you $5 trillion in order to provide things that we want you to have.” About 20 percent of the $5 trillion — the money spent on defense and justice — will be of value to almost everyone because (among other things) it protects economic activity. But most of the things our governors wants us to have — a hodge-podge of programs and regulations — will be valued mainly by those governors (i.e., politicians and bureaucrats) and narrow constituencies. The hodge-podge of programs and regulations, along with our governors’ habit of taxing success, raises the real price of government to far more than the $5 trillion shown in our national income accounts.
  • Our governors’ “generous” confiscation of $5 trillion has the same effect as if the producers of $5 trillion worth of real (non-government) goods and services walk off the job. More accurately, it’s as if they walk off the job and begin to vandalize their capital (homes, commercial buildings, computer networks, etc.). Specifically, according to the chairwoman of Obama’s Council of Economic Advisers, tax increases have a multiplier effect of about 3 (i.e., every dollar of a tax increase yields a 3-fold decrease in GDP). Another economist estimates that the supply of labor declines by 1.9 percent in response to a 1 percent cut in wages (a tax is equivalent to a cut in wages). Even transfer-payment schemes (e.g., Social Security) have a negative economic effect because they penalize producers for the benefit of non-producers.
  • Despite the reduction in real output that accompanies government,our governors pretend that they are producing $5 trillion worth of services, so (1) they levy taxes for those services, most of which taxes fall on the productive sector, and (2) they pay the producers of government services (government employees and contractors)  with those taxes.
  • In sum, government pays the producers of government services in “empty dollars,” which those producers then try to spend on real output. And so we have $15 trillion chasing $10 trillion worth of real goods and services.

That’s real inflation. No deficit spending necessary. And it happens every time our governors commandeer additional resources, thus widening the gap between what the productive sector could produce and what it actually produces.

What if government were to borrow the $5 trillion instead of imposing $5 trillion in taxes? Borrowing doesn’t change the outcome, just the way we get there. There is still $15 trillion chasing real output of $10 trillion.

Now, not all of that government spending is inherently inflationary. The protection of citizens and their property from foreign and domestic predators (defense and justice) is essential to economic growth and the orderly functioning of free markets. Government spending on defense and justice currently accounts for 8 percent of GDP, whereas government spending (at all levels) currently accounts for 36 percent of GDP. Let’s say, for the sake of argument, (1) that the “right” level of government spending is 10 percent of GDP (the level that obtained in the early 1900s), (2) that the 10 percent is funded by a system of taxes which isn’t punitive toward investors and entrepreneurs (e.g., a single, flat, tax rate), and (3) that the 10 percent is not accompanied by burdensome regulations. Even in the absence of punitive taxes and burdensome regulations, the increase in government spending from 10 to 36 percent of GDP caused prices to rise by 25 percent. Inflation of 25 percent, when spread over 80 years and more, may seem inconsequential. But it is real — real theft, that is.

Moreover, the growth of government spending has been accompanied by punitive taxes and burdensome regulations. As a result, real GDP is 68 percent below its potential. In other words, in the absence of the regulatory-welfare state, real GDP would be more than 3 times its present level.

Visible inflation is bad enough; invisible inflation is a real killer.