About Last Night …

… Trump didn’t prevail in the nationwide popular-vote tally by 6+ points as I expected. But a margin of about 4 points ain’t chopped liver. It wasn’t close, despite the prognostications of most pollsters and Nate Silver, the “master” poll masseuse.

Silver’s final forecast put Harris and Trump in a statistical dead heat, with win probabilities of 50.0 percent and 49.6 percent respectively. Silver’s assessment reflects the many polls upon which he draws, both nationwide and statewide. Needless to say, most of the polls got it wrong — many got it very badly wrong.

It’s ironic that Rasmussen Reports, much-derided by Silver, turned in the best performance by a pollster. Its final poll, which spanned October 19-October 29, had Trump up by 3 points, with a margin of error of 1 points. In fact, Rasmussen Reports has an excellent track record when it comes to assessing presidential races.

Trump vs. Harris: 5 (Final Forecast)

UPDATED 11/05/24 @ 12:00 PM (ET)

This post posits two scenarios: an easy win for Trump and a squeaker for Trump. In either case, court actions will probably delay final resolution of the outcome.

In the original version of this post, I failed to emphasize my belief that Trump will win an easy victory. That belief rests not only on the evidence provided here but also on the many signs of disaffection with Harris among traditional sources of support (e.g., minority voters and labor unions). There is also this omen from the midnight votes at Dixville Notch, New Hampshire: 4-2 against Trump in 2016, 5-0 against Trump in 2020, and a 3-3 tie this year. That shift is of a piece with widespread discontent with the course of the nation under the Biden-Harris regime.

Other than that, there’s a slight change in what I expect to be the irrelevant scenario: a squeaker won by Trump. The change is that it will be less of a squeaker than I had expected it to be.

A funny thing happened on the way to November 5, 2024: A bunch of pollsters decided that the race between Trump and Harris is a lot closer than the race between Trump and Biden.

In 2020, for example, the final polls issued by CNN, CNBC, Fox News, Harvard-Harris, Quinnipiac, New York Times/Siena, and USA Today/Suffolk had Biden ahead of Trump by an average of 9.6 points. Those polls overstated Biden’s popular-vote margin by an average of 5 percentage points. It was polling like that which produced an average error of 4.5 points in favor of Biden for polls conducted in the final two weeks of the 2020 campaign. (See this report by the American Association for Public Opinion Research.)

Now, the 2024 iterations of the polls mentioned above have Harris ahead of Trump by an average of 0 (that’s zero) points. And widely cited polling averages (e.g., Real Clear Polling and Silver Bulletin) depict the Trump-Harris race as a virtual dead heat.

Why the dead heat? Did a bunch of pollsters figure out how to reach “shy” Trump supporters, or how to adjust for the fact that Trump supporters are disproportionately unreachable? Or do most polls simply understate Trump’s support, as they did in 2016 and — more egregiously — in 2020?

I believe that the polls continue to understate Trump’s support — and by quite a bit. I base my belief on a relationship that I unveiled in “Trump vs. Harris: 4 (More Good News for Trump)“. It is the relationship between party leanings, as estimated by Gallup, and the allocation of the vote between Democrat and Republican candidates in the presidential elections of 2004 through 2020. (Gallup’s party-affiliation numbers can be found here. Gallup has produced other analyses that also portend a shift toward the GOP).

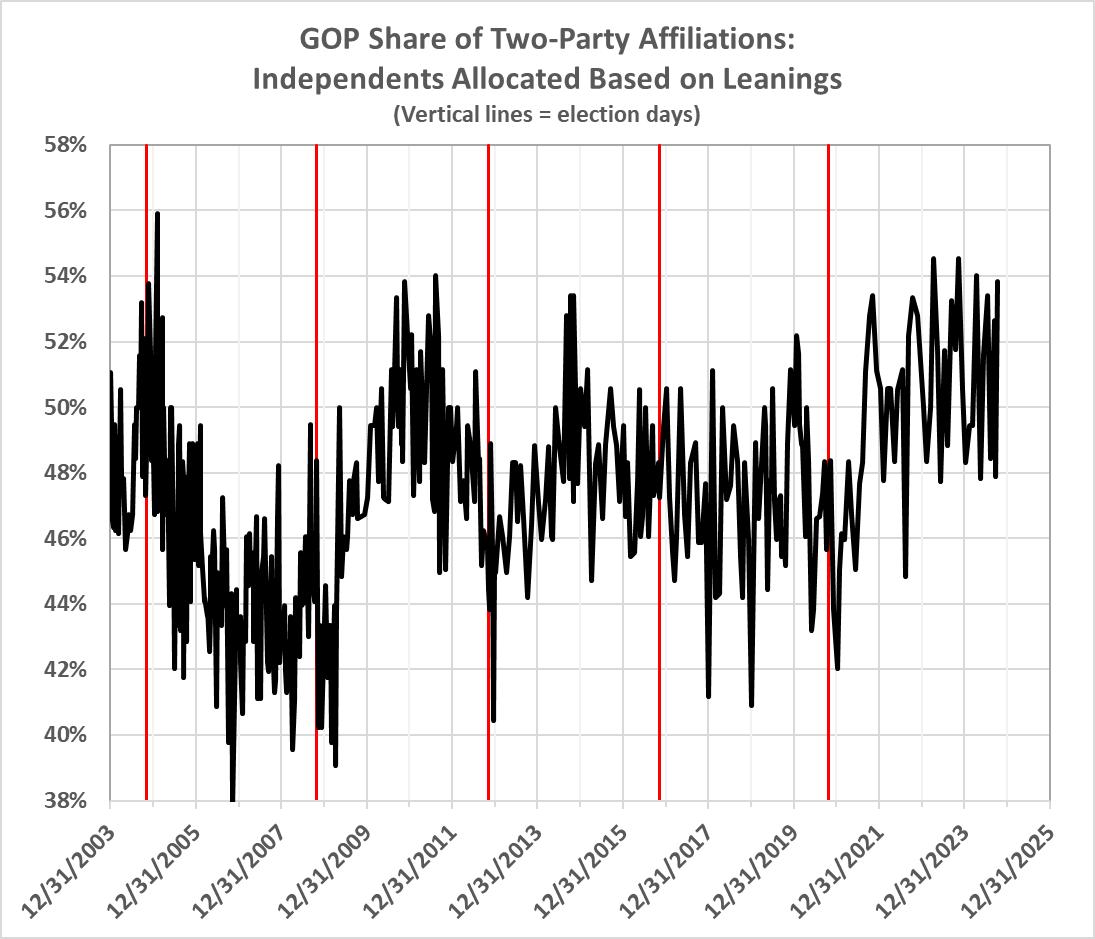
When Gallup allocates independents based on their leanings toward Democrats or Republicans, the two-party split looks like this:

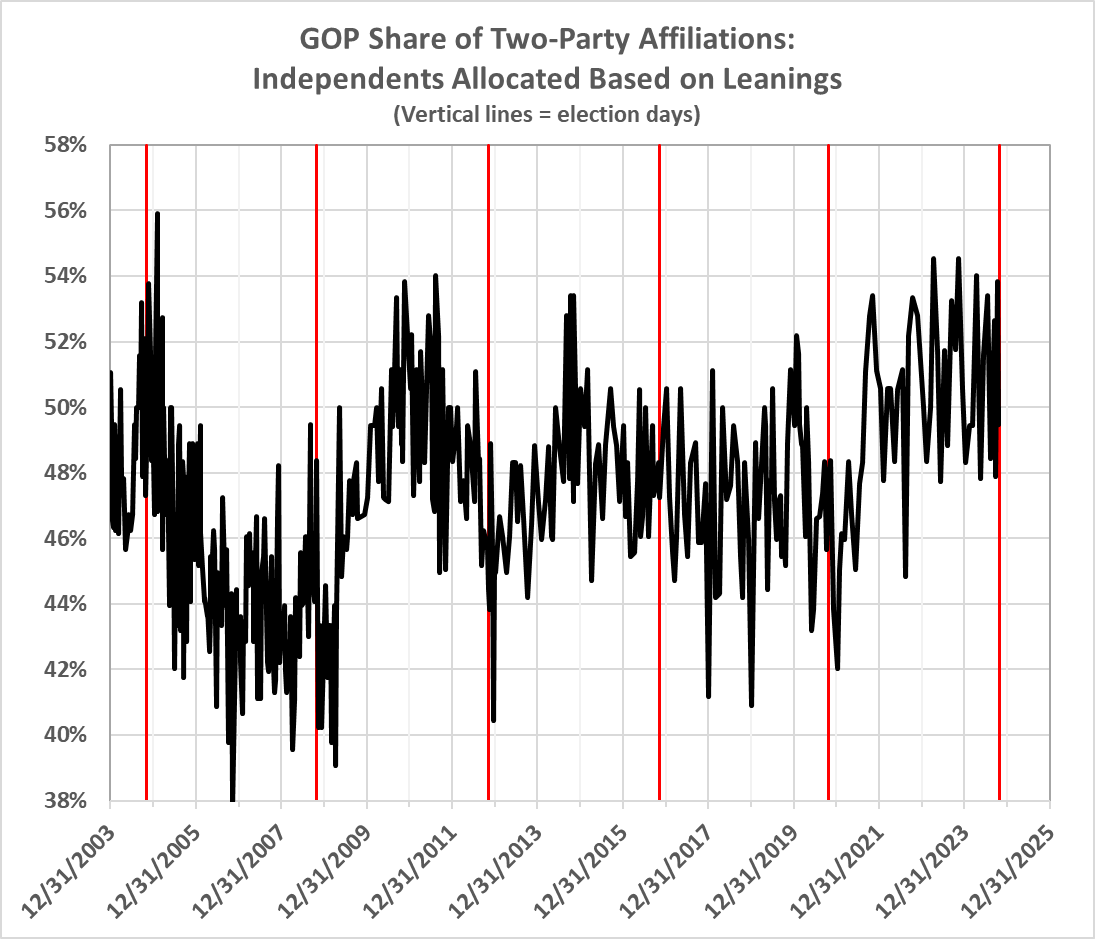
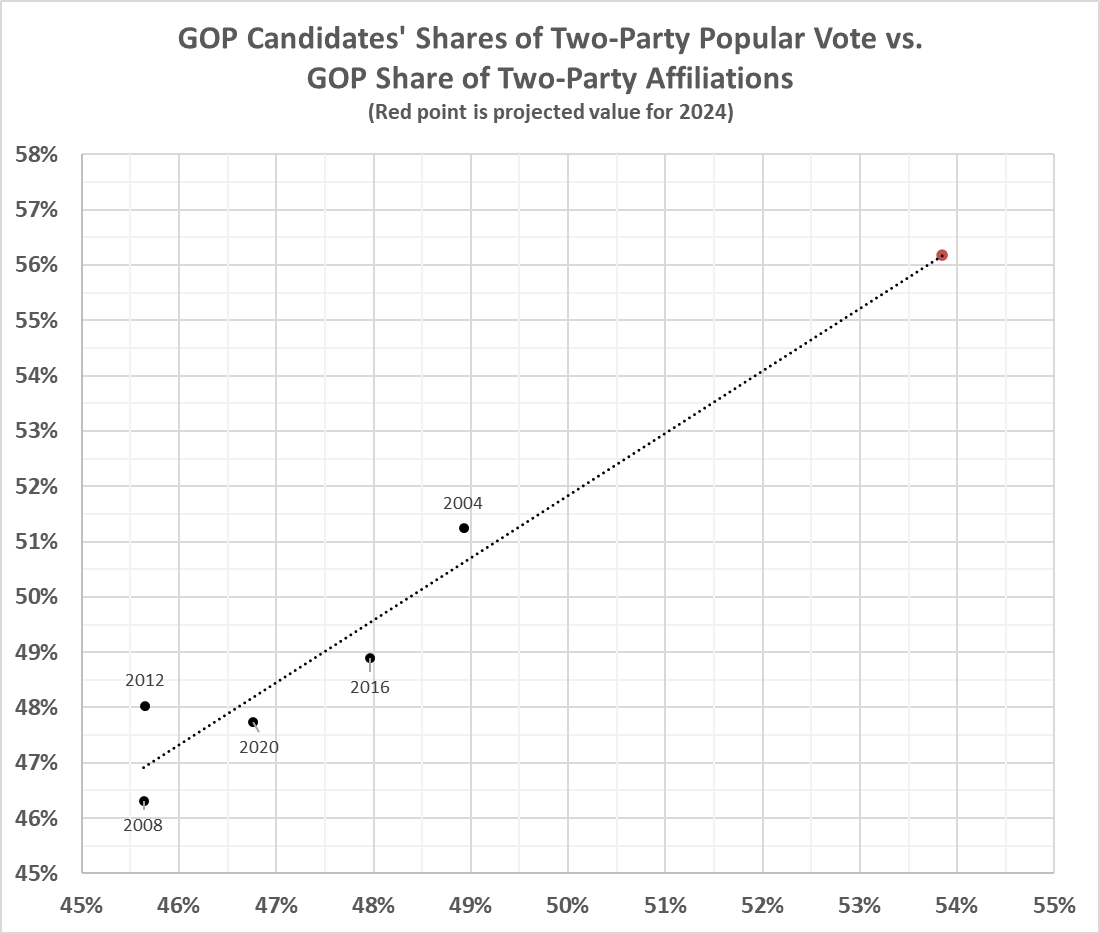
I plotted the average results for the month before the elections of 2004, 2008, 2012, 2016, and 2020 against the GOP candidates’ shares of the two-party vote in those elections. The result is spuriously precise, given the small number of observations. But it supports the view that the recent high level of GOP-leaning adults (52 percent in October 2024) portends a solid popular-vote majority for Trump:

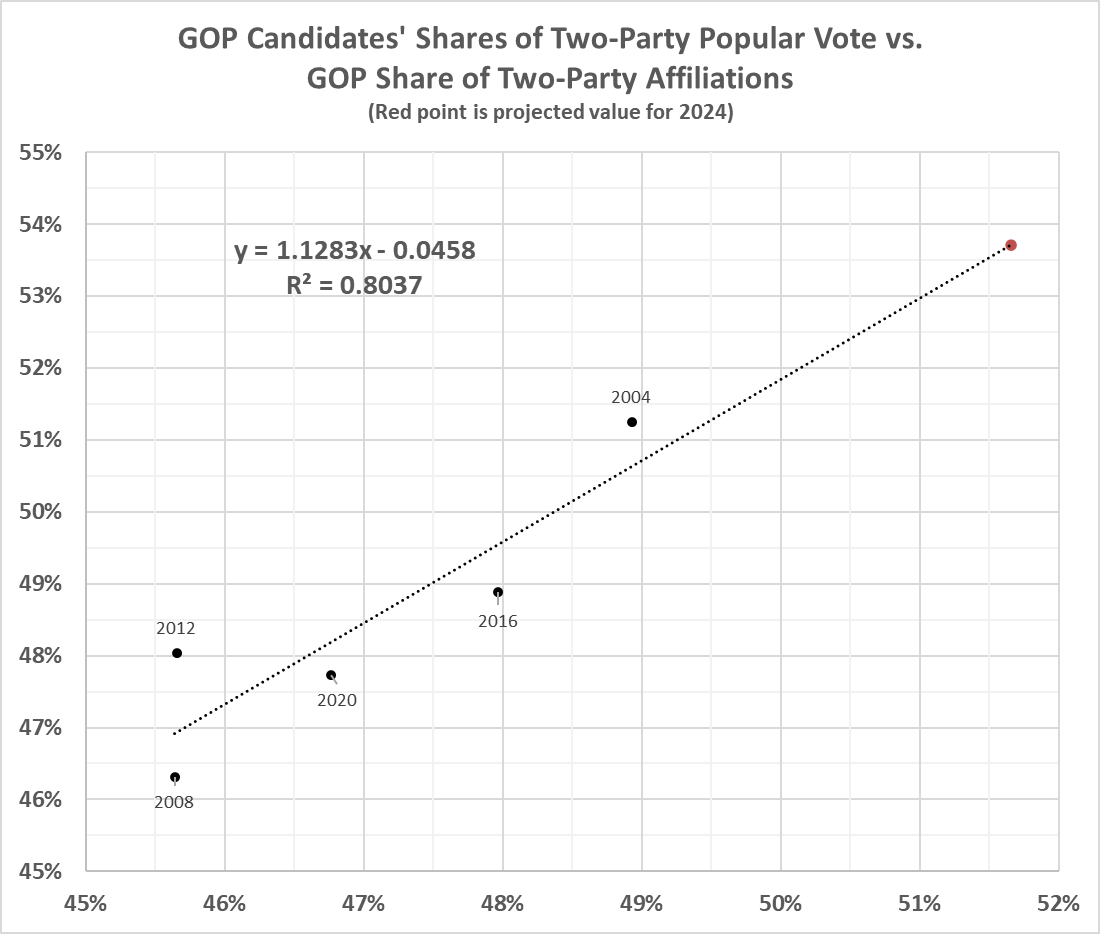
The projection for the 2024 election (red dot) is that Trump will receive more than 53 percent of the nationwide two-party popular vote. With that share, Trump would win a second term handily.

Why? Suppose that Harris were to win 70 million of 150 million votes (about 47 percent), leaving Trump with 80 million votes. That’s a winning margin of 10 million votes, which is amplified by the fact that an outsized fraction of the Democrat candidate’s vote comes from California and New York. In 2020, Biden won those two states by a total of 7 million votes. That’s 7 million more votes than he needed to secure the electoral votes of those two States. Any total higher than a bare majority in any State can be thought of as a wasted vote. Republicans hold a decided edge in that respect: In 2020, there were 15 million wasted Democrat votes to 8 million wasted Republican votes. I don’t expect that ratio to change markedly in 2024 (or thereafter).

What this means is that with 53 percent of the popular vote, Trump would have an effective margin of not 10 million votes but 20 million votes. There would be no razor-thin finishes to secure 270 electoral votes; the razor-thin finishes (e.g., in New Hampshire and Minnesota) would merely determine the size of Trump’s electoral-vote victory.

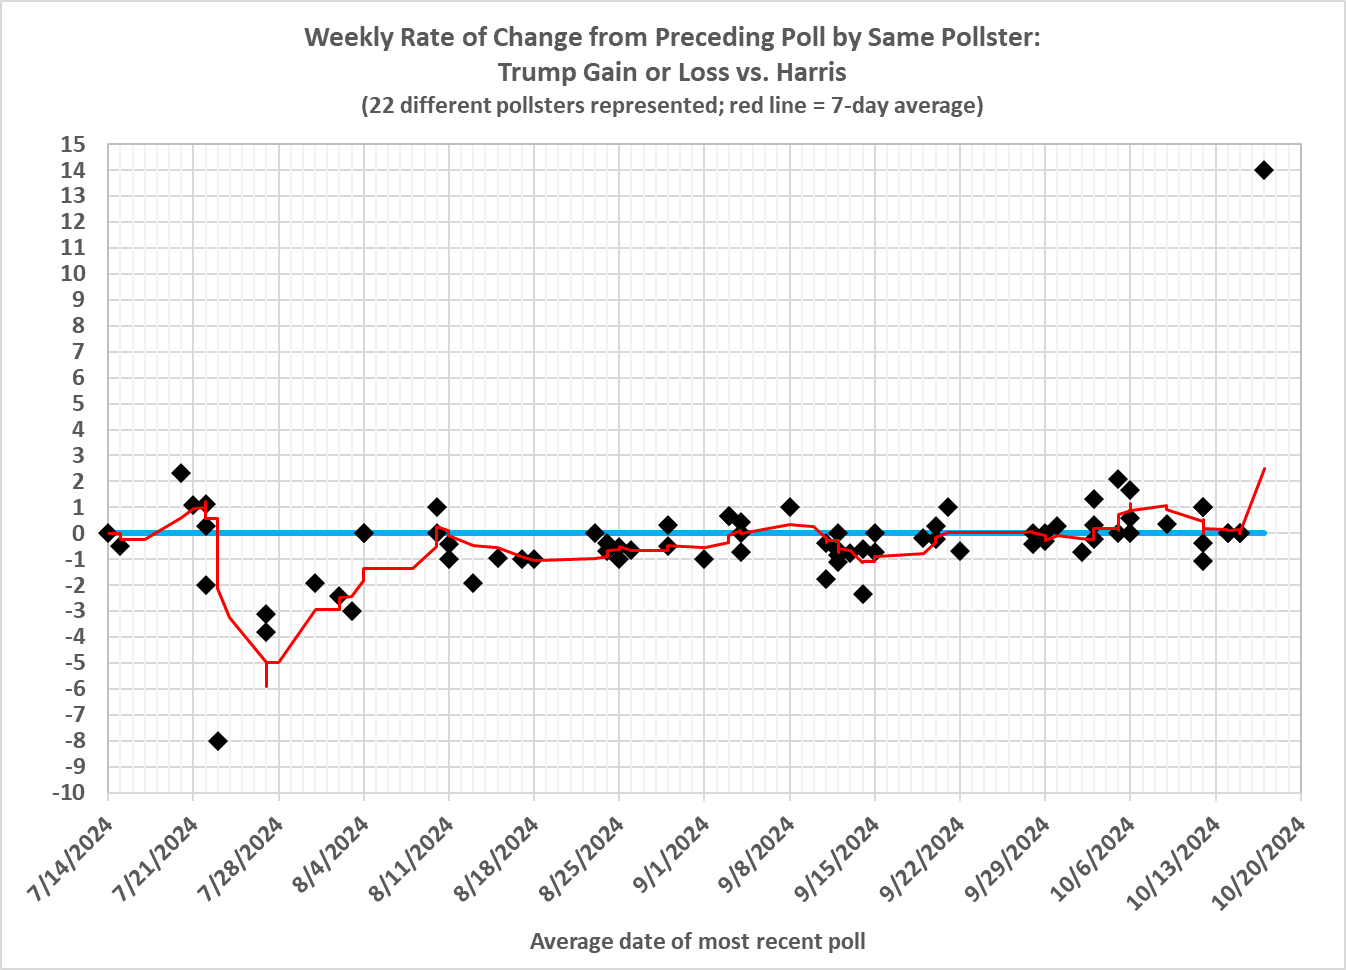
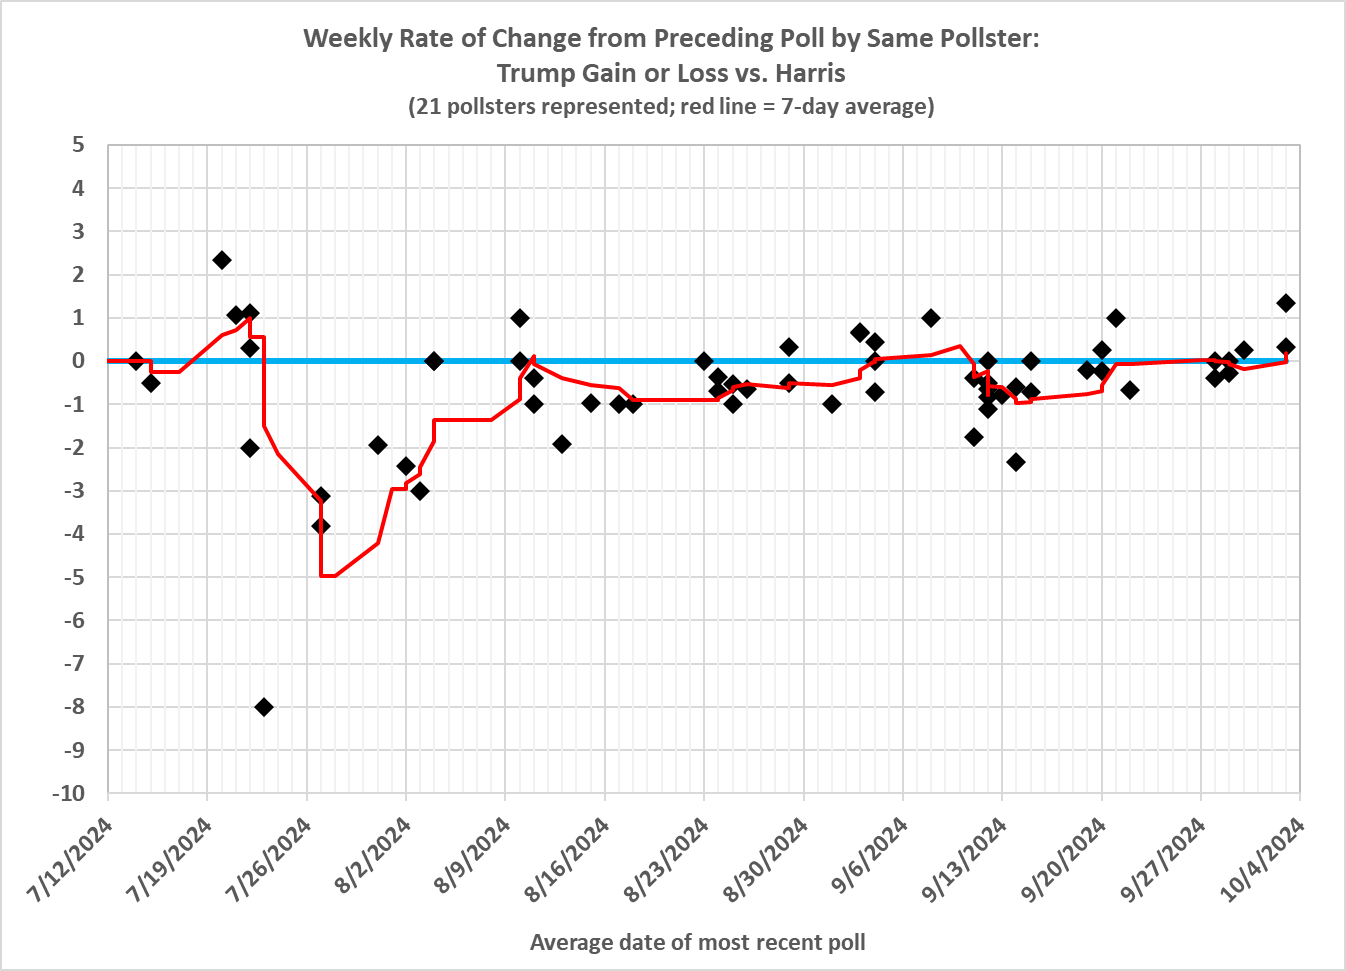
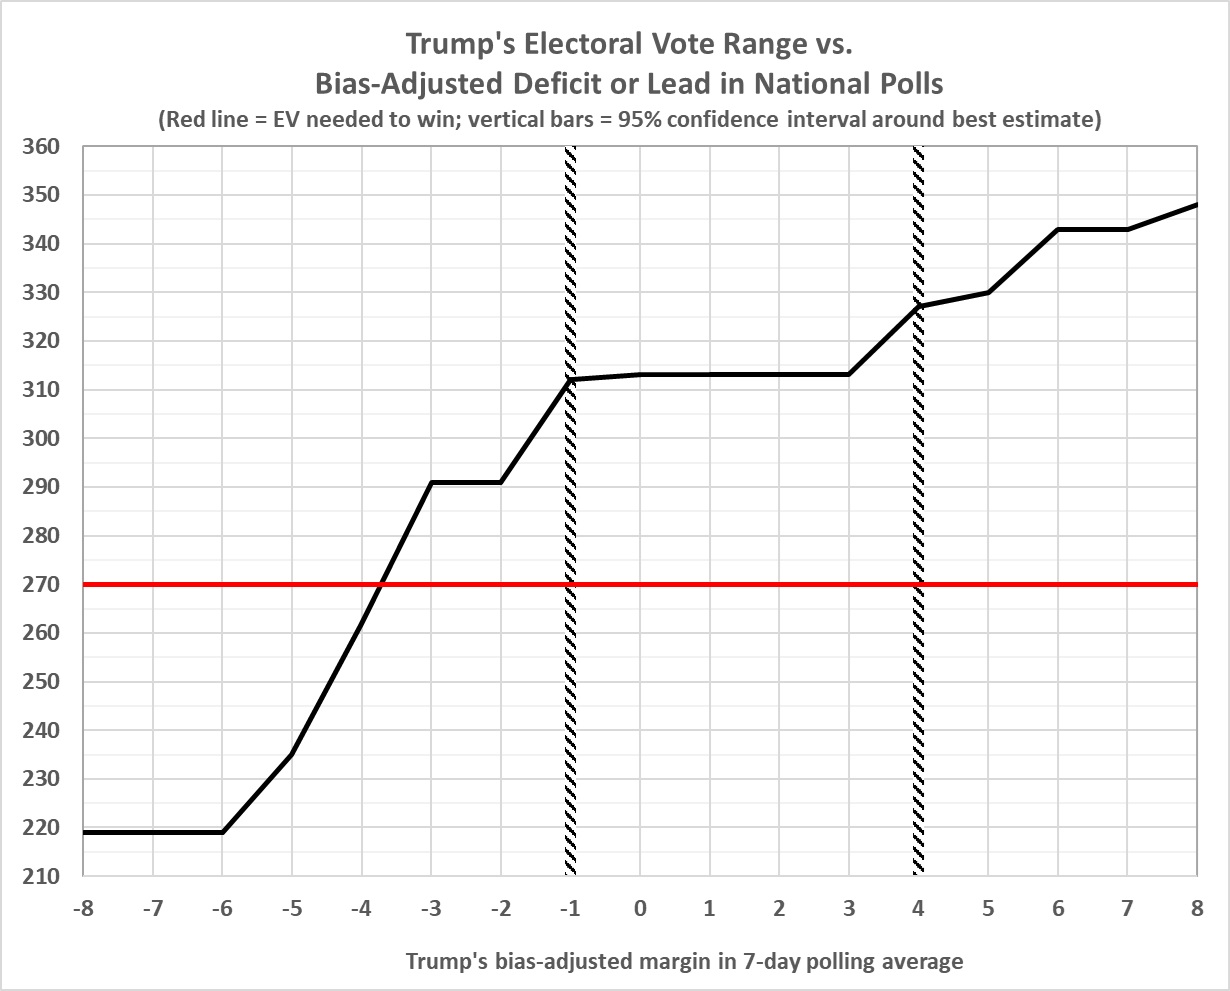
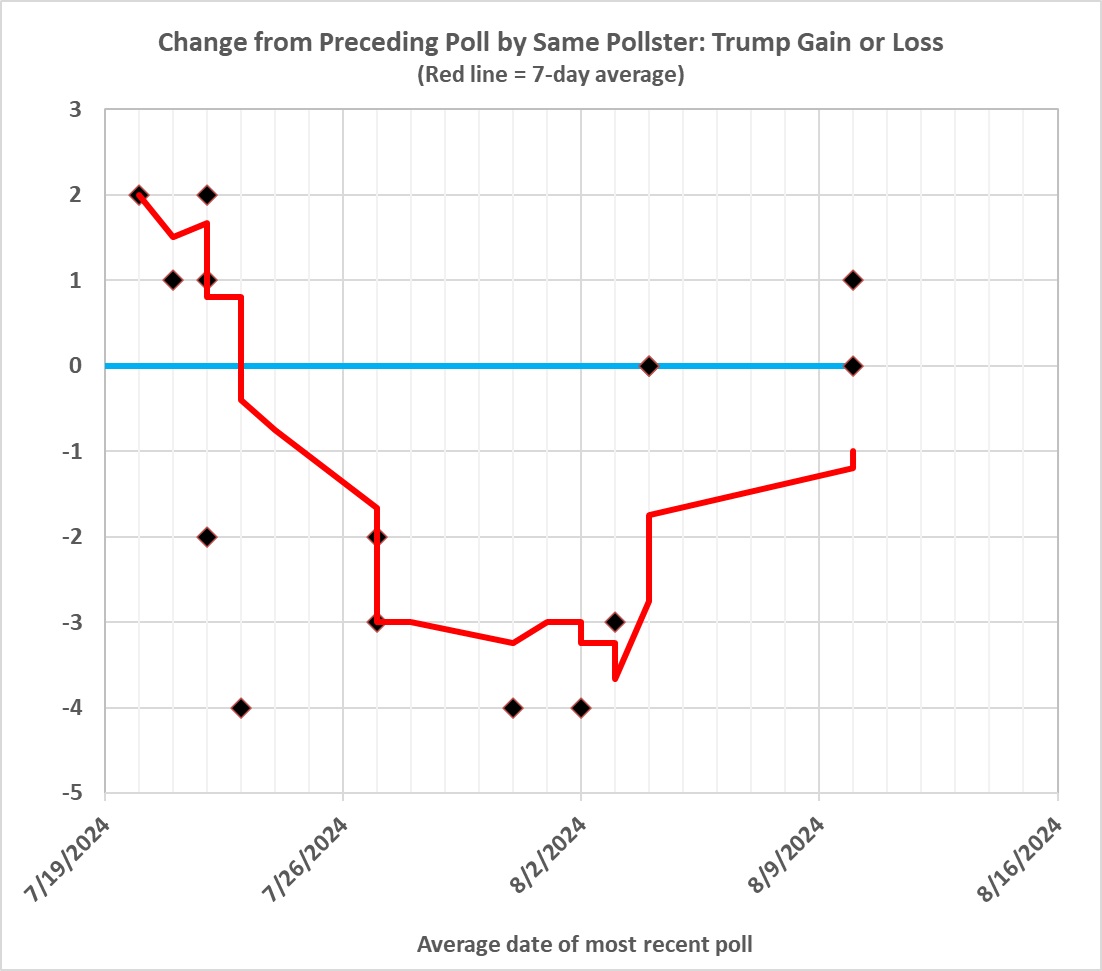
To underscore the likelihood of a comfortable margin favoring Trump, I offer the following graph (changed slightly from the original post):

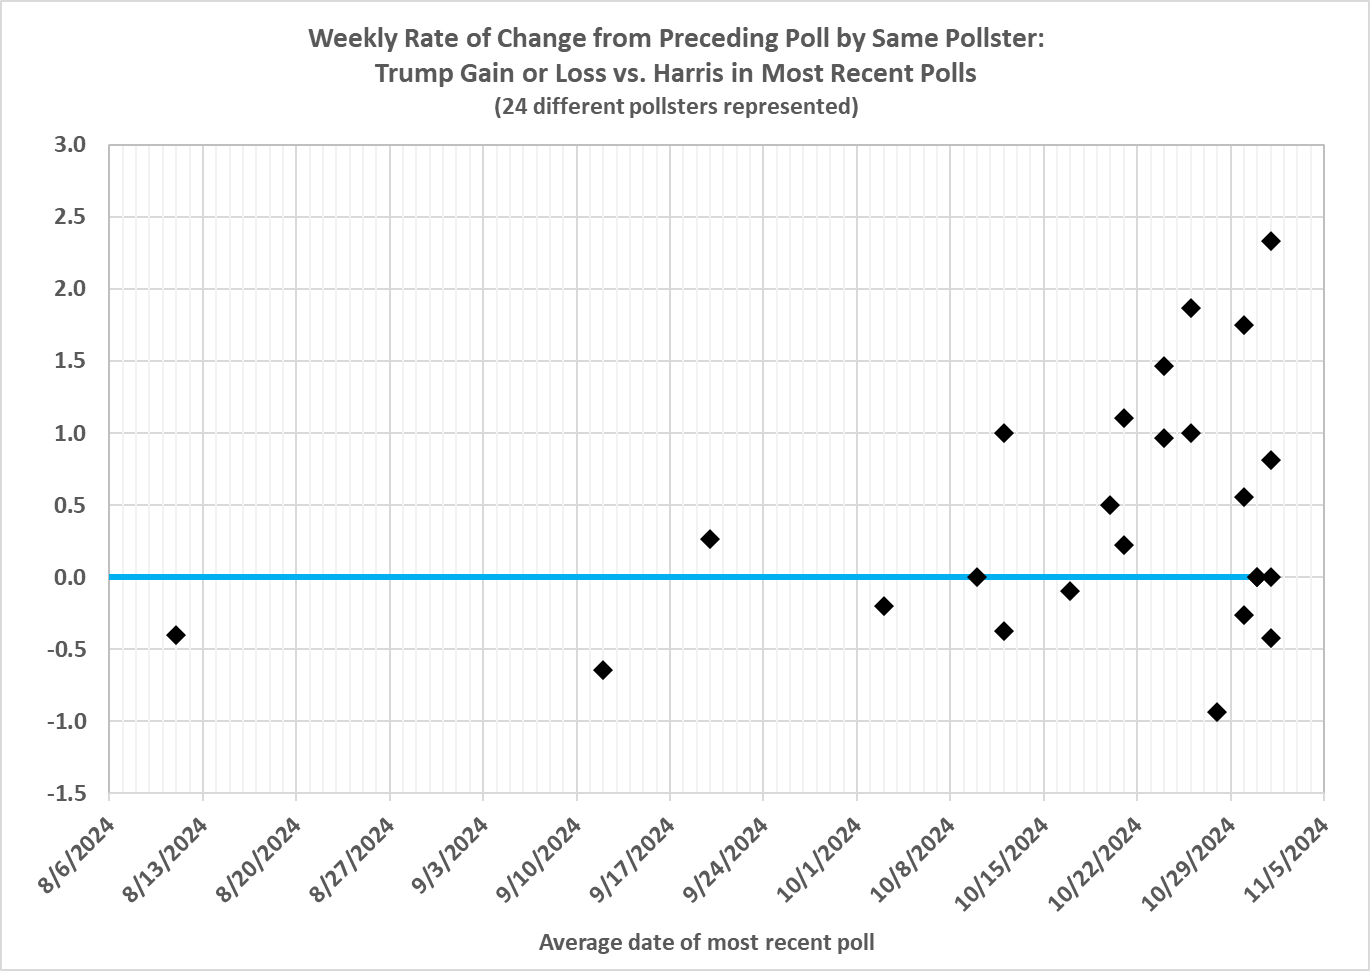
It reeks of pro-Trump momentum.

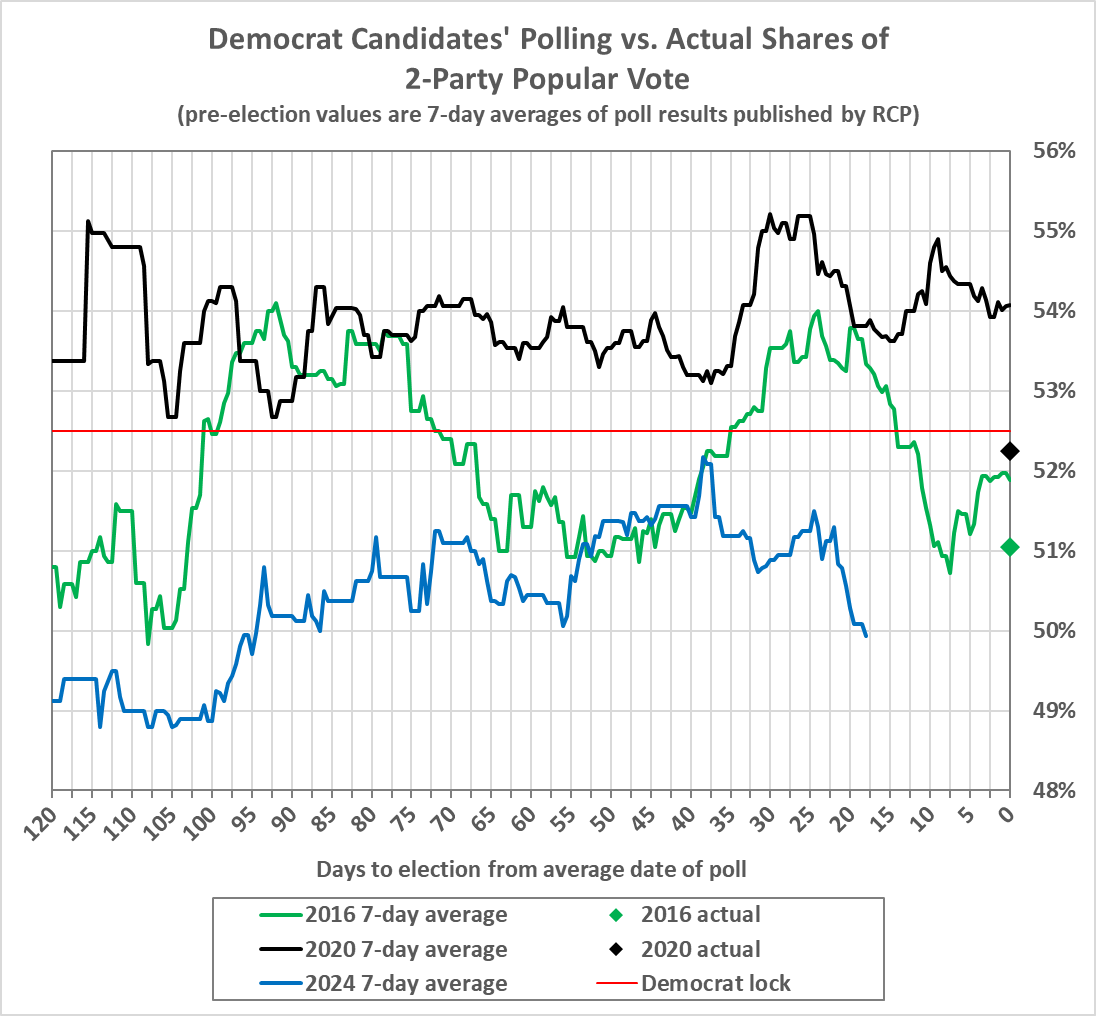
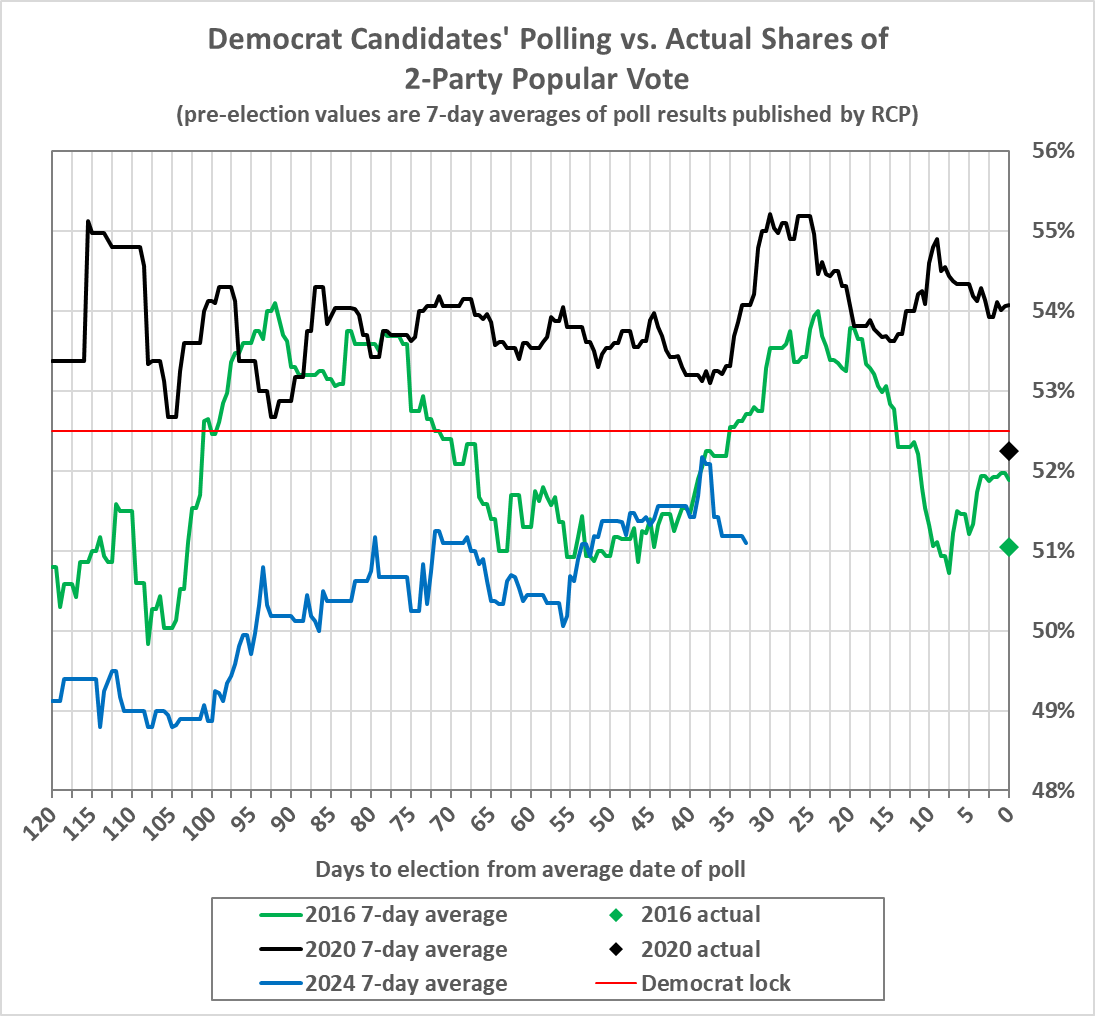
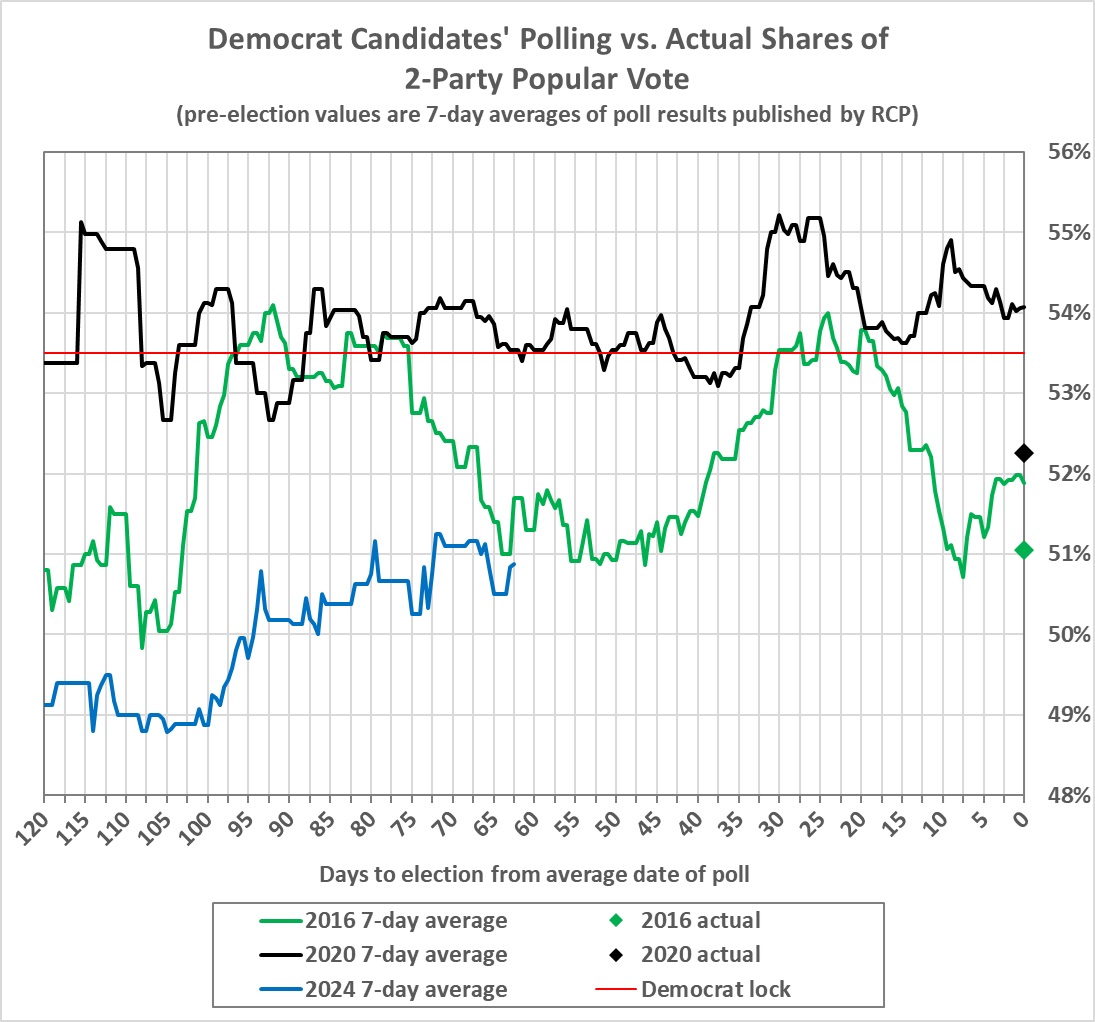
But let’s not get too excited about the prospect of an easy win.  Let’s go back to the polls and accept the premise that there is roughly an even split in the two-party nationwide popular vote. The following graph puts that split in perspective. Harris’s final position, based on the average of polls conducted within seven days of the election is a 50.4-percent share of the two-party vote (down 0.1 percent from the original post).

Can Harris, at 50.4 percent, do what Clinton failed to do with better polling numbers and what Biden barely did with much better polling numbers? Probably not.

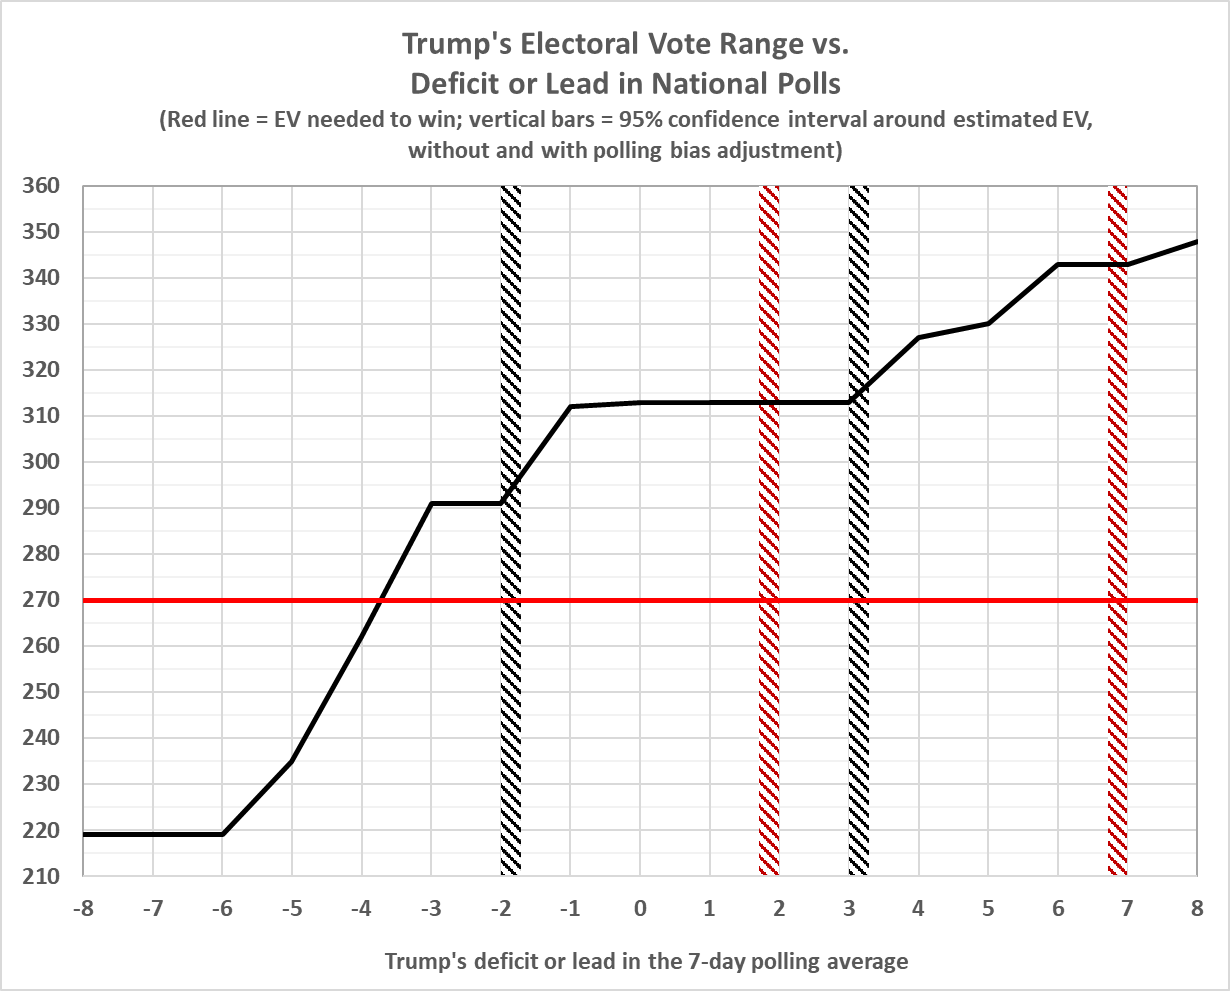
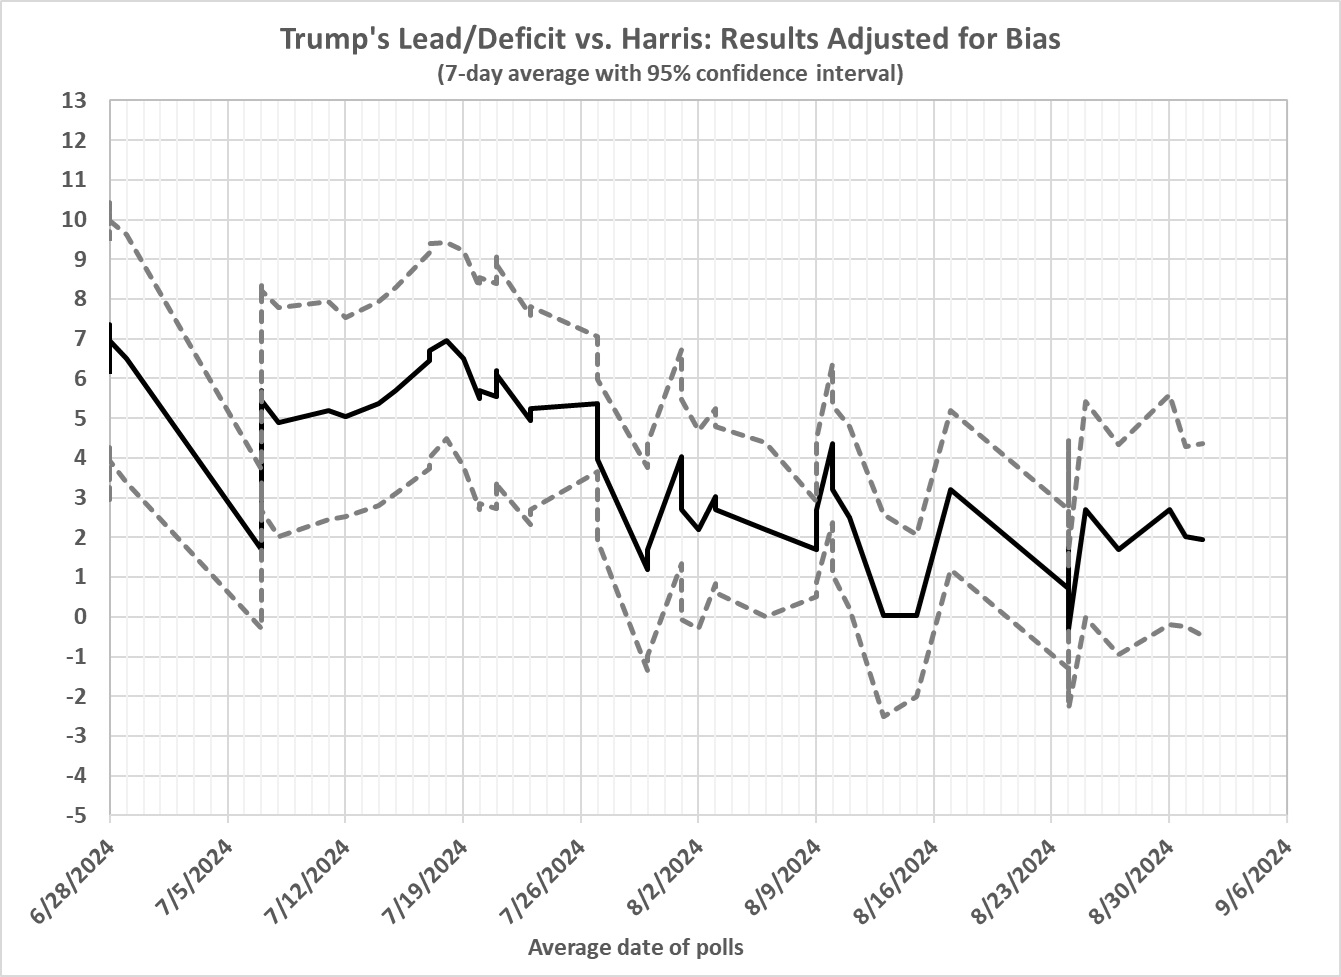
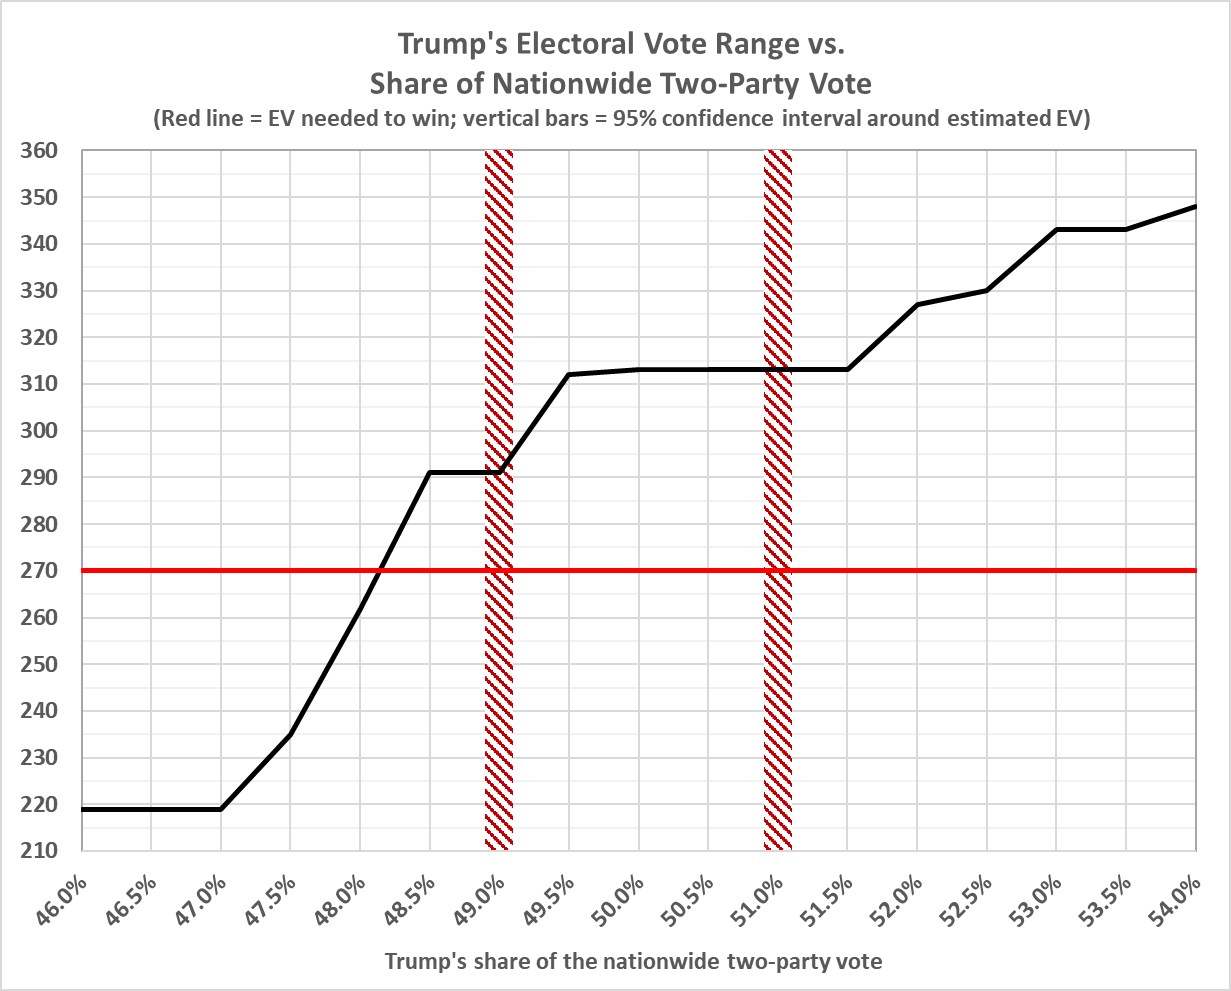
Let’s flip the problem and focus on Trump and stipulate that he will get 49.6 percent of the vote. That number comes with a range of statistical uncertainty (to say nothing of built-in bias). The range is from 48.3 percent to 50.8 percent. How does that range translate into electoral votes? Here’s how, Trump would win 291 to 313 electoral votes:

(See “Trump vs. Biden: 16” for an explanation of the relationship between popular vote/polling margin and electoral votes.)

To get to 291, Trump’s “Red Wall” must hold. (The “Red Wall” comprises the 219 electoral votes that Trump can count on unless there’s an unexpected — and well-concealed — Harris landslide in the offing.) Trump would get to 291 by augmenting the “Red Wall” with wins in Arizona, Georgia, North Carolina, Pennsylvania, and Wisconsin, while losing Michigan and Nevada. Trump could also hold on for a win, with 272 electoral votes, while losing Georgia as well as Michigan and Nevada. Other winning scenarios include losing Pennsylvania and Michigan while winning Arizona, Georgia, Nevada, North Carolina, and Wisconsin (278 electoral votes). There are other possibilities that I will leave as an exercise for the reader.

What’s my take? Looking at State-by-State polls, and (only for the purpose of this exercise) taking them at face value, I would write off Michigan and mark Georgia as uncertain. The loss of Georgia (in addition to Michigan) would cut Trump’s EV total to 281 — still enough for the win.

On the upside, Trump could get to 313 electoral votes by winning all seven of the swing States and Nebraska’s 2nd Congressional District.

Trump vs. Harris: 4 (More Good News for Trump)

I have been working on other posts, but an update on the state of the race for the presidency can’t wait.

Election day is only 16 days away. The polls have been moving in Trump’s direction lately. By my reckoning, Trump has moved into a clear lead in the electoral-vote count. He may stumble in the home stretch, but given the developments discussed below, it will take a huge October (or early November) surprise to trip him.
I begin with updates of material presented in earlier posts. I follow those updates with some new material.

First, drawing on the presidential polling summaries published at Real Clear Politics (RCP). I track each pollster’s poll-to-poll change in Trump’s lead or deficit. Assuming that each pollster’s bias for or against Trump (mostly against) remains about the same, the poll-to-poll changes indicate the direction of momentum. The “Harris Honeymoon” has come to a bitter end:

Second, I compare Harris’s performance in the polls with the performances of Clinton in 2016 and Biden in 2020.
Note the pro-Democrat (or anti-Trump biases in 2016 and 2020). The biases are reflected in the differences between the final 7-day polling averages (green and black lines) and the final shares of the nationwide two-party vote (green and black diamonds at 0 days). Clinton lost despite garnering 51.05 percent of the nationwide two-party vote. Biden won narrowly — because of razor-thin victories in several states — even though he got 52.25 percent of the two-party vote. Harris’s performance currently lags Clinton’s, which is a good sign for Trump.

The red line at 52.5 percent is my estimate of what it will take for Harris to register a clear victory over Trump. Harris is moving away from that number, not toward it.

Third, I adjust polling averages for anti-Trump bias. Of the polling organizations surveyed by RCP, 17 released polls in the final week before the 2020 election. Fourteen of the polls overestimated Biden’s popular-vote margin, with overestimates ranging from 0.5 to 7.5 percentage points. Only three pollsters underestimated Biden’s margin, with a range of 0.5 to 3.5 points. The overall average for the 17 pollsters was an overestimate (for Biden) of 3.7 points.

Because Trump is again the GOP nominee, I see no reason to assume that the pro-Democrat bias this year is any smaller than it was in 2020. So I simply add 3.7 points to Trump’s 7-day polling average to get a truer picture of Trump’s electoral appeal. I then compute a 95-percent confidence interval around the current 7-day average. As of today, the range spans a Trump lead of 1 percentage point to a Trump lead of 7 percentage points. I also compute a 95-percent confidence interval around the current 7-day average, unadjusted for bias. As of today, that spans a Trump deficit of 2 percentage points to a Trump lead of 5 percentage points.

How does that range translate into electoral votes? Here’s how, Trump would win 291 to 343 electoral votes if the election were held today:

(See “Trump vs. Biden: 16” for an explanation of the relationship between popular vote/polling margin and electoral votes.)
The fact that the low end of the range exceeds 270 electoral votes should give Trump supporters cause for optimism about the outcome of the election.
Turning to new material, I begin with a Gallup poll (conducted 415 times since January 2004) that probes adults’ party affiliations. When independents are allocated based on their leanings, the two-party split looks like this:
I plotted the average results for the month before each election (2004, 2008, 2012, 2016, and 2020) against the GOP candidates’ shares of the two-party vote in those elections. The result is spuriously precise, given the small number of observations, as is any projection based on it. But it supports the inference that the recent high level of GOP-leaning adults (54% thus far in October 2024) portends a popular-vote majority for Trump:
(Gallup’s party-affiliation numbers can be found here. Gallup has produced other analyses that also portend a shift toward the GOP).

Finally, I turn to Nate Silver’s Silver Bulletin. Much of his material is accessible only to subscribers, so I will omit the links in the following quotations. Today’s election forecast begins with this:

Last update: 1:45 p.m., Sunday, October 20. The data continues to be pretty negative for Kamala Harris. There are now three recent high-quality national polls that show Donald Trump leading — a difficult circumstance for Harris, given Democrats’ Electoral College disadvantage — and her edge in our national polling average is down to 1.7 points. National polls don’t influence the model that much, and the race remains basically a toss-up, but it’s not hard to think of reasons that Trump could win.

There’s a link in that passage which leads to 24 reasons why Trump could win:

This election remains extremely close, but Donald Trump has been gaining ground. One of my pet peeves is with the idea that this is Kamala Harris’s election to lose. I could articulate some critiques of her campaign, but if you study the factors that have historically determined elections, you’ll see that she’s battling difficult circumstances.

So, today’s newsletter simply aims to provide a laundry list of factors that favor Trump, with many links to evidence in previous Silver Bulletin posts and elsewhere. These are in no particular order.

  1. Harris is the favorite to win the popular vote, but The Electoral College bias favors Republicans by about 2 percentage points. In an era of intense partisanship and close elections, this is inherently difficult for Democrats to overcome.
  2. Inflation hit a peak of 9.1 percentage points in June 2022. It has abated now, but prices remain much higher than when Biden took office, and voters are historically highly sensitive to inflation. Democrats can also plausibly be blamed for it given intensive increases in government spending during COVID recovery efforts.
  3. Though the reasons for this are much debated, voter perceptions about the economy lag substantially behind objective data, and growth in take-home income has been sluggish for many years for the working class amid rising corporate profits.
  4. Incumbent parties worldwide are doing very poorly, and the historical incumbency advantage has diminished to the point where it may now be an incumbency handicap instead amid perpetually negative perceptions about the direction of the country.
  5. Populism is often a highly effective strategy, and many Trump voters are indeed “deplorable” in the Hillary Clinton sense of the term.
  6. Illegal/unauthorized immigration increased substantially during the first few years of the Biden/Harris administration amid a rising global backlash to immigration.
  7. Harris ran far to her left in 2019, adopting many unpopular positions, and doesn’t really have a viable strategy for explaining her changing stances.
  8. The cultural vibes are shifting to the right, and the left continues to pay a price for the excesses of 2020 on COVID, crime, “wokeness,” and other issues.
  9. Voters have nostalgia for the relatively strong economic performance in the first three years of Trump’s term and associate the problems of 2020 with Democrats, even though they weren’t in charge at the time.
  10. Democrats’ dominance among Black voters and other racial and ethnic minority groups is slipping. It may be unfortunate timing: the memory of the Civil Rights Era is fading. Educational polarization, which implies deteriorating Democratic performance among working-class voters of all races, may also be coming to dominate other factors. It’s possible this works out well for Democrats if Harris makes corresponding gains among white voters, who pack more leverage in the Electoral College, but there’s no guarantee.
  11. Many men, especially young men, feel lost amidst declining college enrollment, contributing to a rightward shift and a growing gender gap.
  12. Joe Biden sought to be president until he was 86. Voters had extremely reasonable objections to this, and it neuters what should have been one of Harris’s best issues about Trump’s age and cognitive fitness.
  13. Harris also got a late start to her race, inheriting most of the staff from the poorly-run Biden campaign. She’s proven to be a good candidate in many respects, but it’s always a big leap when the understudy is suddenly thrust into the spotlight.
  14. Harris is seeking to become the first woman president. In the only previous attempt, undecideds broke heavily against Hillary Clinton, and she underperformed her polls.
  15. Trust in media continues to fall to abysmal levels. One can debate how to attribute blame for this between longstanding conservative efforts to discredit the media, a secular decline in trust in institutions, and various overreaching and hypocrisy in the press. But it’s hard for even legitimate Trump critiques to penetrate the mass public. Trump’s conviction on a series of felony charges hardly made any difference, for instance.
  16. Trump has traits of a classic con man, but con artistry is often effective, and Trump is skilled at convincing voters that he’s on their side even if his election would not be in their best interest. Furthermore, Trump presents Democrats with a Three Stooges Syndrome problem: a range of plausible attacks so vast that they tend to cancel one another out.
  17. Democrats’ college-educated consultant class has poor instincts for how to appeal to the mass public, while Trump has done more to cultivate support among “weird” marginal voting groups.
  18. Democrats’ argument that Trump is a critical threat to democracy is valid and important, given January 6 and Trump’s broad disrespect for the rule of law. But it’s a tough sell: ultimately, January 6 was a near-miss — it could very, very easily have been much, much worse — and Democrats hold the White House, the Senate, and many key governorships now. It isn’t intuitive to voters that democracy is threatened and Democrats may have staked too many chips on this line of attack.
  19. Foreign policy might not matter much to voters, but the world has become more unstable under Biden’s tenure. There has been a decline in democracy worldwide and an increase in interstate conflict, crises in the Middle East and Ukraine, deteriorating US-China relations, increasing immigration flows because of global instability, and a pullout from Afghanistan that negatively impacted Biden’s popularity.
  20. The Israel-Hamas war split the Democratic base in a way no comparable issue has split the GOP base.
  21. There are more left-leaning third-party candidates than right-leaning ones, and the former leading third-party candidate (RFK Jr.) endorsed Trump and undermined Harris’s post-convention momentum.
  22. The richest man in the world, Elon Musk, has become a huge Trump stan and is doing everything in his power to tip the election to him. Twitter/X remains an influential platform among journalists but has shifted far to the right. Elon and Silicon Valley have also created a permission structure for other wealthy elites to advocate for Trump explicitly and provided a new base of money and cultural influence.
  23. Trump was very nearly killed in an assassination attempt, and then there was a second one against him. The first attempt was closely correlated with an increase in favorability ratings for Trump, and polling shows he’s considerably more popular and sympathetic than in 2016 or 2020.
  24. Harris has been running on vibes and has failed to articulate a clear vision for the country. It might have been a good strategy if the “fundamentals” favored her, but they don’t.

Trump vs. Harris: 3 (Some Favorable News for Trump)

I follow the presidential polling summaries published at Real Clear Politics (RCP). I analyze the polling results in various ways. Three of those ways are highlighted here.

First, I track each pollster’s poll-to-poll change in Trump’s lead or deficit. Assuming that each pollster’s bias for or against Trump (mostly against) remains about the same, the poll-to-poll changes indicate the direction of momentum. The “Harris Honeymoon” seems to have ended:

Second, I adjust polling averages for anti-Trump bias. Of the polling organizations surveyed by RCP, 17 released polls in the final week before the 2020 election. Fourteen of the polls overestimated Biden’s popular-vote margin, with overestimates ranging from 0.5 to 7.5 percentage points. Only three pollsters underestimated Biden’s margin, with a range of 0.5 to 3.5 points. The overall average for the 17 pollsters was an overestimate (for Biden) of 3.7 points.

Given that Trump is again the GOP nominee, I see no reason to assume that the pro-Democrat bias this year is any smaller than it was in 2020. So I simply add 3.7 points to Trump’s 7-day polling average to get a truer picture of Trump’s electoral appeal. I then compute a 95-percent confidence interval around the current 7-day average. As of now, the range is from a deficit of 1 percentage point to a lead of 6 percentage points.

How does that range translate into electoral votes? Here’s how, Trump would win 312 to 343 electoral votes if the election were held today:

(See “Trump vs. Biden: 16” for an explanation of the relationship between popular vote/polling margin and electoral votes.)

Third, I compare Harris’s performance in the polls (unadjusted) with the performances of Clinton in 2016 and Biden in 2020.

Note the pro-Democrat (or anti-Trump biases in 2016 and 2020). The biases are reflected in the differences between the final 7-day polling averages (green and black lines) and the final shares of the nationwide two-party vote (green and black diamonds at 0 days). Clinton lost despite garnering 51.05 percent of the nationwide two-party vote. Biden won narrowly — because of razor-thin victories in several states — even though he got 52.25 percent of the two-party vote. Harris’s performance currently lags Clinton’s, which is a good sign for Trump.

The red line at 52.5 percent is my estimate of what it will take for Harris to register a clear victory over Trump. Harris is still a long way from that number.

Trump vs. Harris: 2 (Kamala the Sphinx Gains a Bit of Ground)

Trump’s position vis-a-vis Harris is a bit weaker than it was on August 14, when I published “Trump vs. Harris: 1 (It’s Still Trump’s Election to Lose)“:

(For details of the computation, see “Trump vs. Harris: 1”.)

How does the current range — a deficit of 1 point to a lead of 4 points — translate into electoral votes? As on August 14, Trump would win 313 to 327 electoral votes if the election were held today:

(See “Trump vs. Biden: 16” for an explanation of the relationship between popular vote/polling margin and electoral votes.)

Not only that, but the polls have been swinging back toward Trump, though he isn’t gaining ground:

Translating poll results into shares of the two-party presidential vote yields an interesting comparison between Harris’s performance and those of Clinton and Biden before her:

First of all, note the pro-Democrat (or anti-Trump biases in 2016 and 2020). The biases are reflected in the differences between the final 7-day polling averages (green and black lines) and the final shares of the nationwide two-party vote (green and black diamonds at 0 days). Clinton lost cleanly with 51.05 percent of the two-party vote. Biden won narrowly, requiring close “wins” in several states, even though he got 52.25 percent of the two-party vote. Harris’s performance still lags Clinton’s.

What it the red line at 53.5 percent? That’s my estimate of what it will take for Harris to register a clear victory over Trump — no razor-thing “victory” in any State and no potentially game-changing outcomes that are close enough to warrant recounts or court challenges. Harris is still a long way from that number.

Trump vs. Harris: 1 (It’s Still Trump’s Election to Lose)

Here’s the polling trend since the “debate” on June 27 that ended Biden’s candidacy:

To adjust for bias, I use the 2020 election to estimate the extent to which (most) polling organizations underestimate Trump’s strength among voters. Underestimation is time-dishonored strategem, aimed at dispiriting the opposition and its supporters — the “opposition” being any politician, like Trump, who threatens the power of the deep state and its allies, enablers, and beneficiaries.

I follow the presidential polling summaries published by Real Clear Politics (RCP). Of the polling organizations surveyed by RCP, 17 released polls in the final week before the 2020 election. Fourteen of the polls overestimated Biden’s popular-vote margin, with overestimates ranging from 0.5 to 7.5 percentage points. Only three pollsters underestimated Biden’s margin, with a range of 0.5 to 3.5 points. The overall average for the 17 pollsters was an overestimate (for Biden) of 3.7 points.

Given that Trump is again the GOP nominee, I see no reason to assume that the pro-Democrat bias this year is any smaller than it was in 2020. So I simply add 3.7 points to Trump’s 7-day polling averages to get a truer picture of Trump’s electoral appeal. Thus the values plotted in the preceding graph. (I am being generous to anti-Trump pollsters; the average anti-Trump bias in 2020, according to the American Association for Public Opinion Research, was 4.5 points for all.)

How does the current range — a lead of 1 to 4 points — translate into electoral votes? Here’s how, Trump would win 313 to 327 electoral votes if the election were held today:

(See “Trump vs. Biden: 16” for an explanation of the relationship between popular vote/polling margin and electoral votes.)

Not only that, but the “Harris honeymoon” may be coming to an end. The polls are swinging (modestly) back toward Trump:

All in all, things still look good for Trump. But there are question marks. Will Harris’s momentum continue? Will a “black swan” event upend the election? What about the upcoming sentencing in Trump’s “hush money” case? Will any other anti-Trump trials be completed by election day?

Stay tuned.