A recent story in The Telegraph (UK) leads with this:
Almost two-thirds of the country’s million-pound earners disappeared from Britain after the introduction of the 50 [percent] top rate of tax, figures have disclosed.
Surprise, surprise!
It happens here, too. For example, the net flow of persons among States (i.e., pattern of inter-State migration) is strongly determined by the relative tax burdens of the States (including taxes imposed by local governments).
The table below gives a hint of the strong relationship between tax burdens and inter-State migration. “In/Out represents the number of residents who moved into a State from another State, divided by the number of residents who moved out of the State to another State. The tax burden represents total State and local taxes levied on residents of a State, divided by income earned by residents of the State. (Sources and methods are discussed in the footnote to this post.)
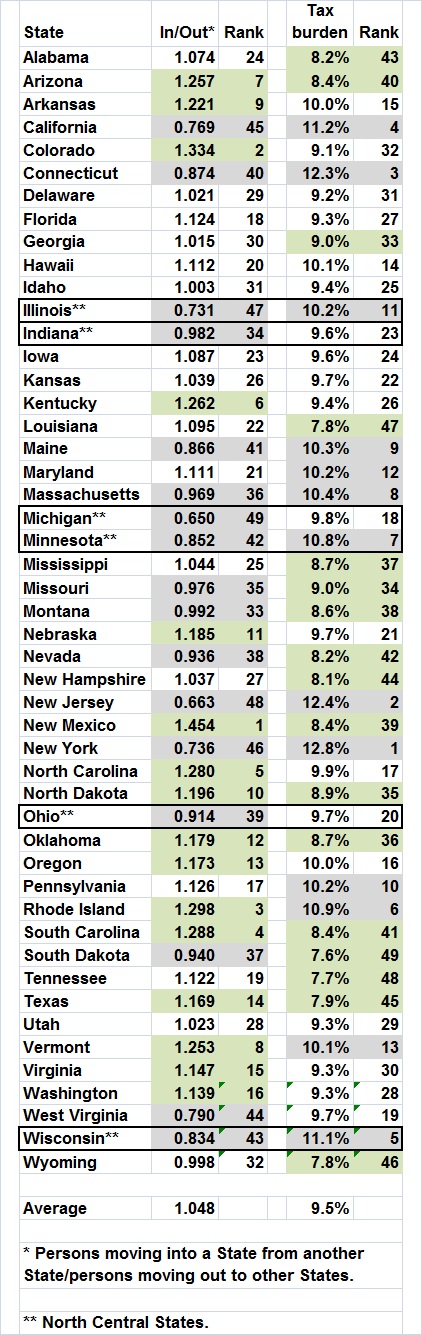
Green shading indicates States in the top (best) one-third of each distribution; gray shading indicates States in the bottom (worst) one-third. Alaska and the District of Columbia are omitted for reasons discussed in the footnote. As it turns out, statistical analysis yields two significant determinants of a State’s In/Out ratio:
- whether it is situated in the “Blue,” heavily unionized, North Central region of the United States, with its relatively high unemployment rate; and
- the State’s tax burden.
Take California (please). In 2010 alone, the Golden State’s heavy tax burden — 11.2 percent vs. the national average of 9.5 percent — cost it 54,000 residents. And California is not the most repulsive of States (“tax-wise”). That “honor” goes to New York, with a burden of 12.8 percent in 2010 — a burden that cost the Empire State 66,000 residents in that year. Then there is Wisconsin — with only 1/6 the population of California — which lost 33,000 current and prospective residents because it is in the North Central region and has a tax burden of 11.1 percent.
When low In/Out ratios persist for years — as they have in California, New York, and most of the North Central States — the result is a massive reduction in the number of taxpaying citizens and businesses. Persistently low In/Out ratios lead to fiscal death-spirals:
- Current and prospective residents and businesses are driven away by high taxes and other unfavorable conditions (e.g. unionization).
- Instead of paring government and taking other steps to make the State more attractive (e.g., playing tough with public-sector unions), taxes are raised on remaining residents and businesses.
- More residents and business are driven away.
- Some amount of paring may eventually occur, but taxes remain disproportionately high (and other unfavorable conditions usually persist), so more residents and businesses are driven away.
- And so on.
Detroit — which lost more than 60 percent of its population between 1950 and 2010 — is a prime example of a jurisdiction in a death-spiral, but it is far from the only one.
But voting with one’s feet, which works on the municipal and State levels, does not work on the national level. And the proponents of Big Government understand that. It is a sad fact that, for most citizens, the cost of fleeing the country for a better place (if one can be found) would far outweigh the additional burden of higher marginal tax rates, higher rates on capital gains, the perpetuation and expansion of “entitlements,” and the ever-growing volume of regulations (which are taxes in a different guise).
What the proponents of Big Government do not understand — or do not care about — is that they are killing the goose that lays the golden eggs. When people cannot reap the hard-won rewards of their labors and their investments, they labor and invest less. The result is slower and slower economic growth, and the imminent European “nirvana” so devoutly wished by proponents of Big Government.
Related posts:
The Laffer Curve, “Fiscal Responsibility,” and Economic Growth
The Causes of Economic Growth
In the Long Run We Are All Poorer
A Short Course in Economics
Addendum to a Short Course in Economics
The Price of Government
The Price of Government Redux
The Mega-Depression
As Goes Greece
Ricardian Equivalence Reconsidered
The Real Burden of Government
The Illusion of Prosperity and Stability
Estimating the Rahn Curve: Or, How Government Inhibits Economic Growth
Taxing the Rich
More about Taxing the Rich
America’s Financial Crisis Is Now
A Keynesian Fantasy Land
The Keynesian Fallacy and Regime Uncertainty
Why the “Stimulus” Failed to Stimulate
The “Jobs Speech” That Obama Should Have Given
Say’s Law, Government, and Unemployment
Unemployment and Economic Growth
Regime Uncertainty and the Great Recession
Regulation as Wishful Thinking
The Real Multiplier
Vulgar Keynesianism and Capitalism
Why Are Interest Rates So Low?
The Commandeered Economy
Stocks for the Long Run?
We Owe It to Ourselves
Stocks for the Long Run? (Part II)
Estimating the Rahn Curve: A Sequel
In Defense of the 1%
Bonds for the Long Run?
The Real Multiplier (II)
Lay My (Regulatory) Burden Down
The Burden of Government
Economic Growth Since World War II
More Evidence for the Rahn Curve
The Economy Slogs Along
The Obama Effect: Disguised Unemployment
The Stock Market as a Leading Indicator of GDP
Government in Macroeconomic Perspective
Where We Are, Economically
Keynesianism: Upside-Down Economics in the Collectivist Cause
The Economic Outlook in Brief
Is Taxation Slavery? (yes)
__________
EXPLANATORY NOTE AND REFERENCES:
I began with Census Bureau estimates of State-to-State migrations in 2010. I derived estimates of in- and out-migration for each State and the District of Columbia. The “turnover” rates for Alaska and the District of Columbia proved to be much higher than the rates for the other 49 States. Preliminary analyses of the relationship between In/Out ratio and key variables (e.g., tax burden) confirmed that the inclusion of Alaska and D.C. in the analysis would bias the results, so I dropped those two entities from the analysis.
For the other 49 States, I considered the relationship between In/Out ratio and several variables:
- tax burden (of course), which I obtained from Table 2 of “Annual State-Local Tax Burden Ranking (2010) – New York Citizens Pay the Most, Alaska the Least” at the website of the Tax Foundation;
- population (from the same source as migration statistics);
- unemployment rate (from State-by-State estimates for 2010, available in the 2012 Statistical Abstract);
- trend toward (or away from) Republican presidential candidates (derived from State-by-State voting patterns available at Dave Leip’s Atlas of U.S. Presidential Elections); and
- regional effects, represented by dummy variables for Northeast & Mid-Atlantic (CT, DE, ME, MA, NH, NJ, NY, PA, RI, VT); North Central (IL, IN, MI, MN, OH, WI); South & Southeast (AL, AR, FL, GA, KY, LA, MD, MS, MO, NC, OK, SC, TN, TX, VA, WV); Plains & Mountain States (AZ, CO, IA, ID, KS, MT, NE, NV, NM, ND, SD, UT, WY); and West (CA, HI, OR, WA). (The statistical results are unaffected by reasonable variations in assignments — MD and VA to Northeast & Mid-Atlantic, TX to Plains & Mountain States, for example.)
Regressions on various combinations of explanatory variables yielded one statistically significant equation:
In/Out = 1.60 – 0.21NC – 5.58TB
where NC is 1 if a State is in the North Central region (otherwise it is 0), and TB is the State’s tax burden (expressed as a decimal fraction). Each State’s tax burden includes local taxes and taxes imposed on the State’s residents by other States. (A person who lives in New Jersey and works in New York knows that one price of living in New Jersey is the payment of New York’s income taxes.)
The equation and its constant and coefficients are significant at the 1-percent level, and better. The standard error of the estimate is 0.15, against a mean for In/Out of 1.048. The residuals are randomly distributed with respect to the estimated values.)
According to the equation, a North Central State with a tax burden of 10.2 percent (the average for North Central States) would have an In/Out ratio of 0.82; the average for North Central States is 0.83. A State in another region with a tax burden of 9.4 percent (the average for all other States) would have an In/Out ratio of 1.08; the average for States not in the North Central region is 1.08.
Here is a plot of estimated vs. actual In/Out ratios:
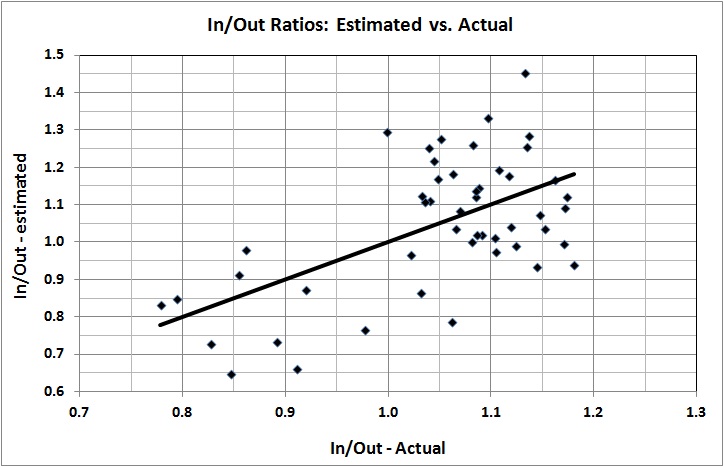
The outliers — States with residuals greater than 1 standard error — are indicated by the green shading (good) and gray shading (bad):

The top 6 States have something extra going for them; the bottom 9 States have something extra going against them. The extras could be an especially hospitable or inhospitable business climate, climatic and/or geographical allure (or lack thereof), cost of living, unemployment well above or below the national average, the political climate (“Blue” to “Red” shifts prevail), or something else. Whatever the case, I am easily persuaded that New York (where I have lived and run a business), Michigan (my home State), California (a well-known basket case), Nevada (ditto), New Jersey (ditto), and West Virginia (with which I am all too familiar) have a lot going against them, even when it is not an excessive tax burden.
