I came across some breathless prose about the rising trend in the velocity of pitches. (I’m speaking of baseball, in case you didn’t know. Now’s your chance to stop reading.) The trend, such as it is, dates to 2007, when the characteristics of large samples of pitches began to be recorded. (The statistics are available here.) What does the trend look like? The number of pitchers in the samples varies from 77 to 94 per season. I computed three trends for the velocity of fastballs: one for the top 50 pitchers in each season, one for the top 75 pitchers in each season, and one for each season’s full sample:

Assuming that the trend is real, what difference does it make to the outcome of play? To answer that question I looked at the determinants of runs allowed per 9 innings of play from 1901 through 2015, drawing on statistics available at Baseball-Reference.com. I winnowed the statistics to obtain three equations with explanatory variables that pass the sniff test:*
- Equation 5 covers the post-World War II era (1946-2015). I used it for backcast estimates of runs allowed in each season from 1901 through 1945.
- Equation 7 covers the entire span from 1901 through 2015.
- Equation 8 covers the pre-war era (1901-1940). I used it to forecast estimates of runs allowed in each season from 1941 through 2015.
This graph shows the accuracy of each equation:
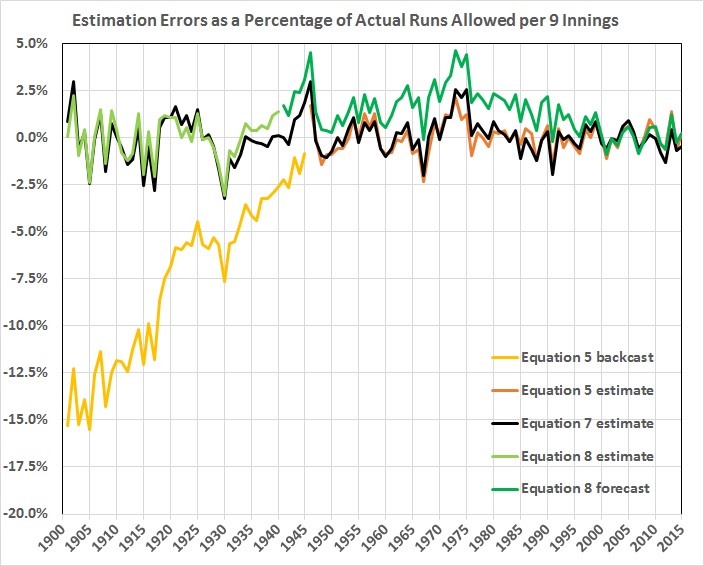
Equation 7, even though it spans vastly different baseball eras, is as good as or better than equations 5 and 8, even though they’re tailored to their eras. Here’s equation 7:
RA9 = -5.01 + H9(0.67) + HR9(0.73) + BB9(0.32) + E9(0.60) + WP9(0.69) + HBP9(0.51) + PAge(0.03)
Where 9 stands for “per 9 innings” and
RA = runs allowed
H = hits allowed
HR = home runs allowed
BB = bases on balls allowed
E = errors committed
WP = wild pitches
HBP = batters hit by pitches
PAge = average age of pitchers
The adjusted r-squared of the equation is 0.988; the f-value is 7.95E-102 (a microscopically small probability that the equation arises from chance). See the first footnote regarding the p-values of the explanatory variables.
What does this have to do with velocity? Let’s say that velocity increased by 1 mile an hour between 2007 and 2015 (see chart above). The correlations for 2007-2015 between velocity and the six pitcher-related variables (H, HR, BB, WP, HBP, and PAge), though based on small samples, are all moderately strong to very strong (r-squared values 0.32 to 0.83). The combined effects of an increase in velocity of 1 mile an hour on those six variables yield an estimated decrease in RA9 of 0.74. The actual decrease from 2007 to 2015, 0.56, is close enough that I’m inclined to give a lot of credit to the rise in velocity.**
What about the long haul? Pitchers have been getting bigger and stronger — and probably faster — for decades. The problem is that a lot of other things have been changing for decades: the baseball, gloves, ballparks, the introduction of night games, improvements in lighting, an influx of black and Latin players, variations in the size of the talent pool relative to the number of major-league teams, the greater use of relief pitchers generally and closers in particular, the size and strength of batters, the use of performance-enhancing drugs, and so on. Though I would credit the drop in RA9 to a rise in velocity over a brief span of years — during which the use of PEDs probably declined dramatically — I won’t venture a conclusion about the long haul.
_________
* I looked for equations where explanatory variables have intuitively correct signs (e.g., runs allowed should be positively related to walks) and low p-values (i.e., low probability of inclusion by chance). The p-values for the variables in equation 5 are all below 0.01; for equation 7 the p-values all are below 0.001. In the case of equation 8, I accepted two variables with p-values greater than 0.01 but less than 0.10.
** It’s also suggestive that the relationship between velocity and the equation 7 residuals for 2007-2015 is weak and statistically insignificant. This could mean that the effects of velocity are adequately reflected in the coefficients on the pitcher-related variables.
