UPDATED 11/20/16 (to incorporate latest results of Election 2016)
My algorithms, adjusted for the results of 2016’s general elections, are given in the following graphs. The gray lines mark the upper and lower bounds of the 95-percent confidence intervals around each of the regression lines.

Before this year’s election, there was a slight Republican advantage; that is, a GOP candidate could expect to win slightly more than 50 percent of the electoral vote with slightly less than 50 percent of the popular vote. That edge was due mainly to George W. Bush’s narrow win in 2000 (a bare majority of electoral votes based on 49.7 percent of the two-party popular vote). Trump’s victory — 57 percent of electoral votes with 48.9 percent of the two-party popular popular vote — pushed the regression line upward and to the left.
Next, the House of Representatives:
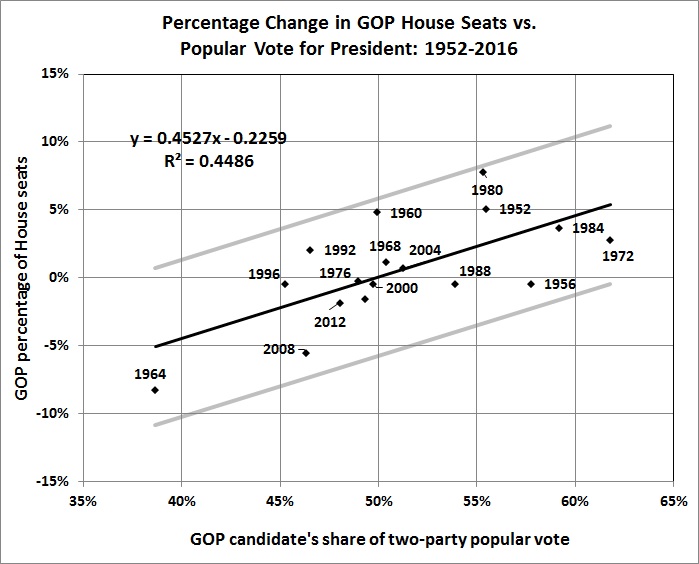
In the graph above, the unlabeled point just below the point for 2000 is the result for 2016. (Excel refused to add the label — perhaps reflecting the politics of Microsoft.) The fairly wide range of uncertainty around the regression line (plus or minus 7 percent) supports the old saw that all politics are local.
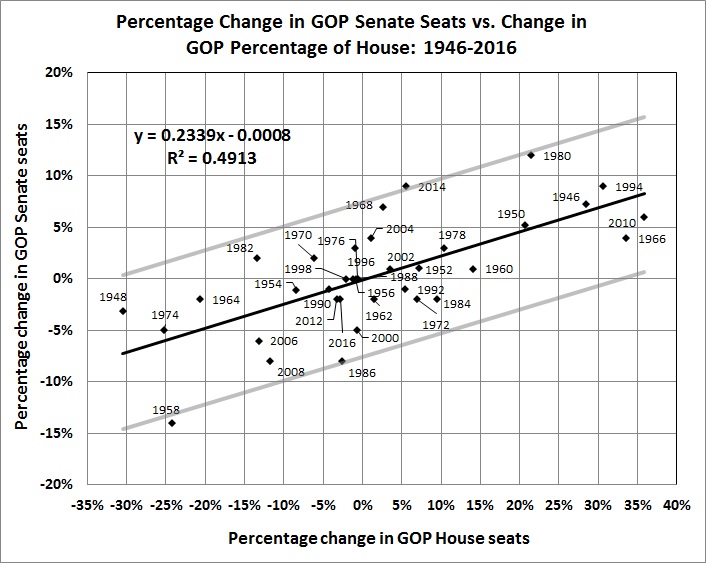
The graph below shows a similar range of uncertainty about the results of Senate races, which — if anything — are more idiosyncratic than House races.
All of the algorithms are cast in terms of Republican shares of electoral votes and changes in the numbers of seats held by Republicans. If you’re interested in Democrats, just estimate the numbers for Republicans and then do the appropriate conversions. Here are some examples:
- If you estimate or guess that the Republican candidate will win 55 percent of the two-party popular vote, it’s a good bet that he will win somewhere around 78 percent of electoral votes (from the equation in the first graph). That’s 420 electoral votes (0.78 x 538) for the Republican, leaving 118 for the Democrat (538 – 420).
- If the Republican candidate gets 55 percent of the two-party popular vote, the GOP will add about 2.3 percent to the number of House seats that it holds (from the equation in the second graph). If the GOP starts with 240 seats, that number will rise by 5 (after rounding) to 245, leaving 190 for the Democrats (435 – 245).
- A Republican gain of 2.3 percent in the House means approximately no gain in the Senate (from the equation in the third graph). If the GOP starts with 52 of the 100 Senate seats, it keeps that number, leaving 48 for Democrats (including “independents” who caucus with Democrats).
Those are baseline estimates, around which there’s some degree of uncertainty, which you can estimate by referring to the gray lines that delineate the 95-percent confidence intervals.
The biggest hurdle is coming up with a reasonable estimate of the GOP candidate’s share of the two-party popular vote, that is, the GOP share divided by the GOP share plus the Democrat share. (It is this share, rather than share of total popular vote, which yields the best estimate of electoral-vote share.)
You can pull a number out of the air. You can go with your favorite poll. Or you can go with an aggregation of polls, such as the aggregations at FiveThirtyEight and RealClearPolitics. I did it with several polls and aggregations of polls this year. Here’s my method for using FiveThirtyEight:
Start tracking the polling results around August 1, or after the major-party conventions and related “bounces.” In the case of FiveThirtyEight, follow the link and scroll down to “How the forecast has changed” and select “Popular vote.” By hovering your cursor over the graphic, you’ll get daily estimates of the popular-vote shares of the Republican and Democrat candidates and the leading third-party candidate, if there is one. This year, FiveThiryEight kept tabs on Gary Johnson’s poll numbers.
Set up an Excel spreadsheet and keep a daily tally of the numbers posted for each candidate. While you’re at it, also keep track of “other” by finding the difference between the totals for the named candidates and 100 percent. This year, that meant subtracting the Clinton, Trump, and Johnson shares from 100 percent.
Also compute the daily spread between the Democrat and Republican candidate. For the sake of this illustration, I’ll use a Republican minus Democrat (R-D) spread.
When you have enough observations — 15 or 20, say — run an Excel regression with R-D as the dependent variable. The explanatory variable(s) is (are) the shares going to candidate(s) other than the Democrat or Republican. This yields an estimate of how the R-D spread changes as voter shift away or toward from other choices. It’s a way of finding “shy” voters who don’t want to admit that they favor one of the major candidates, and it’s a way of detecting which major candidate stands to gain (or lose) the most as undecided voters make up their minds.
This year, I was able to use two explanatory variables: Johnson’s share (as reported by FiveThirtyEight) and the share for “other” (computed by subtracting the Clinton, Trump, and Johnson shares from 100 percent). If there’s no major third-party candidate, the only explanatory variable will be the share going to “other.”
How do you know what values to enter for the shares of the third-party and/or other candidates? Create a graph of the daily share(s) and add trend line(s) to it, projecting them out to election day. You can then choose the projected value(s) on election day, the most recent value(s), or your best guess(es).
The regression yields an estimate of the R-D spread, as a function of the explanatory variable(s). Divide the resulting estimate of the R-D spread by 2 and add the result to 50 percent (or subtract it from 50 percent if it’s negative), which gives the Republican candidate’s projected share of the two-party vote.
Keep updating the poll numbers, running the regressions, and plugging in your estimates of the values of the explanatory variable(s) until you’re confident of your results. I wasn’t confident until the day before election day because of the late shifts in polling results due to the FBI’s on-again, off-again investigation of Clinton’s e-mails.
In the end, because there’s statistical uncertainty about the relationships, you’ll have to make some judgment calls based on your knowledge of particular aspects of the election; for example:
- whether the incumbents in some key Senate races are especially vulnerable
- whether a popular presidential candidate is likely to have “coattails” that will help to swing a lot of House races
- whether a presidential candidate is likely to do worse than normal because she (I’m thinking of Clinton) is generally viewed unfavorably.
Got it? If not, leave a comment or e-mail me (instructions in the sidebar), and I try to make it clearer.
