There are many good reasons to believe that Biden’s almost-official election to the presidency was the result of electoral misfeasance, malfeasance, fraud, and judicial bias. But the statistical analysis reported at this link isn’t among them. The authors concocted a statistical model that, according to them,
explains 96% of county-level variance in Trump’s two-party vote share with four demographic variables (non-college white, college-educated white, black and hispanic) and one historical variable (the average of county-level GOP two-party presidential vote share, 2004-2016). All five variables are highly significant. This reinforces the conclusion that the model is generally a very strong predictor of vote shares, and so deviations from it should be considered surprising.
And
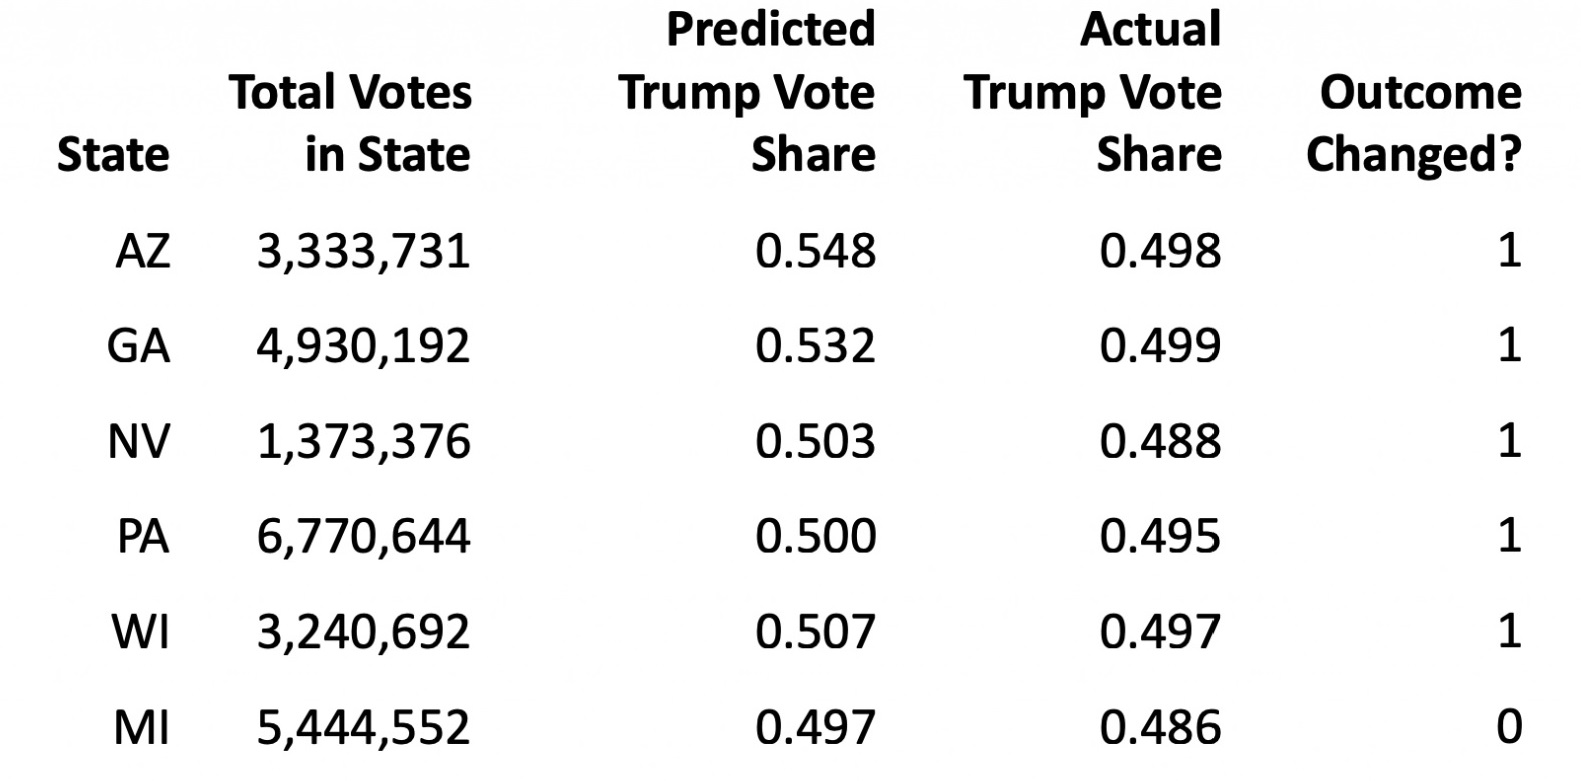
regression analysis shows Trump ought to have won AZ, GA, NV, PA, WI.
Are you convinced? I am not, because the authors (perhaps unwittingly) provide evidence that undermines their claim.
There is a table at the end of the article that gives Trump’s predicted share of the two-party vote for every State (except Alaska and Hawaii) and the District of Columbia. I compared the authors’ predictions with the State-level results compiled as of today at Dave Leip’s Atlas of U.S. Elections. The absolute average of the prediction errors in 1.9 percentage points. The absolute errors for the six States listed above are as follows (in percentage points): AZ, 5.0; GA, 3.3; NV, 1.5; PA, 0.6; WI, 1.0; and MI, 1.1. So, as it turns out, the only outcomes (of the six) that the authors’ predictions might point to as fraudulent are the ones in George and Nevada.
Further, the authors don’t bother to highlight Trump’s significant underperformance (relative to their regression results) in many other States: CA, 4.3; DE, 3.5; ID, 2.4; IN, 2.0; KY, 3.0; ME, 2.5; MD, 3.3; NE, 2.1; NH, 2.2; NM, 2.1; OR, 4.9; TX, 3.6; UT, 6.3; VT, 4.3; and WA, 4.0. If their regression results for Georgia and Nevada are indicative of fraud, so are the results in California, Delaware, … , Vermont, and Washington. But I am unaware of any claims that the official outcomes in those States are bogus.
On top of that, Trump did significantly better than the authors predicted in DC (8.5 percentage points) and North Dakota (3.4 percentage points). Is anyone seriously suggesting that there was electoral fraud favoring Trump in DC, or that his campaign had to resort to fraud in deep-Red North Dakota?
The bottom line: The authors made some good predictions and a lot of very bad ones (20 of their 49 predictions exceed the average absolute error). But there’s nothing in the predictions to prove that Biden’s putative victories in Arizona, Georgia, Nevada, Pennsylvania, and Wisconsin (or even Michigan) were obtained fraudulently. There is plenty of other evidence of misfeasance, malfeasance, and fraud in those States, but the authors’ statistical “proof” is nothing but a demonstration of the errors that abound in statistical analysis.
In this case, the errors resulted in the overprediction of Trump’s share of the vote in 39 States and D.C. — including, coincidentally, the six States that the authors claim to have shown were were stolen from Trump.
