The results of the final polls in the last five presidential elections have pointed to four winners. Sounds good? You won’t think so after reading this post.
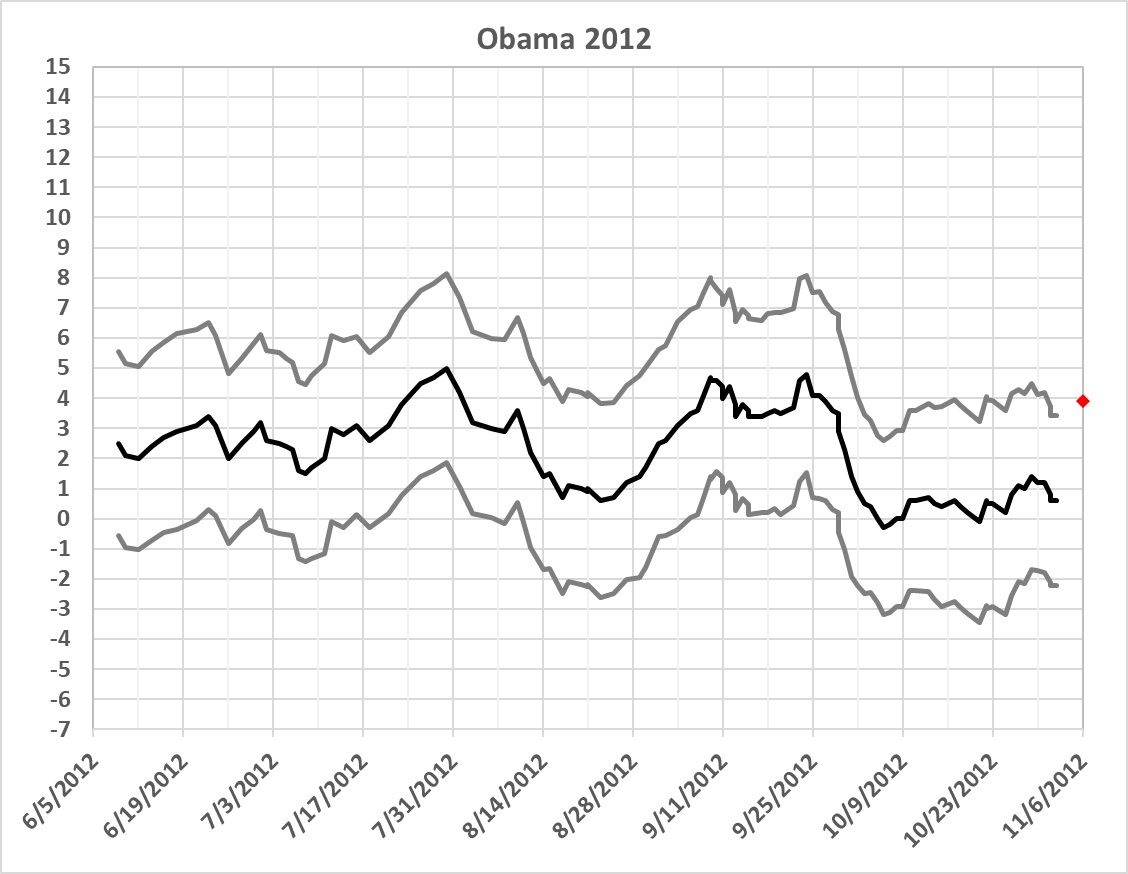
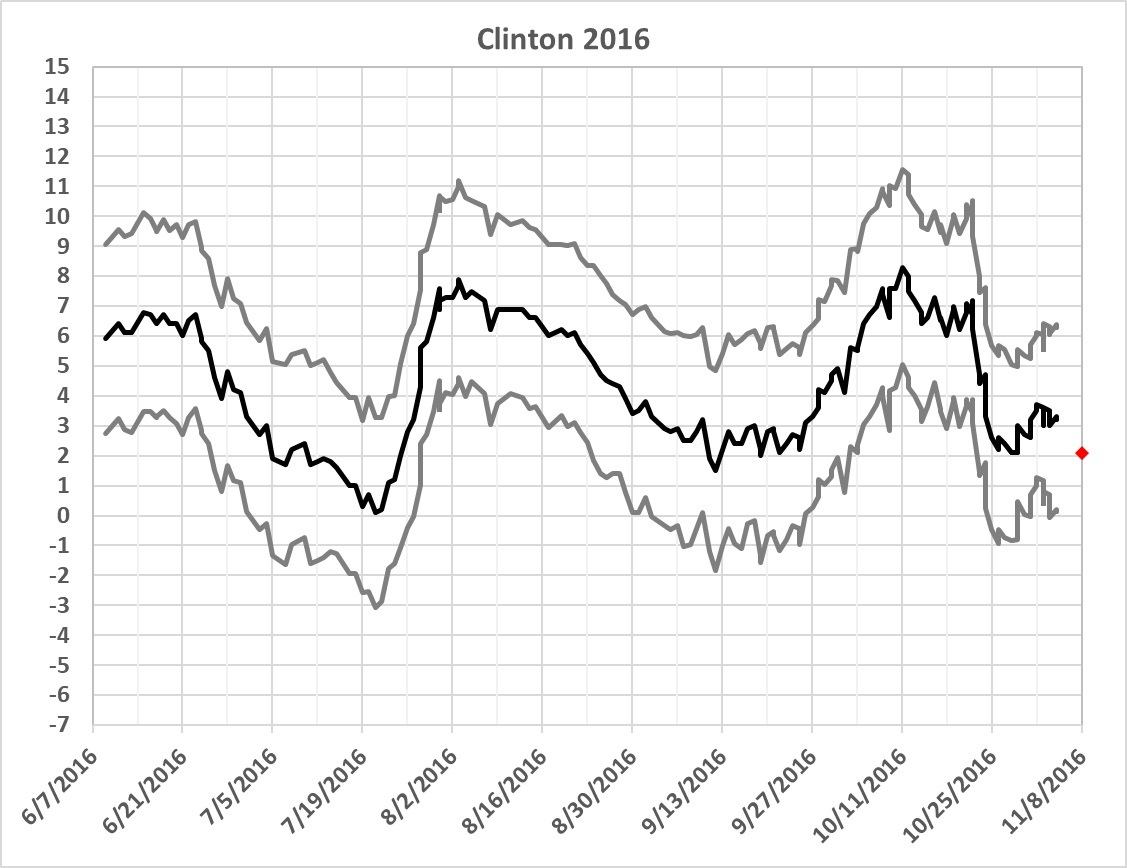
The values depicted in the graphs at the bottom of this post represent 10-poll averages of respondents’ presidential choices in two-way races (i.e., Republican or Democrat). The dates are mid-points of the periods during which the 10-poll samples were conducted.
The solid black lines trace the percentage-point lead (or deficit) for the eventual “winner” of the (meaningless) nationwide tally of the popular vote in each presidential election from 2004 through 2020. The gray lines trace the margins of error claimed by the organizations issuing the polls. (The dashed gray lines for 2004 are estimates derived by assuming a margin of error of 3 percentage points, which is typical of the later polls.) The range from the upper gray line to the lower gray line represents a 95-percent confidence interval; that is, the actual result would be within the range (or at its outer limit) with a probability of 95 percent.
The red diamond at the right in each graph is the “winner’s” actual margin of “victory” in the nationwide tally of popular votes. In every case, the actual margin of “victory” is within or at the outer limit of the final 95-percent confidence interval. (I use “sneer quotes” because there is no “winner” of the nationwide popular vote, which is a meaningless number. Presidential elections are decided State-by-State, and in 48 of 50 cases the candidate with the greatest number of popular votes in that State receives the State’s entire bloc of electoral votes.)
Putting that aside for the moment, the 95-percent confidence interval covers a range of about 6 percentage points. That is, the “winner’s” actual margin in the (meaningless) nationwide popular vote could be as many as 6 percentage points away the final 10-poll average. A margin of 6 percentage points means that the “winner’s” share of the popular vote could be 3 percent higher or lower than the share implied by the final 10-poll average. Given the statistical relationship between popular votes and electoral votes (discussed here), a shift of 3 percent can mean a gain or loss of 30 percent of the electoral vote.
What lies behind such a disproportionate response to such a small shift? It is the fact that a miniscule change in the distribution of a State’s popular vote can (in 48 cases out of 50) cause a 100-percent swing in the allocation of its electoral votes.
To take a concrete example, Trump won the electoral vote in 2016 despite Clinton’s 2.1 percent margin of “victory” in the tally of popular votes cast in the 50 States and District of Columbia. Clinton’s margin of “victory” was 2.9 million popular votes. She won California by 4.3 million popular votes. In other words, she “lost” the rest of the U.S. by 1.4 million popular votes. Crucially, she lost three States with a total of 46 electoral votes — Michigan, Pennsylvania, and Wisconsin — by margins of 0.2 to 0.8 percent. Those three losses cost her the election.
To take another example, Biden’s 4.5 percent popular-vote “victory” in 2020 was much larger than Clinton’s. His huge win in California (5.1 million votes more than Trump) left him with a “victory” of about 2 million votes in the rest of the country. But Biden wouldn’t have won the election without narrow victories in Arizona (11 EV, margin of 0.3 percent), Georgia (16 EV, 0.2 percent), Pennsylvania (20 EV, 1.18 percent), and Wisconsin (10 EV, 0.63 percent).
Finally, there’s the case of the 2000 election (not represented in the graphs below), which Bush “lost” by more than 500,000 votes. He didn’t really lose the election, of course, because he won the crucial State of Florida by 537 votes when the U.S. Supreme Court put a stop to the illegal manufacture of votes for Gore in several Democrat-controlled jurisdictions.
Is there a fail-safe lead in the polls? Let’s return to 2020, when Biden eked out an electoral-vote win by “beating” Trump nationwide by 4.5 percentage points — a lead that was at the bottom edge of the 95-percent confidence interval for the final 10 polls. The center of that confidence interval — the 10-poll average — was 7.6 percentage points. You might suppose that a lead (in the polls) of that size would guarantee an election victory, but it didn’t. A lot of dirty pool was required.
Finally, the accuracy of the polls is compromised by two other facts: The mid-point of the polling period for the final 10 polls occurs three or four days before election day. Early voting has become more prevalent in this century, and it played a huge role in the election of 2020.
The lesson learned: Don’t bet on the outcome of a presidential election unless a candidate is leading in the final 10 polls by, say, 9 percentage points or more. (See above commentary about Biden’s final poll numbers in 2020.) Don’t bet against that candidate, and don’t expect to win more than a pittance if you bet on him to win. Anything else — like betting on a 3-point favorite — is pure guesswork or hope.
That’s reality. And don’t let a pollster tell you otherwise.
Here are the graphs:


Sources and notes — Values derived from the polls of polls at RealClearPolitics.com for the presidential elections of 2004, 2008, 2012, 2016, and 2020. The polls completed entirely in June of each election year were organized chronologically according to the middle date of each polling period. A moving, 10-poll average/lead deficit was then computed, as well as moving 10-poll average margin of error.
