There’s a new spate of articles about Trump’s lead in the polls for so-called battleground States: Arizona, Georgia, Michigan, Nevada, North Carolina, Pennsylvania, and Wisconsin. Yes, Trump is still leading in all seven States, if you take an average of polls reported at RealClearPolitics. Here’s how the five-poll averages look for Trump:
- Arizona – up by 5.2 points and rising
- Georgia – up by 5.0 points and rising, but below earlier peak
- Michigan – up by 0.6 point and falling, well below earlier peak
- Nevada – up by 5.6 points and rising
- North Carolina – up by 5.8 points and falling, somewhat below earlier peak
- Pennsylvania – up by 2.6 points and rising, but below earlier peak
- Wisconsin – up by 0.6 point and falling, somewhat below earlier peak.
Only the leads in Arizona, Georgia, Nevada, and North Carolina are statistically significant (lower bound of 95-percent confidence interval is greater than zero).
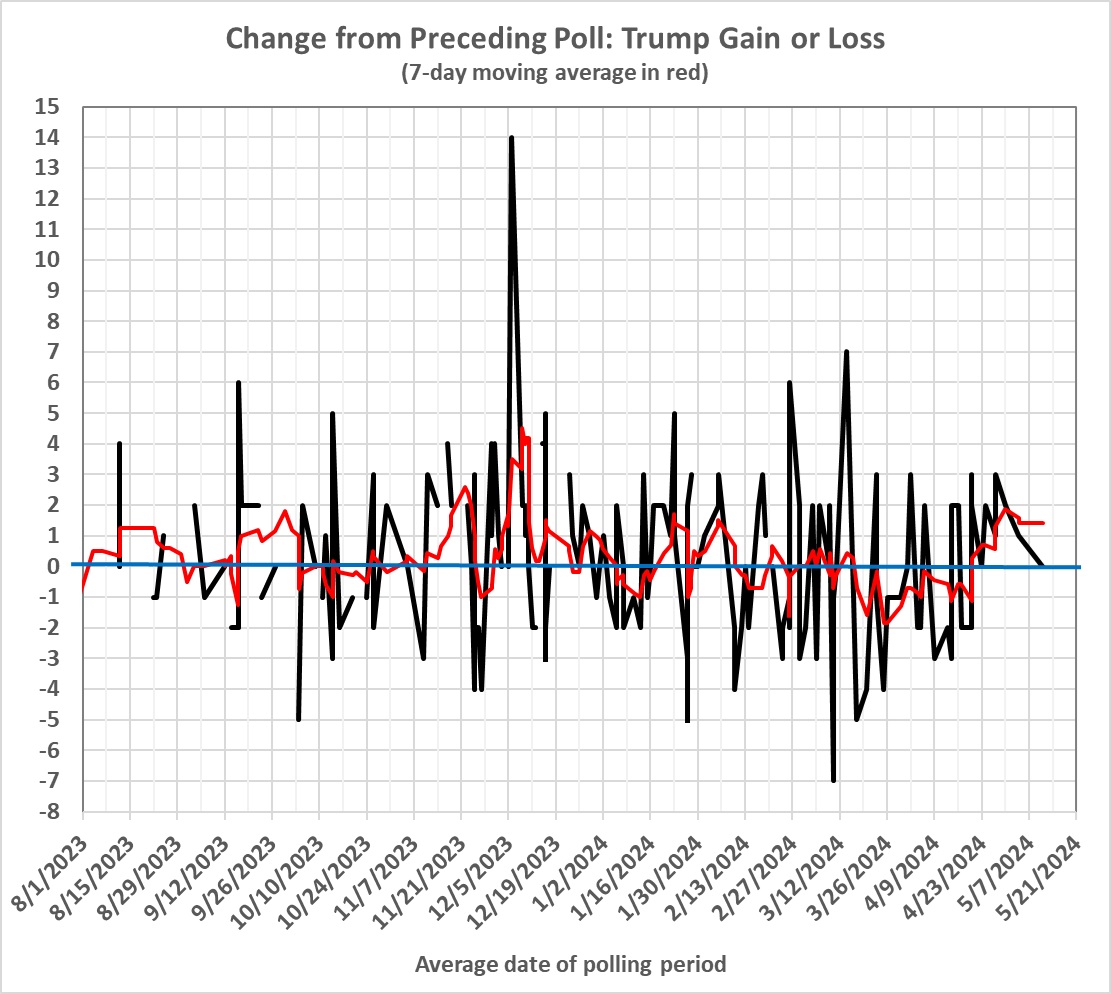
Adjustments for pollsters’ political biases — which I haven’t made — might make things look better for Trump. But the real problem with the “battleground” polls is their paucity. This can be seen by contrasting a metric I devised for nationwide polls with similar metrics for the “battleground” polls.
The metric is the change in each pollster’s results from poll to poll. For example, in the Morning Consult poll that was conducted May 3-May 5, Trump was up by 1 point. He was up by 1 point in the next Morning Consult poll which was conducted May 10-May 12. That counts as zero gain on the average date of the later poll: May 11. The full tally for all polls reported at RealClearPolitics since August 2023 looks like this:
Here’s a similar graph for Pennsylvania, which the most heavily polled of the “battlegrounds”:
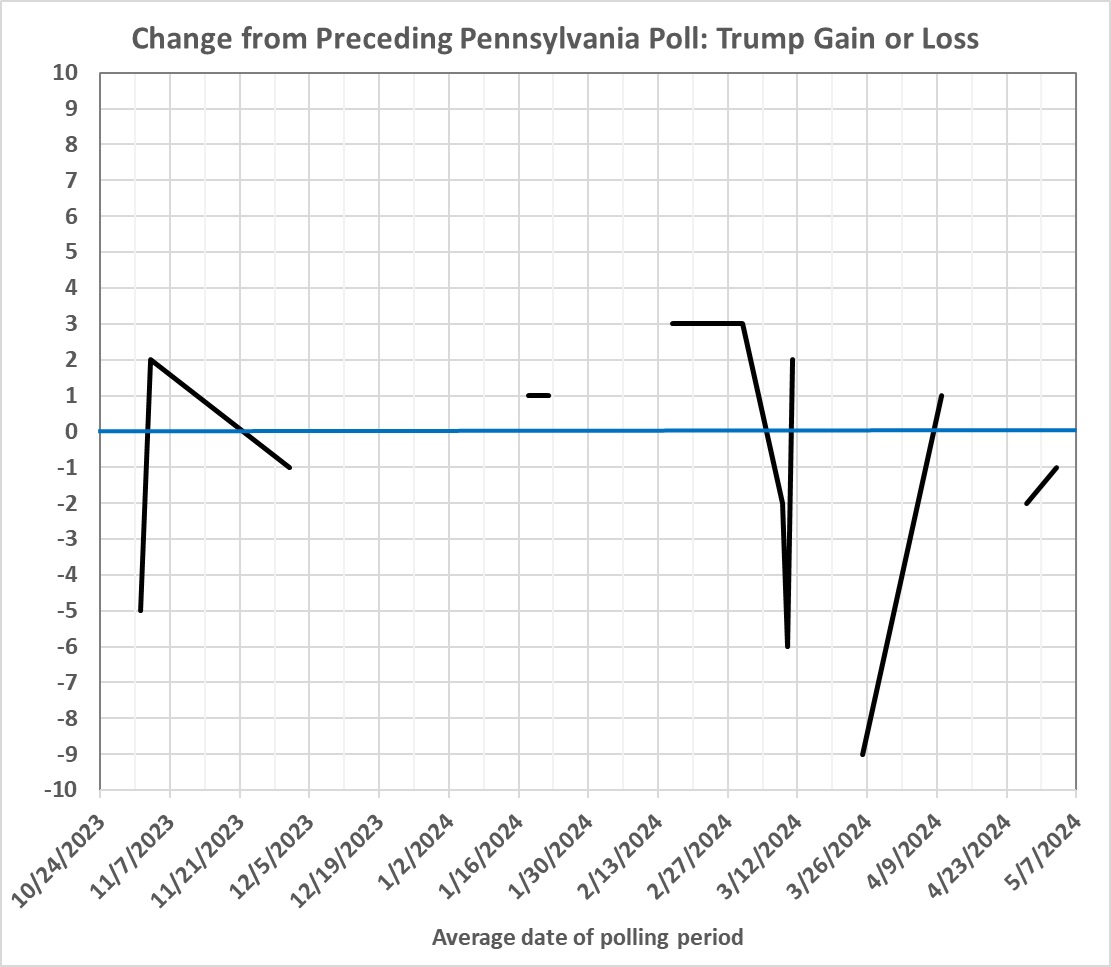
That’s not much to go on, is it?
What to do? I’m inclined to ignore the polls for individual States and keep my eye on the nationwide polls. But I will be more demanding of myself when I declare that Trump might win with a small lead or deficit in those polls.
As I say in the updated version of “Trump vs. Biden: 2“,
The statistical relationship in the graph [below] is meaningless. What can be meaningful is a narrow margin of victory (or loss) in a few States. This underlines the lesson from “How Good Are the Presidential Polls?“: Even a large lead in nationwide polls doesn’t signify victory in the Electoral College.
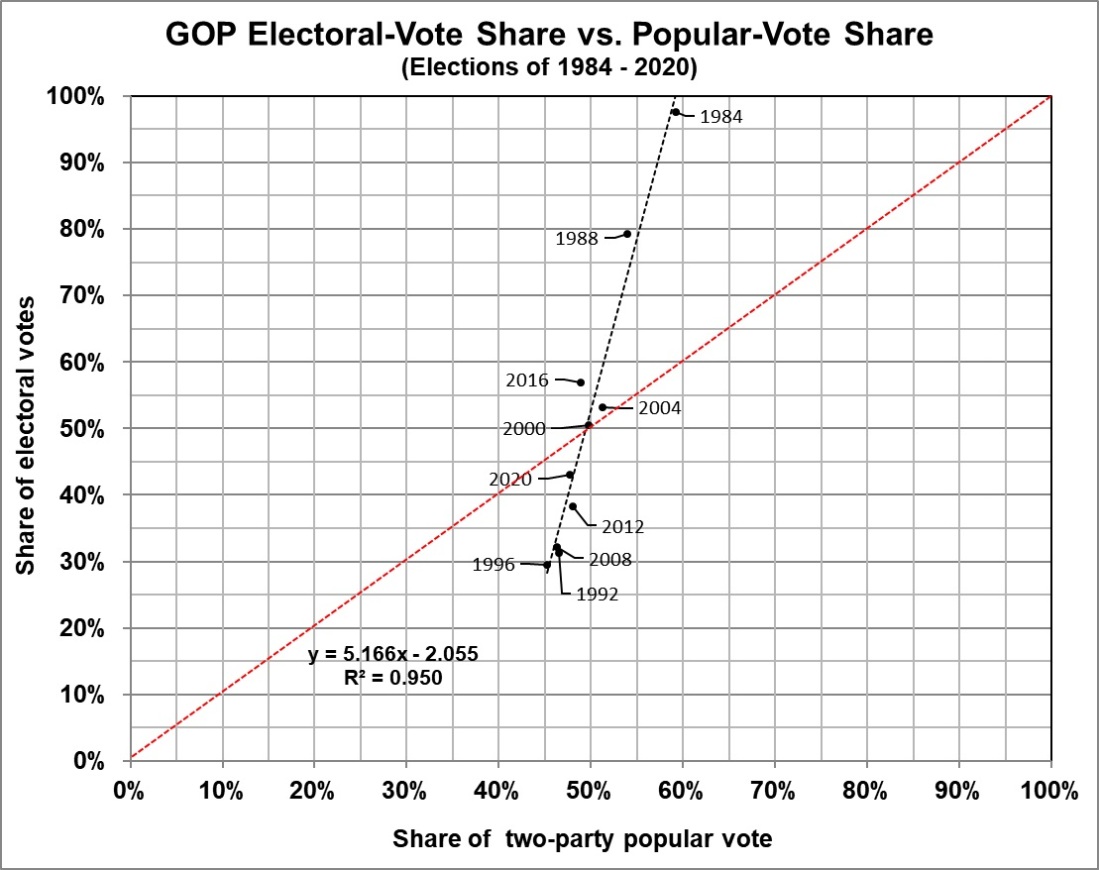
Well, the relationship isn’t quite meaningless. Here’s how it looks with a 90-percent confidence interval (which happens to encompass 100 percent of the data because the underlying distribution isn’t normal):

What this means is that I will be confident of a Trump victory (270 or more electoral votes) only if it looks like he will get 53 percent (or more) of the two-party popular vote, nationwide. A tally of at least 54 percent (a margin of at least 8 percentage points) would be convincing. (That’s close to my finger-to-the-wind estimate of 9 percentage points in “How Good Are the Presidential Polls?“, wherein I assessed the accuracy to the nationwide polls for the presidential elections of 2004-2020.)
If Trump doesn’t rack up a big margin, the Dems will be able to manufacture enough votes in key States to steal the election — again.
