UPDATED 11/18/16 (AT THE END)
What is intelligence? Why does it matter in “real life”? Are intelligence-driven “real life” outcomes — disparities in education and income — driving Americans apart? In particular, is the intermarriage of smart, educated professionals giving rise to a new hereditary class whose members have nothing in common with less-intelligent, poorly educated Americans, who will fall farther and farther behind economically? And if so, what should be done about it, if anything?
INTELLIGENCE AND WHY IT MATTERS IN “REAL LIFE”
Thanks to a post at Dr. James Thompson’s blog, Psychological comments, I found Dr. Linda Gottredson‘s paper, “Why g Matters: The Complexity of Everyday Life” (Intelligence 24:1, 79-132, 1997). The g factor — or just plain g — is general intelligence. I quote Gottredson’s article at length because it makes several key points about intelligence and why it matters in “real life.” For ease of reading, I’ve skipped over the many citations and supporting tables than lend authority to the article.
[W]hy does g have such pervasive practical utility? For example, why is a higher level of g a substantial advantage in carpentry, managing people, and navigating vehicles of all kinds? And, very importantly, why do those advantages vary in the ways they do? Why is g more helpful in repairing trucks than in driving them for a living? Or more for doing well in school than staying out of trouble?…
Also, can we presume that similar activities in other venues might be similarly affected by intelligence? For example, if differences in intelligence change the odds of effectively managing and motivating people on the job, do they also change the odds of successfully dealing with one’s own children? If so, why, and how much?
The heart of the argument I develop here is this: For practical purposes, g is the ability to deal with cognitive complexity — in particular, with complex information processing. All tasks in life involve some complexity, that is, some information processing. Life tasks, like job duties, vary greatly in their complexity (g loadedness). This means that the advantages of higher g are large in some situations and small in others, but probably never zero….
Although researchers disagree on how they define intelligence, there is virtual unanimity that it reflects the ability to reason, solve problems, think abstractly, and acquire knowledge. Intelligence is not the amount of information people know, but their ability to recognize, acquire, organize, update, select, and apply it effectively. In educational contexts, these complex mental behaviors are referred to as higher order thinking skills.
Stated at a more molecular level, g is the ability to mentally manipulate information — “to fill a gap, turn something over in one’s mind, make comparisons, transform the input to arrive at the output”….
[T]he active ingredient in test items seems to reside in their complexity. Any kind of item content-words, numbers, figures, pictures, symbols, blocks, mazes, and so on-can be used to create less to more g-loaded tests and test items. Differences in g loading seem to arise from variations in items’ cognitive complexity and thus the amount of mental manipulation they require….
Life is replete with uncertainty, change, confusion, and misinformation, sometimes minor and at times massive. From birth to death, life continually requires us to master abstractions, solve problems, draw inferences, and make judgments on the basis of inadequate information. Such demands may be especially intense in school, but they hardly cease when one walks out the school door. A close look at job duties in the workplace shows why….
When job analysis data for any large set of jobs are factor analyzed, they always reveal the major distinction among jobs to be the mental complexity of the work they require workers to perform. Arvey’s job analysis is particularly informative in showing that job complexity is quintessentially a demand for g….
Not surprisingly, jobs high in overall complexity require more education, .86 and .88, training, .76 and .51, and experience, .62 — and are viewed as the most prestigious, . 82. These correlations have sometimes been cited in support of the training hypothesis discussed earlier, namely, that sufficient training can render differences in g moot.
However, prior training and experience in a job never fully prepare workers for all contingencies. This is especially so for complex jobs, partly because they require workers to continually update job knowledge, .85. As already suggested, complex tasks often involve not only the appropriate application of old knowledge, but also the quick apprehension and use of new information in changing environments….
Many of the duties that correlate highly with overall job complexity suffuse our lives: advising, planning, negotiating, persuading, supervising others, to name just a few….
The National Adult Literacy Survey (NALS) of 26,000 persons aged 16 and older is one in a series of national literacy assessments developed by the Educational Testing Service (ETS) for the U.S. Department of Education. It is a direct descendent, both conceptually and methodologically, of the National Assessment of Educational Progress (NAEP) studies of reading among school-aged children and literacy among adults aged 21 to 25.
NALS, like its NAEP predecessors, is extremely valuable in understanding the complexity of everyday life and the advantages that higher g provides. In particular, NALS provides estimates of the proportion of adults who are able to perform everyday tasks of different complexity levels….
A look at the items in Figure 2 reveals their general relevance to social life. These are not obscure skills or bits of knowledge whose value is limited to academic pursuits. They are skills needed to carry out routine transactions with banks, social welfare agencies, restaurants, the post office, and credit card agencies; to understand contrasting views on public issues (fuel efficiency, parental involvement in schools); and to comprehend the events of the day (sports stories, trends in oil exports) and one’s personal options (welfare benefits, discount for early payment of bills, relative merits between two credit cards)….
[A]lthough the NALS items represent skills that are valuable in themselves, they are merely samples from broad domains of such skill. As already suggested, scores on the NALS reflect people’s more general ability (the latent trait) to master on a routine basis skills of different information-processing complexity….
[I]ndeed, the five levels of NALS literacy are associated with very different odds of economic well-being….
Each higher level of proficiency substantially improves the odds of economic well-being, generally halving the percentage living in poverty and doubling the percentage employed in the professions or management….
The effects of intelligence-like other psychological traits-are probabilistic, not deterministic. Higher intelligence improves the odds of success in school and work. It is an advantage, not a guarantee. Many other things matter.
However, the odds disfavor low-IQ people just about everywhere they turn. The differences in odds are relatively small in some aspects of life (law-abidingness), moderate in some (income), and large in others (educational, occupational attainment). But they are consistent. At a minimum (say, under conditions of simple tasks and equal prior knowledge), higher levels of intelligence act like the small percentage (2.7%) favoring the house in roulette at Monte Carlo — it yields enormous gains over the long run. Similarly, all of us make stupid mistakes from time to time, but higher intelligence helps protect us from accumulating a long, debilitating record of them.
To mitigate unfavorable odds attributable to low IQ, an individual must have some equally pervasive compensatory advantage-family wealth, winning personality, enormous resolve, strength of character, an advocate or benefactor, and the like. Such compensatory advantages may frequently soften but probably never eliminate the cumulative impact of low IQ. Conversely, high IQ acts like a cushion against some of life’s adverse circumstances, perhaps partly accounting for
why some children are more resilient than others in the face of deprivation and abuse….For the top 5% of the population (over IQ 125), success is really “yours to lose.” These people meet the minimum intelligence requirements of all occupations, are highly sought after for their extreme trainability, and have a relatively easy time with the normal cognitive demands of life. Their jobs are often high pressure, emotionally draining, and socially demanding …, but these jobs are prestigious and generally pay well. Although very high IQ individuals share many of the vicissitudes of life, such as divorce, illness, and occasional unemployment, they rarely become trapped in poverty or social pathology. They may be saints or sinners, healthy or unhealthy, content or emotionally troubled. They may or may not work hard and apply their talents to get ahead, and some will fail miserably. But their lot in life and their prospects for living comfortably are comparatively rosy.
There are, of course, multiple causes of different social and economic outcomes in life. However, g seems to be at the center of the causal nexus for many. Indeed, g is more important than social class background in predicting whether White adults obtain college degrees, live in poverty, are unemployed, go on welfare temporarily, divorce, bear children out of wedlock, and commit crimes.
There are many other valued human traits besides g, but none seems to affect individuals’ life chances so systematically and so powerfully in modern life as does g. To the extent that one is concerned about inequality in life chances, one must be concerned about differences in g….
Society has become more complex-and g loaded-as we have entered the information age and postindustrial economy. Major reports on the U.S. schools, workforce, and economy routinely argue, in particular, that the complexity of work is rising.
Where the old industrial economy rewarded mass production of standardized products for large markets, the new postindustrial economy rewards the timely customization and delivery of high-quality, convenient products for increasingly specialized markets. Where the old economy broke work into narrow, routinized, and closely supervised tasks, the new economy increasingly requires workers to work in cross-functional teams, gather information, make decisions, and undertake diverse, changing, and challenging sets of tasks in a fast-changing and dynamic global market….
Such reports emphasize that the new workplace puts a premium on higher order thinking, learning, and information-processing skills — in other words, on intelligence. Gone are the many simple farm and factory jobs where a strong back and willing disposition were sufficient to sustain a respected livelihood, regardless of IQ. Fading too is the need for highly developed perceptual-motor skills, which were once critical for operating and monitoring machines, as technology advances.
Daily life also seems to have become considerably more complex. For instance, we now have a largely moneyless economy-checkbooks, credit cards, and charge accounts-that requires more abstract thought, foresight, and complex management. More self-service, whether in banks or hardware stores, throws individuals back onto their own capabilities. We struggle today with a truly vast array of continually evolving complexities: the changing welter of social services across diverse, large bureaucracies; increasing options for health insurance, cable, and phone service; the steady flow of debate over health hazards in our food and environment; the maze of transportation systems and schedules; the mushrooming array of over-the-counter medicines in the typical drugstore; new technologies (computers) and forms of communication (cyberspace) for home as well as office.
Brighter individuals, families, and communities will be better able to capitalize on the new opportunities this increased complexity brings. The least bright will use them less effectively, if at all, and so fail to reap in comparable measure any benefits they offer. There is evidence that increasing proportions of individuals with below-average IQs are having trouble adapting to our increasingly complex modern life and that social inequality along IQ lines is increasing.
CHARLES MURRAY AND FISHTOWN VS. BELMONT
At the end of the last sentence, Gottfredson refers to Richard J. Herrnstein and Charles Murray’s The Bell Curve: Intelligence and Class Structure in American Life (1994). In a later book, Coming Apart: The State of White America, 1960-2010 (2012), Murray tackles the issue of social (and economic) inequality. Kay S. Hymowitz summarizes Murray’s thesis:
According to Murray, the last 50 years have seen the emergence of a “new upper class.” By this he means something quite different from the 1 percent that makes the Occupy Wall Streeters shake their pitchforks. He refers, rather, to the cognitive elite that he and his coauthor Richard Herrnstein warned about in The Bell Curve. This elite is blessed with diplomas from top colleges and with jobs that allow them to afford homes in Nassau County, New York and Fairfax County, Virginia. They’ve earned these things not through trust funds, Murray explains, but because of the high IQs that the postindustrial economy so richly rewards.
Murray creates a fictional town, Belmont, to illustrate the demographics and culture of the new upper class. Belmont looks nothing like the well-heeled but corrupt, godless enclave of the populist imagination. On the contrary: the top 20 percent of citizens in income and education exemplify the core founding virtues Murray defines as industriousness, honesty, marriage, and religious observance….
The American virtues are not doing so well in Fishtown, Murray’s fictional working-class counterpart to Belmont. In fact, Fishtown is home to a “new lower class” whose lifestyle resembles The Wire more than Roseanne. Murray uncovers a five-fold increase in the percentage of white male workers on disability insurance since 1960, a tripling of prime-age men out of the labor force—almost all with a high school degree or less—and a doubling in the percentage of Fishtown men working less than full-time…..
Most disastrous for Fishtown residents has been the collapse of the family, which Murray believes is now “approaching a point of no return.” For a while after the 1960s, the working class hung on to its traditional ways. That changed dramatically by the 1990s. Today, under 50 percent of Fishtown 30- to 49-year-olds are married; in Belmont, the number is 84 percent. About a third of Fishtowners of that age are divorced, compared with 10 percent of Belmonters. Murray estimates that 45 percent of Fishtown babies are born to unmarried mothers, versus 6 to 8 percent of those in Belmont.
And so it follows: Fishtown kids are far less likely to be living with their two biological parents. One survey of mothers who turned 40 in the late nineties and early 2000s suggests the number to be only about 30 percent in Fishtown. In Belmont? Ninety percent—yes, ninety—were living with both mother and father….
For all their degrees, the upper class in Belmont is pretty ignorant about what’s happening in places like Fishtown. In the past, though the well-to-do had bigger houses and servants, they lived in towns and neighborhoods close to the working class and shared many of their habits and values. Most had never gone to college, and even if they had, they probably married someone who hadn’t. Today’s upper class, on the other hand, has segregated itself into tony ghettos where they can go to Pilates classes with their own kind. They marry each other and pool their incomes so that they can move to “Superzips”—the highest percentiles in income and education, where their children will grow up knowing only kids like themselves and go to college with kids who grew up the same way.
In short, America has become a segregated, caste society, with a born elite and an equally hereditary underclass. A libertarian, Murray believes these facts add up to an argument for limited government. The welfare state has sapped America’s civic energy in places like Fishtown, leaving a population of disengaged, untrusting slackers….
But might Murray lay the groundwork for fatalism of a different sort? “The reason that upper-middle-class children dominate the population of elite schools,” he writes, “is that the parents of the upper-middle class now produce a disproportionate number of the smartest children.” Murray doesn’t pursue this logic to its next step, and no wonder. If rich, smart people marry other smart people and produce smart children, then it follows that the poor marry—or rather, reproduce with—the less intelligent and produce less intelligent children. [“White Blight,” City Journal, January 25, 2012]
In the last sentence of that quotation, Hymowitz alludes to assortative mating.
ADDING 2 AND 2 TO GET ?
So intelligence is real; it’s not confined to “book learning”; it has a strong influence on one’s education, work, and income (i.e., class); and because of those things it leads to assortative mating, which (on balance) reinforces class differences. Or so the story goes.
But assortative mating is nothing new. What might be new, or more prevalent than in the past, is a greater tendency for intermarriage within the smart-educated-professional class instead of across class lines, and for the smart-educated-professional class to live in “enclaves” with their like, and to produce (generally) bright children who’ll (mostly) follow the lead of their parents.
How great are those tendencies? And in any event, so what? Is there a potential social problem that will have to be dealt with by government because it poses a severe threat to the nation’s political stability or economic well-being? Or is it just a step in the voluntary social evolution of the United States — perhaps even a beneficial one?
Is there a growing tendency toward intermarriage among the smart-educated-professional class? It depends on how you look at it. Here, for example, are excerpts of commentaries about a paper by Jeremy Greenwood et al., “Marry Your Like: Assortative Mating and Income Inequality” (American Economic Review, 104:5, 348-53, May 2014 — also published as NBER Working Paper 19289):
[T]he abstract is this:
Has there been an increase in positive assortative mating? Does assortative mating contribute to household income inequality? Data from the United States Census Bureau suggests there has been a rise in assortative mating. Additionally, assortative mating affects household income inequality. In particular, if matching in 2005 between husbands and wives had been random, instead of the pattern observed in the data, then the Gini coefficient would have fallen from the observed 0.43 to 0.34, so that income inequality would be smaller. Thus, assortative mating is important for income inequality. The high level of married female labor-force participation in 2005 is important for this result.
That is quite a significant effect. [Tyler Cowen, “Assortative Mating and Income Inequality,” Marginal Revolution, January 27, 2014]
__________
The wage gap between highly and barely educated workers has grown, but that could in theory have been offset by the fact that more women now go to college and get good jobs. Had spouses chosen each other at random, many well-paid women would have married ill-paid men and vice versa. Workers would have become more unequal, but households would not. With such “random” matching, the authors estimate that the Gini co-efficient, which is zero at total equality and one at total inequality, would have remained roughly unchanged, at 0.33 in 1960 and 0.34 in 2005.
But in reality the highly educated increasingly married each other. In 1960 25% of men with university degrees married women with degrees; in 2005, 48% did. As a result, the Gini rose from 0.34 in 1960 to 0.43 in 2005.
Assortative mating is hardly mysterious. People with similar education tend to work in similar places and often find each other attractive. On top of this, the economic incentive to marry your peers has increased. A woman with a graduate degree whose husband dropped out of high school in 1960 could still enjoy household income 40% above the national average; by 2005, such a couple would earn 8% below it. In 1960 a household composed of two people with graduate degrees earned 76% above the average; by 2005, they earned 119% more. Women have far more choices than before, and that is one reason why inequality will be hard to reverse. [The Economist, “Sex, Brains, and Inequality,” February 8, 2014]
__________
I’d offer a few caveats:
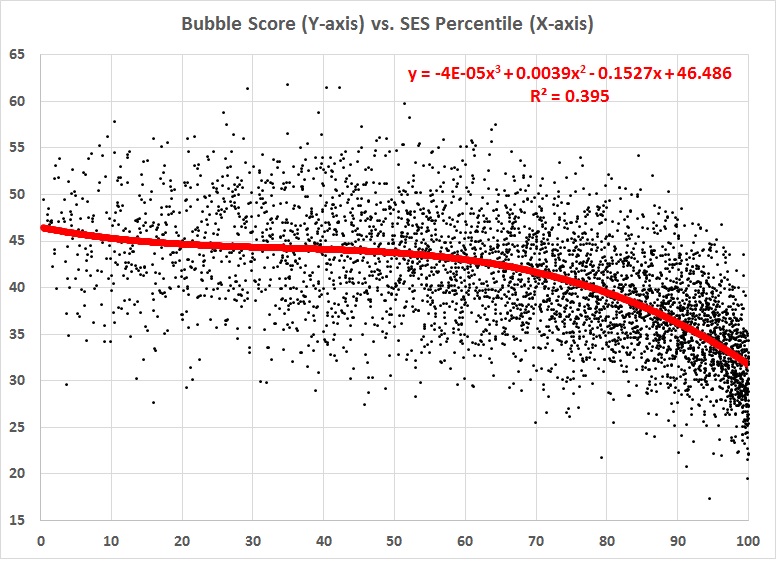
- Comparing observed GINI with a hypothetical world in which marriage patterns are completely random is a bit misleading. Marriage patterns weren’t random in 1960 either, and the past popularity of “Cinderella marriages” is more myth than reality. In fact, if you look at the red diagonals [in the accompanying figures], you’ll notice that assortative mating has actually increased only modestly since 1960.
- So why bother with a comparison to a random counterfactual? That’s a little complicated, but the authors mainly use it to figure out why 1960 is so different from 2005. As it turns out, they conclude that rising income inequality isn’t really due to a rise in assortative mating per se. It’s mostly due to the simple fact that more women work outside the home these days. After all, who a man marries doesn’t affect his household income much if his wife doesn’t have an outside job. But when women with college degrees all started working, it caused a big increase in upper class household incomes regardless of whether assortative mating had increased.
- This can get to sound like a broken record, but whenever you think about rising income inequality, you always need to keep in mind that over the past three decades it’s mostly been a phenomenon of the top one percent. It’s unlikely that either assortative mating or the rise of working women has had a huge impact at those income levels, and therefore it probably hasn’t had a huge impact on increasing income inequality either. (However, that’s an empirical question. I might be wrong about it.)
[Kevin Drum, “No the Decline of Cinderella Marriages Probably Hasn’t Played a Big Role in Rising Income Inequality,” Mother Jones, January 27, 2014]
In sum:
- The rate of intermarriage at every level of education rose slightly between 1960 and 2005.
- But the real change between 1960 and 2005 was that more and more women worked outside the home — a state of affairs that “progressives” applaud. It is that change which has led to a greater disparity between the household incomes of poorly educated couples and those of highly educated couples. (Hereinafter, I omit the “sneer quotes” around “progressives,” “progressive,” and “Progressivism,” but only to eliminate clutter.)
- While that was going on, the measure of inequality in the incomes of individuals didn’t change. (Go to “In Which We’re Vindicated. Again,” Political Calculations, January 28, 2014, and scroll down to the figure titled “GINI Ratios for U.S. Households, Families, and Individuals, 1947-2010.”)
- Further, as Kevin Drum notes, the rise in income inequality probably has almost nothing to do with a rise in the rate of assortative mating and much to do with the much higher incomes commanded by executives, athletes, entrepreneurs, financiers, and “techies” — a development that shouldn’t bother anyone, even though it does bother a lot of people. (See my post “Mass (Economic) Hysteria: Income Inequality and Related Themes,” and follow the many links therein to other posts of mine and to the long list of related readings.)
Moreover, intergenerational mobility in the United States hasn’t changed in the past several decades:
Our analysis of new administrative records on income shows that children entering the labor market today have the same chances of moving up in the income distribution relative to their parents as children born in the 1970s. Putting together our results with evidence from Hertz (2007) and Lee and Solon (2009) that intergenerational elasticities of income did not change significantly between the 1950 and 1970 birth cohorts, we conclude that rank-based measures of social mobility have remained remarkably stable over the second half of the twentieth century in the United States….
The lack of a trend in intergenerational mobility contrasts with the increase in income inequality in recent decades. This contrast may be surprising given the well-known negative correlation between inequality and mobility across countries (Corak 2013). Based on this “Great Gatsby curve,” Krueger (2012) predicted that recent increases in inequality would increase the intergenerational persistence of income by 20% in the U.S. One explanation for why this prediction was not borne out is that much of the increase in inequality has been driven by the extreme upper tail (Piketty and Saez 2003, U.S. Census Bureau 2013). In [Chetty et al. 2014, we show that there is little or no correlation between mobility and extreme upper tail inequality – as measured e.g. by top 1% income shares – both across countries and across areas within the U.S….
The stability of intergenerational mobility is perhaps more surprising in light of evidence that socio-economic gaps in early indicators of success such as test scores (Reardon 2011), parental inputs (Ramey and Ramey 2010), and social connectedness (Putnam, Frederick, and Snellman 2012) have grown over time. Indeed, based on such evidence, Putnam, Frederick, and Snellman predicted that the “adolescents of the 1990s and 2000s are yet to show up in standard studies of intergenerational mobility, but the fact that working class youth are relatively more disconnected from social institutions, and increasingly so, suggests that mobility is poised to plunge dramatically.” An important question for future research is why such a plunge in mobility has not occurred. [Raj Chetty et al., “Is the United States Still a Land of Opportunity? Recent Trends in Intergenerational Mobility,” NBER Working Paper 19844, January 2014]
Figure 3 of the paper by Chetty et al. nails it down:
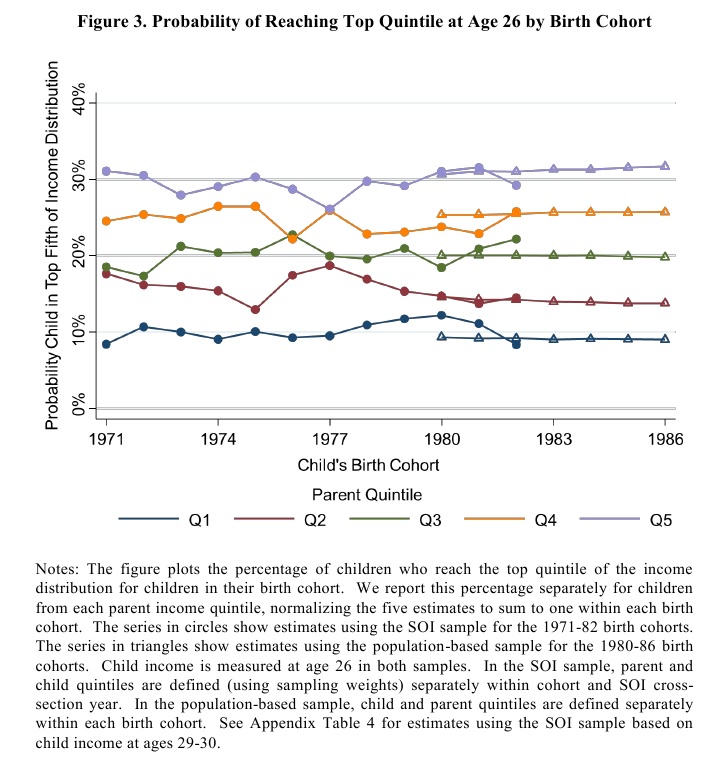
The results for ages 29-30 are close to the results for age 26.
What does it all mean? For one thing, it means that the children of top-quintile parents reach the top quintile about 30 percent of the time. For another thing, it means that, unsurprisingly, the children of top-quintile parents reach the top quintile more often than children of second-quintile parents, who reach the top quintile more often than children of third-quintile parents, and so on.
There is nevertheless a growing, quasi-hereditary, smart-educated-professional-affluent class. It’s almost a sure thing, given the rise of the two-professional marriage, and given the correlation between the intelligence of parents and that of their children, which may be as high as 0.8. However, as a fraction of the total population, membership in the new class won’t grow as fast as membership in the “lower” classes because birth rates are inversely related to income.
And the new class probably will be isolated from the “lower” classes. Most members of the new class work and live where their interactions with persons of “lower” classes are restricted to boss-subordinate and employer-employee relationships. Professionals, for the most part, work in office buildings, isolated from the machinery and practitioners of “blue collar” trades.
But the segregation of housing on class lines is nothing new. People earn more, in part, so that they can live in nicer houses in nicer neighborhoods. And the general rise in the real incomes of Americans has made it possible for persons in the higher income brackets to afford more luxurious homes in more luxurious neighborhoods than were available to their parents and grandparents. (The mansions of yore, situated on “Mansion Row,” were occupied by the relatively small number of families whose income and wealth set them widely apart from the professional class of the day.) So economic segregation is, and should be, as unsurprising as a sunrise in the east.
WHAT’S THE PROGRESSIVE SOLUTION TO THE NON-PROBLEM?
None of this will assuage progressives, who like to claim that intelligence (like race) is a social construct (while also claiming that Republicans are stupid); who believe that incomes should be more equal (theirs excepted); who believe in “diversity,” except when it comes to where most of them choose to live and school their children; and who also believe that economic mobility should be greater than it is — just because. In their superior minds, there’s an optimum income distribution and an optimum degree of economic mobility — just as there is an optimum global temperature, which must be less than the ersatz one that’s estimated by combining temperatures measured under various conditions and with various degrees of error.
The irony of it is that the self-segregated, smart-educated-professional-affluent class is increasingly progressive. Consider the changing relationship between party preference and income:
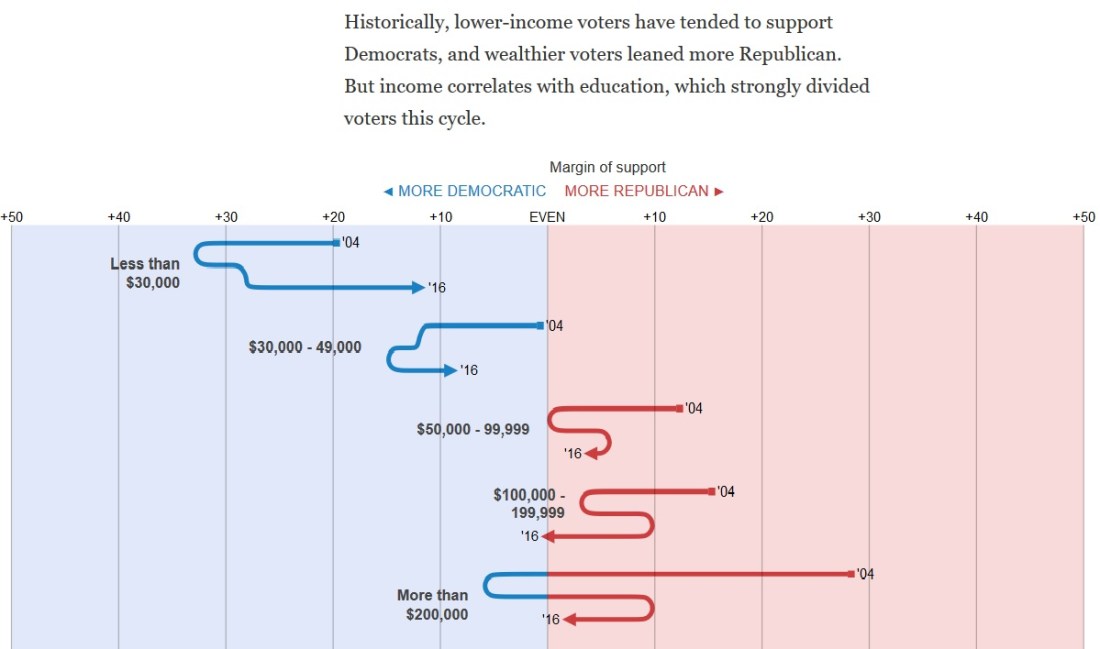
Source: K.K. Rebecca Lai et al., “How Trump Won the Election According to Exit Polls,” The New York Times, November 16, 2016.
The elections between 2004 and 2016 are indicated by the elbows in the zig-zag lines for each of the income groups. For example, among voters earning more than $200,000, the Times estimates that almost 80 percent (+30) voted Republican in 2004, as against 45 percent in 2008, 60 percent in 2012, and just over 50 percent in 2016. Even as voters in the two lowest brackets swung toward the GOP (and Trump) between 2004 and 2016, voters in the three highest brackets were swinging toward the Democrat Party (and Clinton).
Those shifts are consistent with the longer trend among persons with bachelor’s degrees and advanced degrees toward identification with the Democrat Party. See, for example, the graphs showing relationships between party affiliation and level of education at “Party Identification Trends, 1992-2014” (Pew Research Center, April 7, 2015). The smart-educated-professional-affluent class consists almost entirely of persons with bachelor’s and advanced degrees.
So I ask progressives, given that you have met the new class and it is you, what do you want to do about it? Is there a social problem that might arise from greater segregation of socio-economic classes, and is it severe enough to warrant government action. Or is the real “problem” the possibility that some people — and their children and children’s children, etc. — might get ahead faster than other people — and their children and children’s children, etc.?
Do you want to apply the usual progressive remedies? Penalize success through progressive (pun intended) personal income-tax rates and the taxation of corporate income; force employers and universities to accept low-income candidates (whites included) ahead of better-qualified ones (e.g., your children) from higher-income brackets; push “diversity” in your neighborhood by expanding the kinds of low-income housing programs that helped to bring about the Great Recession; boost your local property and sales taxes by subsidizing “affordable housing,” mandating the payment of a “living wage” by the local government, and applying that mandate to contractors seeking to do business with the local government; and on and on down the list of progressive policies?
Of course you do, because you’re progressive. And you’ll support such things in the vain hope that they’ll make a difference. But not everyone shares your naive beliefs in blank slates, equal ability, and social homogenization (which you don’t believe either, but are too wedded to your progressive faith to admit). What will actually be accomplished — aside from tokenism — is social distrust and acrimony, which had a lot to do with the electoral victory of Donald J. Trump, and economic stagnation, which hurts the “little people” a lot more than it hurts the smart-educated-professional-affluent class.
Where the progressive view fails, as it usually does, is in its linear view of the world and dependence on government “solutions.” As the late Herbert Stein said, “If something cannot go on forever, it will stop.” The top 1-percent doesn’t go on forever; its membership is far more volatile than that of lower income groups. Neither do the top 10-percent or top quintile go on forever. There’s always a top 1-percent, a top 10-percent and top quintile, by definition. But the names change constantly, as the paper by Chetty et al. attests.
The solution to the pseudo-problem of economic inequality is benign neglect, which isn’t a phrase that falls lightly from the lips of progressives. For more than 80 years, a lot of Americans — and too many pundits, professors, and politicians — have been led astray by that one-off phenomenon: the Great Depression. FDR and his sycophants and their successors created and perpetuated the myth that an activist government saved America from ruin and totalitarianism. The truth of the matter is that FDR’s policies prolonged the Great Depression by several years, and ushered in soft despotism, which is just “friendly” fascism. And all of that happened at the behest of people of above-average intelligence and above-average incomes.
Progressivism is the seed-bed of eugenics, and still promotes eugenics through abortion on demand (mainly to rid the world of black babies). My beneficial version of eugenics would be the sterilization of everyone with an IQ above 125 or top-40-percent income who claims to be progressive.
WHAT IS THE REAL PROBLEM? (ADDED 11/18/16)
It’s not the rise of the smart-educated-professional-affluent class. It’s actually a problem that has nothing to do with that. It’s the problem pointed to by Charles Murray, and poignantly underlined by a blogger named Tori:
Over the summer, my little sister had a soccer tournament at Bloomsburg University, located in central Pennsylvania. The drive there was about three hours and many of the towns we drove through shocked me. The conditions of these towns were terrible. Houses were falling apart. Bars and restaurants were boarded up. Scrap metal was thrown across front lawns. White, plastic lawn chairs were out on the drooping front porches. There were no malls. No outlets. Most of these small towns did not have a Walmart, only a dollar store and a few run down thrift stores. In almost every town, there was an abandoned factory.
My father, who was driving the car, turned to me and pointed out a Trump sign stuck in a front yard, surrounded by weeds and dead grass. “This is Trump country, Tori,” He said. “These people are desperate, trapped for life in these small towns with no escape. These people are the ones voting for Trump.”
My father understood Trump’s key to success, even though it would leave the media and half of America baffled and terrified on November 9th. Trump’s presidency has sparked nationwide outrage, disbelief and fear.
And, while I commend the passion many of my fellow millennials feels towards minorities and the fervency they oppose the rhetoric they find dangerous, I do find many of their fears unfounded. I don’t find their fears unfounded because I negate the potency of racism. Or the potency of oppression. Or the potency of hate.
I find these fears unfounded because these people groups have an army fighting for them. This army is full of celebrities, politicians, billionaires, students, journalists and passionate activists. Trust me, minorities will be fine with an army like this defending them.
And, I would argue, that these minorities aren’t the only ones who need our help. The results of Tuesday night did not expose a red shout of racism but a red shout for help….
The majority of rhetoric going around says that if you’re white, you have an inherent advantage in life. I would argue that, at least for the members of these small impoverished communities, their whiteness only harms them as it keeps their immense struggles out of the public eye.
Rural Americans suffer from a poverty rate that is 3 points higher than the poverty rate found in urban America. In Southern regions, like Appalachia, the poverty rate jumps to 8 points higher than those found in cities. One fifth of the children living in poverty live rural areas. The children in this “forgotten fifth” are more likely to live in extreme poverty and live in poverty longer than their urban counterparts. 57% of these children are white….
Lauren Gurley, a freelance journalist, wrote a piece that focuses on why politicians, namely liberal ones, have written off rural America completely. In this column she quotes Lisa Pruitt, a law professor at the University of California who focuses many of her studies on life in rural America. Pruitt argues that mainstream America ignores poverty stricken rural America because the majority of America associates rural poverty with whiteness. She attributes America’s lack of empathy towards white poverty to the fact that black poverty is attributed to institutionalized racism, while white people have no reason to be poor, unless poor choices were made….
For arguably the first time since President Kennedy in the 1950’s, Donald Trump reached out to rural America. Trump spoke out often about jobs leaving the US, which has been felt deeply by those living in the more rural parts of the country. Trump campaigned in rural areas, while Clinton mostly campaigned in cities. Even if you do not believe Trump will follow through on his promises, he was still one of the few politicians who focused his vision on rural communities and said “I see you, I hear you and I want to help you.”
Trump was the “change” candidate of the 2016 election. Whether Trump proposed a good change or bad change is up to you, but it can’t be denied that Trump offered change. Hillary Clinton, on the other hand, was the establishment candidate. She ran as an extension of Obama and, even though this appealed to the majority of voters located in cities, those in the country were looking for something else. Obama’s policies did little to help alleviate the many ailments felt by those in rural communities. In response, these voters came out for the candidate who offered to “make America great again.”
I believe that this is why rural, white communities voted for Trump in droves. I do not believe it was purely racism. I believe it is because no one has listened to these communities’ cries for help. The media and our politicians focus on the poverty and deprivation found in cities and, while bringing these issues to light is immensely important, we have neglected another group of people who are suffering. It is not right to brush off all of these rural counties with words like “deplorable” and not look into why they might have voted for Trump with such desperation.
It was not a racist who voted for Trump, but a father who has no possible way of providing a steady income for his family. It was not a misogynist who voted for Trump, but a mother who is feeding her baby mountain dew out of a bottle. It was not a deplorable who voted for Trump, but a young man who has no possibility of getting out of a small town that is steadily growing smaller.
The people America has forgotten about are the ones who voted for Donald Trump. It does not matter if you agree with Trump. It does not matter if you believe that these people voted for a candidate who won’t actually help them. What matters is that the red electoral college map was a scream for help, and we’re screaming racist so loud we don’t hear them. Hatred didn’t elect Donald Trump; People did. [“Hate Didn’t Elect Donald Trump; People Did,” Tori’s Thought Bubble, November 12, 2016]
Wise words. The best way to help the people of whom Tori writes — the people of Charles Murray’s Fishtown — is to ignore the smart-educated-professional-affluent class. It’s a non-problem, as discussed above. The best way to help the forgotten people of America is to unleash the latent economic power of the United States by removing the dead hand of government from the economy.