I said this in “AGW in Austin?“:
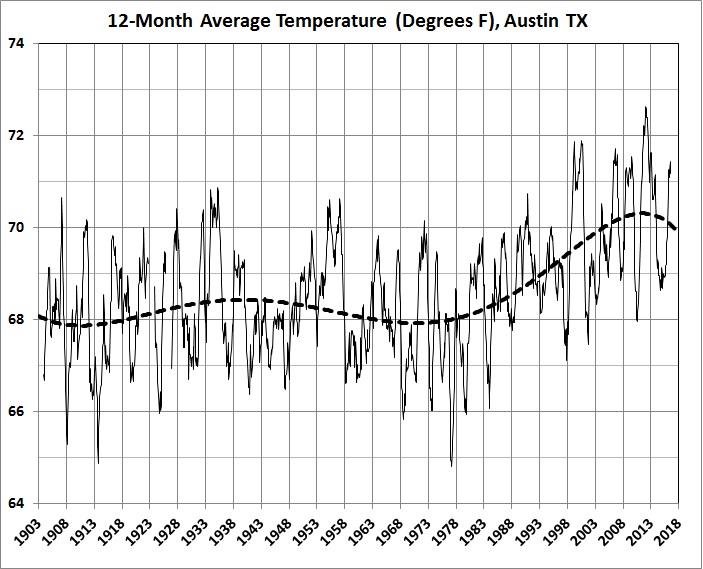
There’s a rise in temperatures [in Austin] between the 1850s and the early 1890s, consistent with the gradual warming that followed the Little Ice Age. The gap between the early 1890s and mid-19naughts seems to have been marked by lower temperatures. It’s possible to find several mini-trends between the mid-19naughts and 1977, but the most obvious “trend” is a flat line for the entire period….
Following the sudden jump between 1977 and 1980, the “trend” remains almost flat through 1997, albeit at a slightly higher level….
The sharpest upward trend really began after the very strong (and naturally warming) El Niño of 1997-1998….
Oh, wait! It turns out that Austin’s sort-of hot-spell from 1998 to the present coincides with the “pause” in global warming….
The rapid increase in Austin’s population since 2000 probably has caused an acceleration of the urban heat-island (UHI) effect. This is known to inflate city temperatures above those in the surrounding countryside by several degrees.
What about drought? In Austin, the drought of recent years is far less severe than the drought of the 1950s, but temperatures have risen more in recent years than they did in the 1950s….
Why? Because Austin’s population is now six times greater than it was in the 1950s. The UHI effect has magnified the drought effect.
Conclusion: Austin’s recent hot weather has nothing to do with AGW.
Now, I’ll quantify the relationship between temperature, precipitation, and population. Here are a few notes about the analysis:
- I have annual population estimates for Austin from 1960 to the present. However, to tilt the scale in favor of AGW, I used values for 1968-2015, because the average temperature in 1968 was the lowest recorded since 1924.
- I reduced the official population figures for 1998-2015 to reflect a major annexation in 1998 that significantly increased Austin’s population. The statistical effect of that adjustment is to reduce the apparent effect of population on temperature — thus further tilting the scale in favor of AGW.
- The official National Weather Service station moved from Mueller Airport (near I-35) to Camp Mabry (near Texas Loop 1) in 1999. I ran the regression for 1968-2015 with a dummy variable for location, but that variable is statistically insignificant.
Here’s the regression equation for 1968-2015:
T = -0.049R + 5.57E-06P + 67.8
Where,
T = average annual temperature (degrees Fahrenheit)
R = annual precipitation (inches)
P = mid-year population (adjusted, as discussed above)
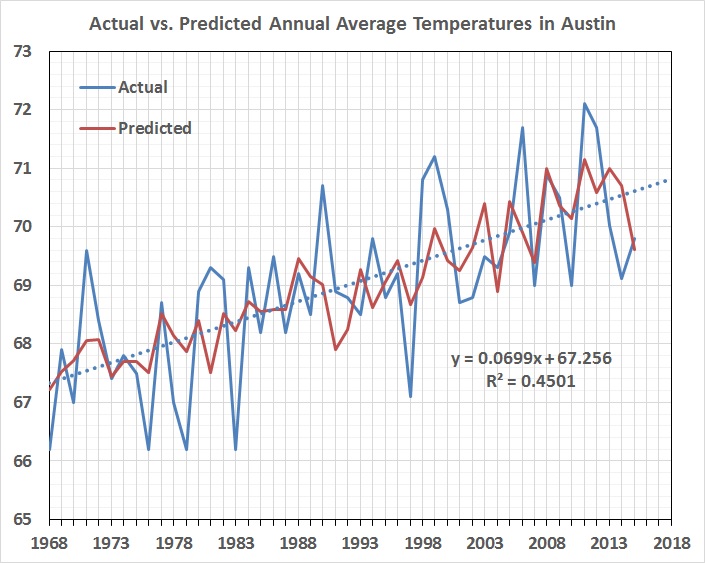
The r-squared of the equation is 0.538, which is considerably better than the r-squared for a simple time trend (see the first graph below). Also, the standard error is 1.01 degrees; F = 2.96E-08; and the p-values on the variables and intercept are highly significant at 0.00313, 2.19E-08, and 7.34E-55, respectively.
Here’s a graph of actual vs. predicted temperatures:
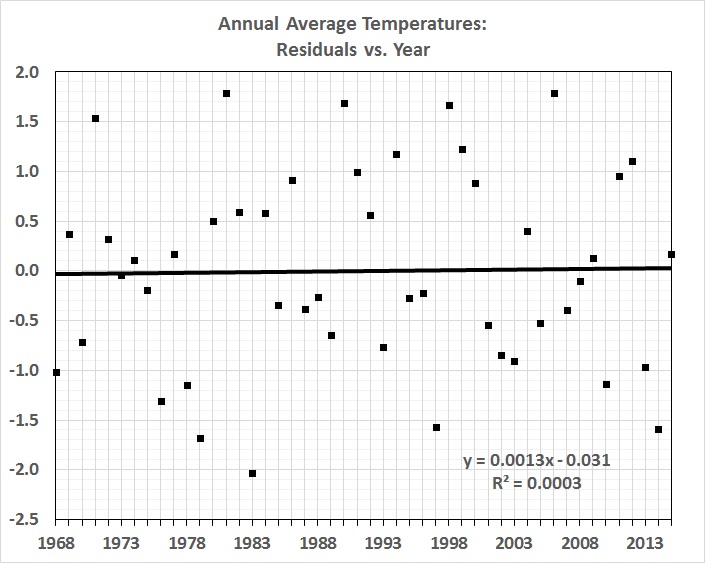
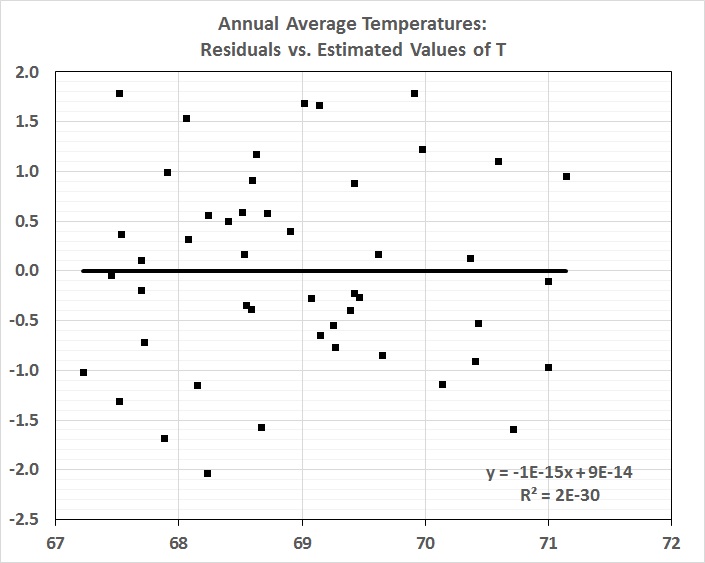
The residuals are randomly distributed with respect to time and the estimated values of T, so there’s no question (in my mind) about having omitted a significant variable:
Austin’s average annual temperature rose by 3.6 degrees F between 1968 and 2015, that is, from 66.2 degrees to 69.8 degrees. According to the regression equation, the rise in Austin’s population from 234,000 in 1968 to 853,000 (adjusted) in 2015 accounts for essentially all of the increase — 3.5 degrees of it, to be precise. That’s well within the range of urban heat-island effects for big cities, and it’s obvious that Austin became a big city between 1968 and 2015. It also agrees with the estimated effect of Austin’s population increase, as derived from the equation for North American cities in T.R. Oke’s “City Size and the Urban Heat Island.” The equation (simplified for ease of reproduction) is
T’ = 2.96 log P – 6.41
Where,
T’ = change in temperature, degrees C
P = population, holding area constant
The author reports r-squared = 0.92 and SE = 0.7 degrees C (1.26 degrees F).
The estimated UHI effect of Austin’s population growth from 1968 to 2015 is 2.99 degrees F. Given the standard error of the estimate, the estimate of 2.99 degrees isn’t significantly different from my estimate of 3.5 degrees or from the actual increase of 3.6 degrees.
I therefore dismiss the possibility that population is a proxy for the effects of CO2 emissions, which — if they significantly affect temperature (a big “if”) — do so because of their prevalence in the atmosphere, not because of their concentration in particular areas. And Austin’s hottest years occurred during the “pause” in global warming after 1998. There was no “pause” in Austin because its population continued to grow rapidly; thus:
Bottom line: Austin’s temperature can be accounted for by precipitation and population. AGW will have to find another place in which to work its evil magic.
* * *
Related reading:
U.S. climate page at WUWT
Articles about UHI at WUWT
David Evans, “There Is No Evidence,” Science Speak, June 16, 2009
Roy W. Spencer, “Global Urban Heat Island Effect Study – An Update,” WUWT, March 10, 2010
David M.W. Evans, “The Skeptic’s Case,” Science Speak, August 16, 2012
Anthony Watts, “UHI – Worse Than We Thought?,” WUWT, August 20, 2014
Christopher Monckton of Brenchley, “The Great Pause Lengthens Again,” WUWT, January 3, 2015
Anthony Watts, “Two New Papers Suggest Solar Activity Is a ‘Climate Pacemaker‘,” WUWT, January 9, 2015
John Hinderaker, “Was 2014 Really the Warmest Year Ever?,” PowerLine, January 16, 2015
Roy W. Spencer, John R. Christy, and William D. Braswell, “Version 6.0 of the UAH Temperature Dataset Released: New LT Trend = +0.11 C/decade,” DrRoySpencer.com, April 28, 2015
Bob Tisdale, “New UAH Lower Troposphere Temperature Data Show No Global Warming for More Than 18 Years,” WUWT, April 29, 2015
Patrick J. Michaels and Charles C. Knappenberger, “You Ought to Have a Look: Science Round Up—Less Warming, Little Ice Melt, Lack of Imagination,” Cato at Liberty, May 1, 2015
Mike Brakey, “151 Degrees Of Fudging…Energy Physicist Unveils NOAA’s “Massive Rewrite” Of Maine Climate History,” NoTricksZone, May 2, 2015 (see also David Archibald, “A Prediction Coming True?,” WUWT, May 4, 2015)
Christopher Monckton of Brenchley, “El Niño Has Not Yet Paused the Pause,” WUWT, May 4, 2015
Anthony J. Sadar and JoAnn Truchan, “Saul Alinsky, Climate Scientist,” American Thinker, May 4, 2015
Clyde Spencer, “Anthropogenic Global Warming and Its Causes,” WUWT, May 5, 2015
Roy W. Spencer, “Nearly 3,500 Days since Major Hurricane Strike … Despite Record CO2,” DrRoySpencer.com, May 8, 2015
Related posts:
AGW: The Death Knell (with many links to related readings and earlier posts)
Not-So-Random Thoughts (XIV) (second item)
AGW in Austin?
Understanding Probability: Pascal’s Wager and Catastrophic Global Warming
The Precautionary Principle and Pascal’s Wager
