THE ACHIEVEMENT GAP
My post, “Race and Reason: The Achievement Gap — Causes and Implications“, long predates the summer of Black Lives Matter riots and the ensuing effort to whitewash (dare I say that?) the deep-seated and insurmountable differences between blacks and other racial-ethnic groups.
A key element of that post, but by no means the only key element, is the persistent intelligence gap, which is perhaps best measured by SAT scores on math. I introduce in evidence the misnamed and misguided “Race Gaps in SAT Scores Highlight Inequality and Hinder Upward Mobility” (Brookings, February 1, 2017).
The report is misnamed and misguided because inequality and upward mobility are the result of inherent differences in intelligence, not causes of those differences. (There is, of course, a feedback mechanism at work, but it rests on lower average intelligence among blacks.) Here is the meat of the report:
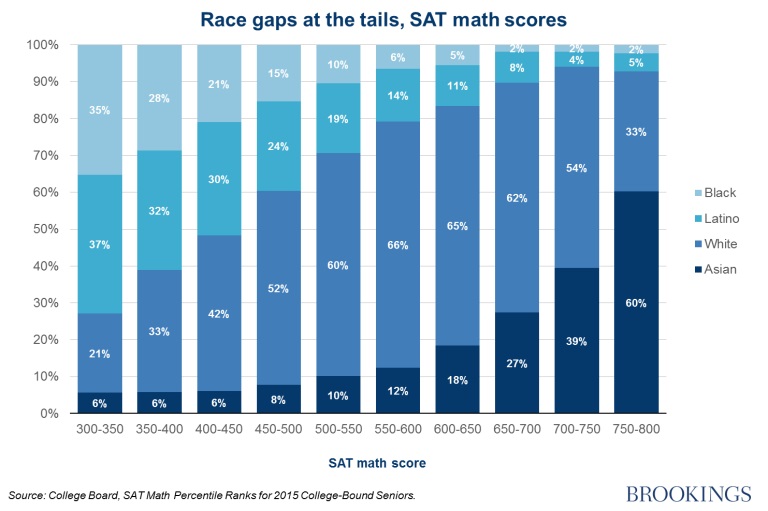
The mean score on the math section of the SAT for all test-takers is 511 out of 800, the average scores for blacks (428) and Latinos (457) are significantly below those of whites (534) and Asians (598). The scores of black and Latino students are clustered towards the bottom of the distribution, while white scores are relatively normally distributed, and Asians are clustered at the top:

Race gaps on the SATs are especially pronounced at the tails of the distribution. In a perfectly equal distribution, the racial breakdown of scores at every point in the distribution would mirror the composition of test-takers as whole i.e. 51 percent white, 21 percent Latino, 14 percent black, and 14 percent Asian. But in fact, among top scorers—those scoring between a 750 and 800—60 percent are Asian and 33 percent are white, compared to 5 percent Latino and 2 percent black. Meanwhile, among those scoring between 300 and 350, 37 percent are Latino, 35 percent are black, 21 percent are white, and 6 percent are Asian:
The College Board’s publicly available data provides data on racial composition at 50-point score intervals. We estimate that in the entire country last year at most 2,200 black and 4,900 Latino test-takers scored above a 700. In comparison, roughly 48,000 whites and 52,800 Asians scored that high. The same absolute disparity persists among the highest scorers: 16,000 whites and 29,570 Asians scored above a 750, compared to only at most 1,000 blacks and 2,400 Latinos. (These estimates—which rely on conservative assumptions that maximize the number of high-scoring black students, are consistent with an older estimate from a 2005 paper in the Journal of Blacks in Higher Education, which found that only 244 black students scored above a 750 on the math section of the SAT.) …
Disappointingly, the black-white achievement gap in SAT math scores has remained virtually unchanged over the last fifteen years. Between 1996 and 2015, the average gap between the mean black score and the mean white score has been .92 standard deviations. In 1996 it was .9 standard deviations and in 2015 it was .88 standard deviations. This means that over the last fifteen years, roughly 64 percent of all test-takers scored between the average black and average white score.
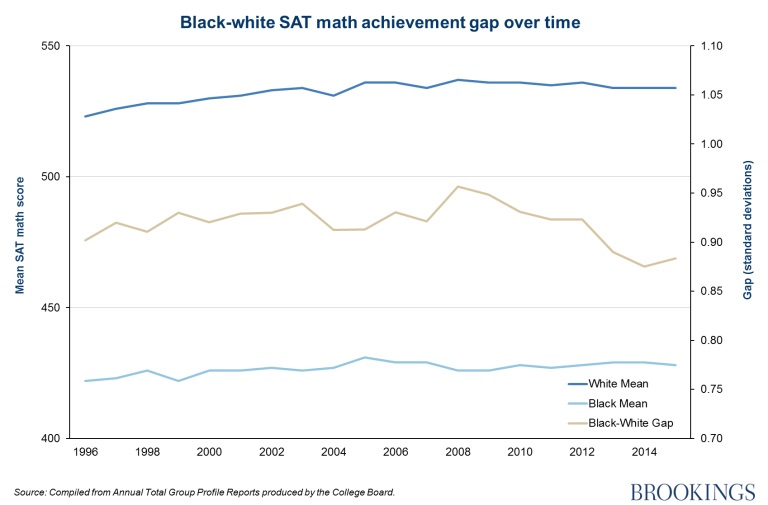
Note that the black-white gap shown in the third figure is inconsistent with the difference between the white and black means. The gap doesn’t shrink in the 2010s. Note also the following observations by the authors of the report:
The ceiling on the SAT score may … understate Asian achievement. If the exam was redesigned to increase score variance (add harder and easier questions than it currently has), the achievement gap across racial groups could be even more pronounced.
A standardized test with a wider range of scores, the LSAT, offers some evidence on this front. An analysis of the 2013-2014 LSAT finds an average black score of 142 compared to an average white score of 153. This amounts to a black-white achievement gap of 1.06 standard deviations, even higher than that on the SAT….
[T]here is a possibility that the SAT is racially biased, in which case the observed racial gap in test scores may overstate the underlying academic achievement gap. But most of the concerns about bias relate to the verbal section of the SAT, and our analysis focuses exclusively on the math section….
Finally, [these] data [are] limited in that [they] doesn’t allow us to disentangle race and class as drivers of achievement gaps. It is likely that at least some of these racial inequalities can be explained by different income levels across race….
However, a 2015 research paper from the Center for Studies in Higher Education at the University of California, Berkeley shows that between 1994 and 2011, race has grown more important than class in predicting SAT scores for UC applicants. While it is difficult to extrapolate from such findings to the broader population of SAT test-takers, it is unlikely that the racial achievement gap can be explained away by class differences across race.
In fact, my post includes hard evidence (from earlier data) that the race gaps persist across income levels. That is, blacks are less intelligent on average than whites (and others) in the same income bracket.
The evidence notwithstanding (because it is ignored and twisted), the current dogmas (critical race theory, or CRT; diversity, equity, and inclusion or DEI) insist that white culture — including the tenet of racial equality under the law and the importance of dispassionate, scientific inquiry— must be rejected because it is all tainted with racism. Rejection means the suppression of whites and white culture so that blacks may reach their true potential.
The true potential of blacks is determined by their intelligence and their culture. Blacks, on average, are less intelligent than whites, and black culture (in America) fosters violence, disdain for education, and family dysfunction to a greater degree than is true for whites, on average. (But that, somehow, is whitey’s fault.)
Where will this lead? Right where Dov Fischer predicts it will lead:
[T]he same disadvantaged groups who today rely on blaming instead of self-help will then be at the same exact rung on the social order that they are today, just as 50 years of racism-free society and Great Society “entitlements” have not accomplished equality of results today, even as newcomers from Asia entered this country these past 50 and 60 years and leap-frogged those already here.
Blacks, on the whole, are not where they are because of whitey, but because of their genes and culture. But whites (and East Asians) will nevertheless be burdened and suppressed for the sake of “equity”.
THE PARALLEL IN THE MIDDLE EAST
A parallel to the racism of CRT and DEI is that Israel is the aggressor, and that Palestinians are victims. They are “obviously” (to a leftist) victims of Israel because they live (mostly) in territories that were or are controlled by Israel: the Gaza Strip and the West Bank. There is also Israel’s controversial nation-state law, which according to an anti-Zionist source
declare[s] that only Jews have the right of self-determination in the country, something members of the Arab minority called racist and verging on apartheid.
The “nation-state” law, backed by the right-wing government, passed by a vote of 62-55 and two abstentions in the 120-member parliament after months of political argument. Some Arab lawmakers shouted and ripped up papers after the vote.
“This is a defining moment in the annals of Zionism and the history of the state of Israel,” Prime Minister Benjamin Netanyahu told the Knesset after the vote.
Largely symbolic [not observed in practice], the law was enacted just after the 70th anniversary of the birth of the state of Israel. It stipulates that “Israel is the historic homeland of the Jewish people and they have an exclusive right to national self-determination in it.”
The usual suspects have declared that the separation of Palestinians (and other Arabs) from Israel and from its governance amount to apartheid., a crime against “international (leftist) law”. From this it follows (to a leftist) that acts of savagery — like those committed by Hamas against Israelis on October 7, 2023 — are justified because Palestinians are victims It further follows (to a leftist) that Israel’s fully justified prophylactic retaliation is aggression.
Let’s examine those premises.
It’s true enough that the denizens of Gaza are poor and feckless. But what makes them victims? They are about on a par with most non-Jewish Semites, except for the relative handful who are members of a professional caste or oil-rich. The basic problem with most such members of humanity —whether in the Middle East or elsewhere — isn’t that they have been put down by anyone (e.g., Israelis) but that they lack the intellectual and cultural resources to raise themselves up.
A “funny” thing about Israel is that it is of a piece with the surrounding lands occupied by non-Jews, but it has become a relatively prosperous place because Jews have the intellectual and cultural resources that undergird prosperity.
For their success and for the fact that they are Jews, the Jews of Israel are the targets of envious failures (Palestinian and Muslim hot-heads), Jew-haters (in addition to the hot-heads), and leftists who can’t bear to think that Palestinians (like American blacks) mainly have their genes and culture to blame for their failings.
Israel was founded (re-founded, really) in the wake of the Holocaust. It wasn’t meant to be anything but a Jewish state, run by Jews for Jews — a safe haven for a historically oppressed and brutalized people. Israel has been under attack by Muslims since its modern founding. But Israel has a natural right to self-defense and to preserve its Jewish character, just as the American rebels of 1776 had a natural right to declare themselves independent of a despotic King and rapacious Parliament.
So, the Gaza Strip and the West Bank became de jure parts of Israel (though the Gaza Strip was foolishly handed over to anti-Israelis) as a matter of the natural right of self-defense. As for Palestinians living in Israel proper, why should they have a voice in the governance of a country that was re-founded for Jews? Well, despite the nation-state law cited above, they do have a voice in the governance of Israel.
So, all of the leftist propaganda to the contrary notwithstanding, Palestinians aren’t victims, except of their own genes and culture. But unlike the “liberals” of old, the left nowadays focuses on demonizing the meritorious instead of helping those who need help.
Finally, there is the accusation that Israelis are sometimes brutal in their own defense. Why shouldn’t they be? It’s impossible to defend a country against determined enemies without being brutal toward them — just as it’s impossible to protect law-abiding citizens by disarming them and depriving them of police protection. The left sees Israelis as brutal because the left despises Israeli Jews, not because Israelis are any more brutal than leftists like Hitler, Stalin, Mao, and their many successors unto the present day.
Coda: There was a time when most Americans recognized the need for superior force as a bulwark of the defense of America. It is a sad commentary on the state of America that a sizable and influential segment of the populace no longer believes that America is worth defending tooth and nail. (Just look at the response to the rise of China, our trading “partner”.)
Those pampered idiots believe that it is necessary for America to be taken down a peg or two, and that it is wrong for America (but not other nations) to excel. As beneficiaries of American exceptionalism, they are able to spout such nonsense and to tear down the very laws and traditions that shelter them from the wrath of the rightfully aggrieved victims of their beliefs and policies: hard-working, tax-paying, law-abiding victims of unfettered illegal immigration, unnecessary Covid lockdowns, prosperity-draining regulations and regulatory agencies, unnecessarily high energy costs because of the climate-change hoax, etc., etc., etc.