It’s bad. How bad? Here is the newly updated Part VI of “Economic Growth Since World War II“.
The real unemployment rate is several percentage points above the nominal rate. Officially, the unemployment rate stood at 6.1 percent as of April 2021. Unofficially — but in reality — the unemployment rate was 13.8 percent.
How can I say that the real unemployment rate was 13.8 percent, even though the official rate was 6.1 percent? Easily. Just follow this trail of definitions, provided by the official purveyor of unemployment statistics, the Bureau of Labor Statistics:
Unemployed persons (Current Population Survey)
Persons aged 16 years and older who had no employment during the reference week, were available for work, except for temporary illness, and had made specific efforts to find employment sometime during the 4-week period ending with the reference week. Persons who were waiting to be recalled to a job from which they had been laid off need not have been looking for work to be classified as unemployed.Unemployment rate
The unemployment rate represents the number unemployed as a percent of the labor force.Labor force (Current Population Survey)
The labor force includes all persons classified as employed or unemployed in accordance with the definitions contained in this glossary.Labor force participation rate
The labor force as a percent of the civilian noninstitutional population.Civilian noninstitutional population (Current Population Survey)
Included are persons 16 years of age and older residing in the 50 States and the District of Columbia who are not inmates of institutions (for example, penal and mental facilities, homes for the aged), and who are not on active duty in the Armed Forces.
In short, if you are 16 years of age and older, not confined to an institution or on active duty in the armed forces, but have not recently made specific efforts to find employment, you are not (officially) a member of the labor force. And if you are not (officially) a member of the labor force because you have given up looking for work, you are not (officially) unemployed — according to the BLS. Of course, you are really unemployed, but your unemployment is well disguised by the BLS’s contorted definition of unemployment.
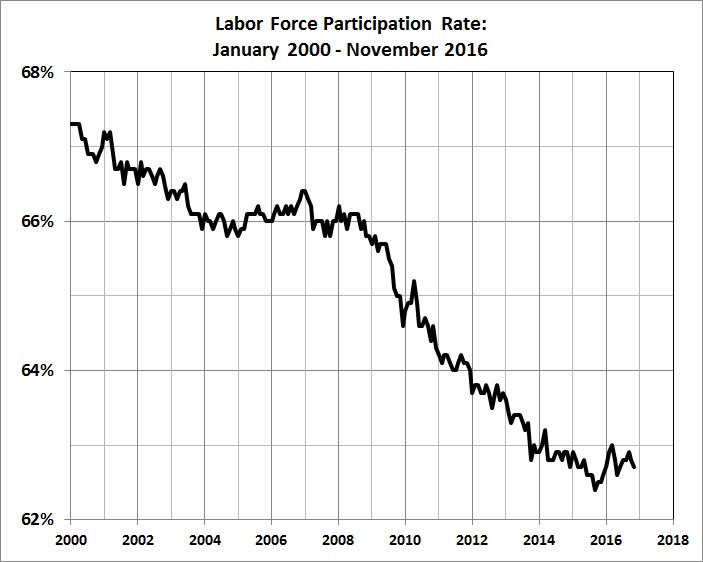
What has happened is this: Since the first four months of 2000, when the labor-force participation rate peaked at 67.3 percent, it declined to 62.3 percent in 2015 before rising to 63.4 percent just before the pandemic wreaked havoc on the economy. Then, the participation rate dropped to 60.2 percent before recovering to 61.7 percent in April 2021:
FIGURE 9

Source: See figure 10.
The decline that began in 2000 came to a halt in 2005, but resumed in late 2008. The economic slowdown in 2001 (which followed the bursting of the dot-com bubble) can account for the decline through 2005, as workers chose to withdraw from the labor force when faced with dimmer employment prospects. But what about the sharper decline that began near the end of Bush’s second term?
There we see not only the demoralizing effects of the Great Recession but also the growing allure of incentives to refrain from work, namely, disability payments, extended unemployment benefits, the relaxation of welfare rules, the aggressive distribution of food stamps, and “free” healthcare” for an expanded Medicaid enrollment base and 20-somethings who live in their parents’ basements*. That’s on the supply side. On the demand side, there are the phony and even negative effects of “stimulus” spending; the chilling effects of regime uncertainty, persisted beyond the official end of the Great Recession; and the expansion of government spending and regulation (e.g., Dodd-Frank), as discussed in Part III.
More recently, COVID caused many workers to withdraw from the labor force out of an abundance of caution or because they couldn’t work from home. The recovery has stalled, in large part because of “free” money and extended unemployment benefits. The effects are being felt by employers who are unable to fill job openings, thus refueling a resurgence of inflation.
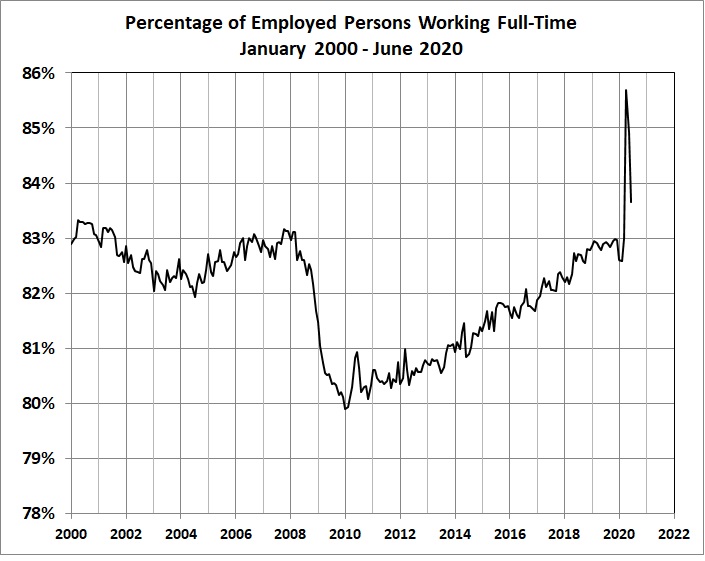
Another factor, though of less significance, is a decline in the percentage of employed persons who are working full-time. It dropped from 83.3 percent in 2000 — its highest level since 1989 — to 79.9 percent in 2010 before rising jaggedly to 83.5 percent in April 2021. A shift from full-time to part-time work is really a form of disemployment, and ought to be reflected in the unemployment rate.
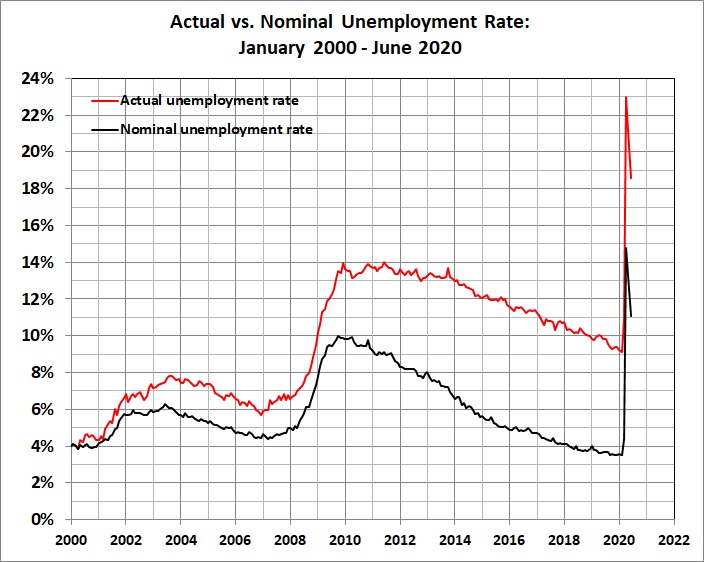
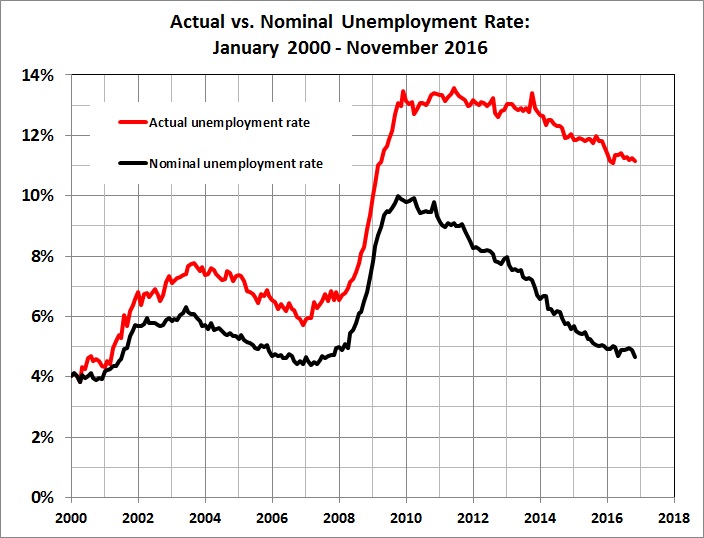
I constructed the actual unemployment rate by adjusting the nominal rate for (a) the change in the labor-force participation rate and (b) the change in the percentage of workers in full-time status. The disparity between the actual and nominal unemployment rates is evident in this graph:
FIGURE 10
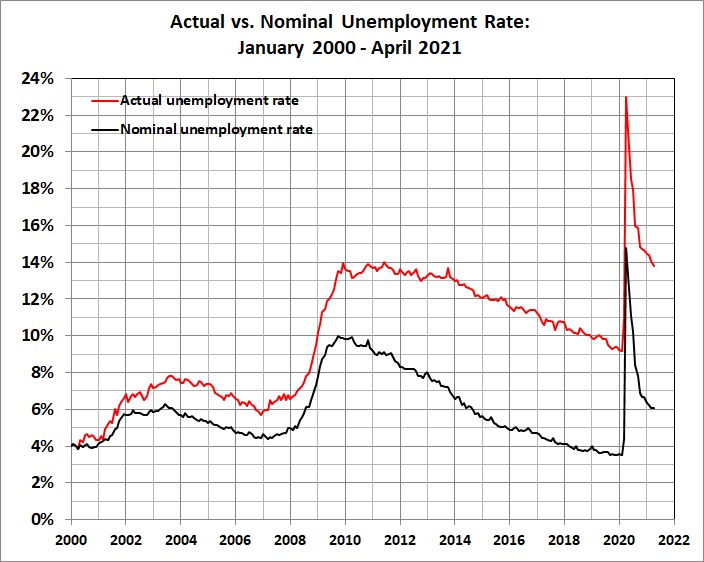
Derived from SeriesLNS12000000, Seasonally Adjusted Employment Level; SeriesLNS11000000, Seasonally Adjusted Civilian Labor Force Level; Series LNS11300000, Seasonally Adjusted Civilian labor force participation rate; and Series LNS12500000, Employed, Usually Work Full Time. All are available at BLS, Labor Force Statistics from the Current Population Survey.
The bad news — which the stock market has chosen to ignore (as of 05/07/2 1) — is that the real unemployment rate is where it was in the darkest days of the Great Recession.
_________
* Contrary to some speculation, the labor-force participation rate is not declining because older workers are retiring earlier. The participation rate among workers 55 and older rose between 2002 and 2012. The decline is concentrated among workers under the age of 55, and especially workers in the 16-24 age bracket. (See this table at BLS.gov.) Why? My conjecture: The Great Recession caused a shakeout of marginal (low-skill) workers, many of whom simply dropped out of the labor market. And it became easier for them to drop out because, under Obamacare, many of them became eligible for Medicaid and many others enjoy prolonged coverage (until age 26) under their parents’ health plans. For more on this point, see Salim Furth’s “In the Obama Economy, a Decline in Teen Workers” (The Daily Signal, April 11, 2015), and Stephen Moore’s “Why Are So Many Employers Unable to Fill Jobs?” (The Daily Signal, April 6, 2015). On the general issue of declining participation among males aged 25-54, see Timothy Taylor’s “Why Are Men Detaching from the Labor Force?“, (The Conversible Economist, January 16, 2020), and follow the links therein. See also Scott Winship’s “Declining Prime-Age Male Labor Force Participation” (The Bridge, Mercatus Center, September 26, 2017).