In my previous post I contrasted the results of polling by Rasmussen Reports with two indicators published by RealClearPolitics: its the “poll of polls” and its summary of election betting markets. Although Rasmussen’s numbers (as of September 30) look bad for Trump, they’re not as bad as the numbers produced by most polls and betting markets.
Why is that? Rasmussen’s polls yield better — more accurate — results than most other polls because Rasmussen’s polls are unbiased. It’s not surprising, therefore, that Rasmussen has an excellent track record. Many pollsters and pundits try to dismiss Rasmussen as pro-Republican, or to denigrate Rasmussen’s methods. This is a classic example of psychological projection because most polls are systematically biased toward Democrats.
There are two reasons for that. Pro-Democrat pollsters (and their media allies) don’t like to publish bad news about Democrats. By the same token, underestimating the electoral prospects of Republicans is a devious form of election-rigging: It helps to demoralize Republican voters and therefore reduce pro-Republican turnout at election time.
How biased are the other polls? On average, extremely biased. The following graph shows the relationship between Rasmussen’s polling on the 2020 presidential election and the average of the dozen-or-so polls tracked by RealClearPolitics:
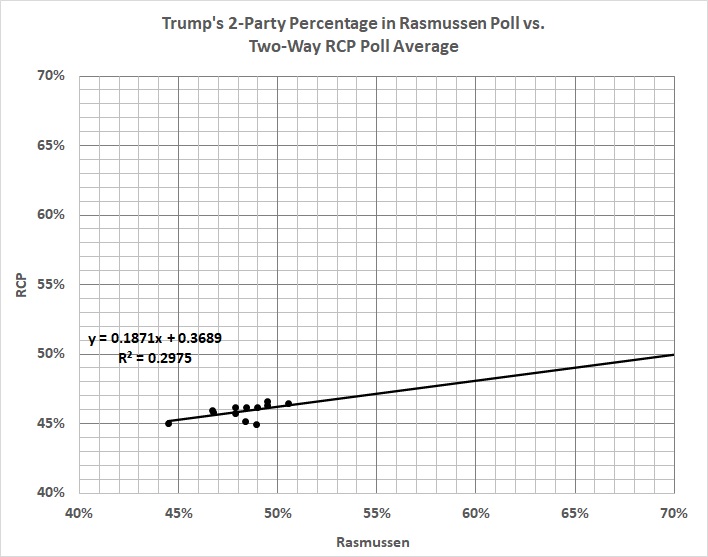
If I had removed Rasmussen’s poll from RCP’s average, the result would have been more stark, but it’s stark enough as it is. Rasmussen’s (presumably) accurate poll (White House Watch) would have to show Trump leading Biden with 70 percent of likely voters before the RCP average would show Trump tied with Biden.
The moral of the story: I won’t cite the RCP “poll of polls” again.
I will however cite RCP’s summary of betting markets. They don’t estimate the split of the popular vote, but they do measure the degree of confidence that one or another candidate will win. Unfortunately, there is growing confidence on the part of bettors that Biden will win.
I will close with a reminder of what’s at stake in this election: liberty.