Why did Biden decide to debate Trump? Most likely because Biden and those whose advice he takes (or whose direction he follows) believed that he would lose the election and had nothing to lose by debating Trump.
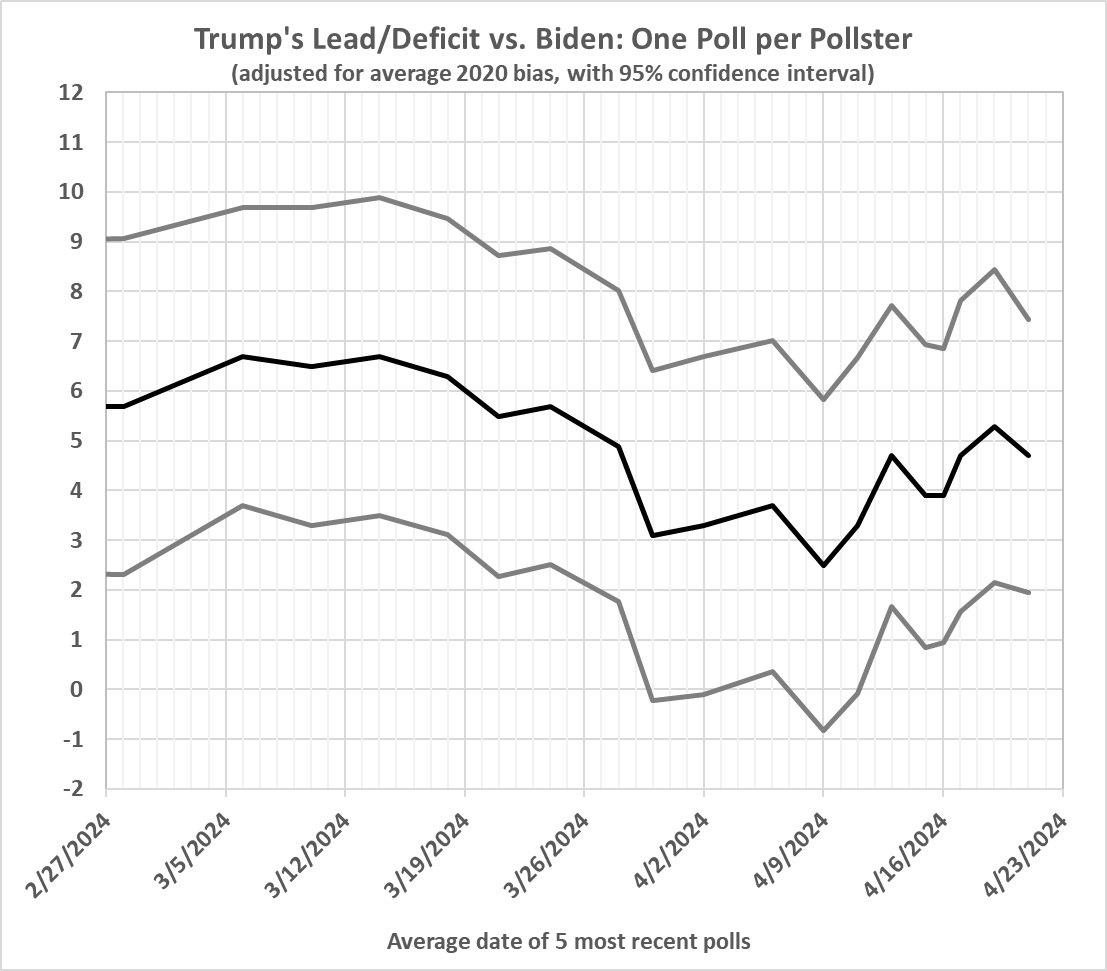
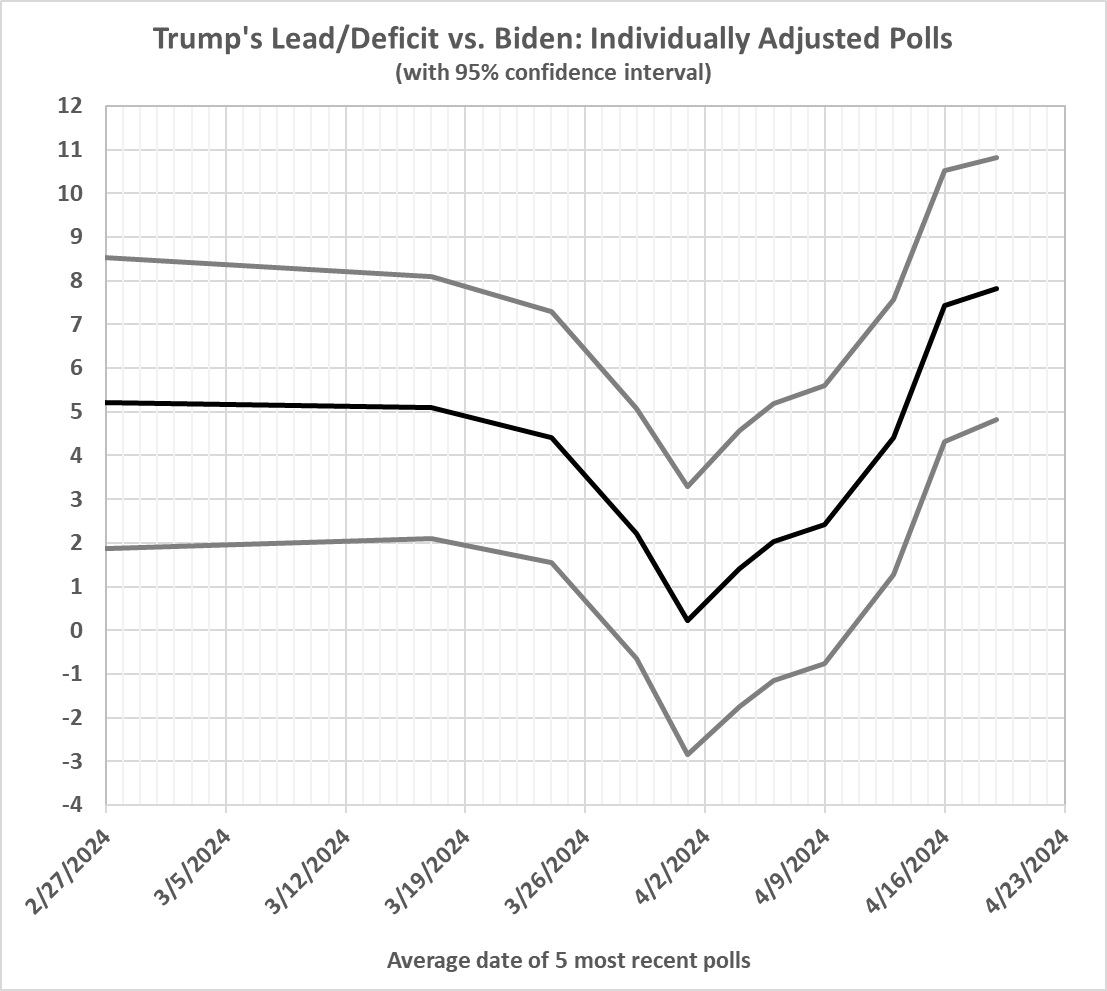
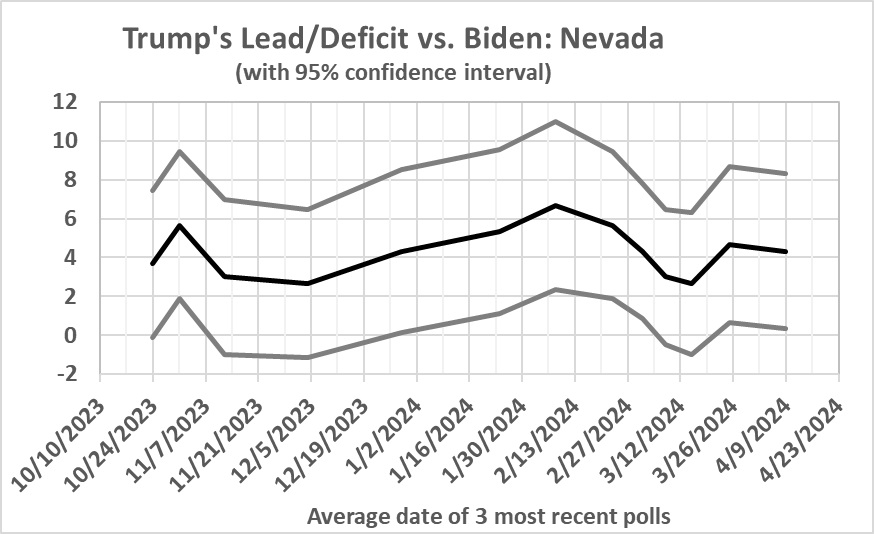
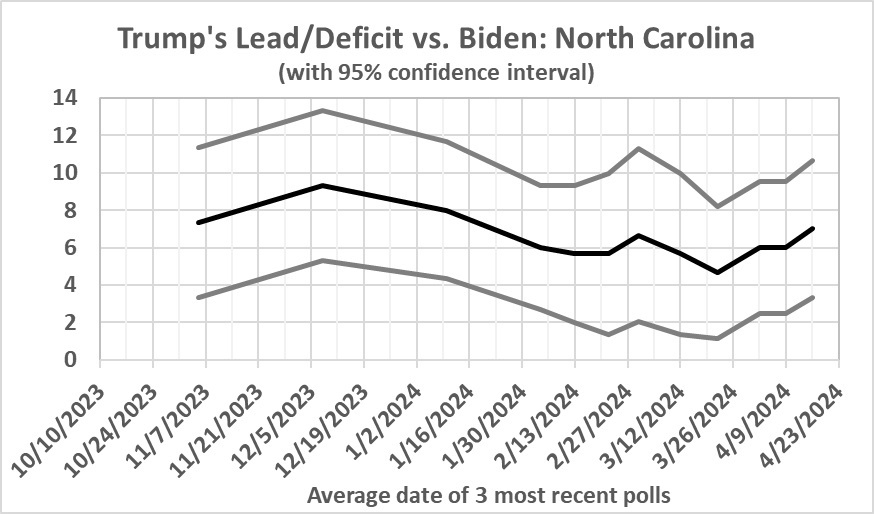
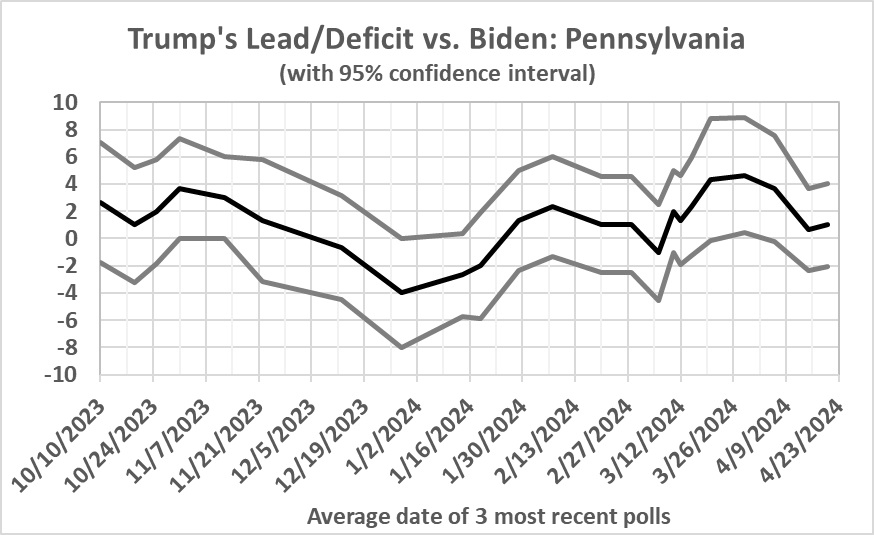
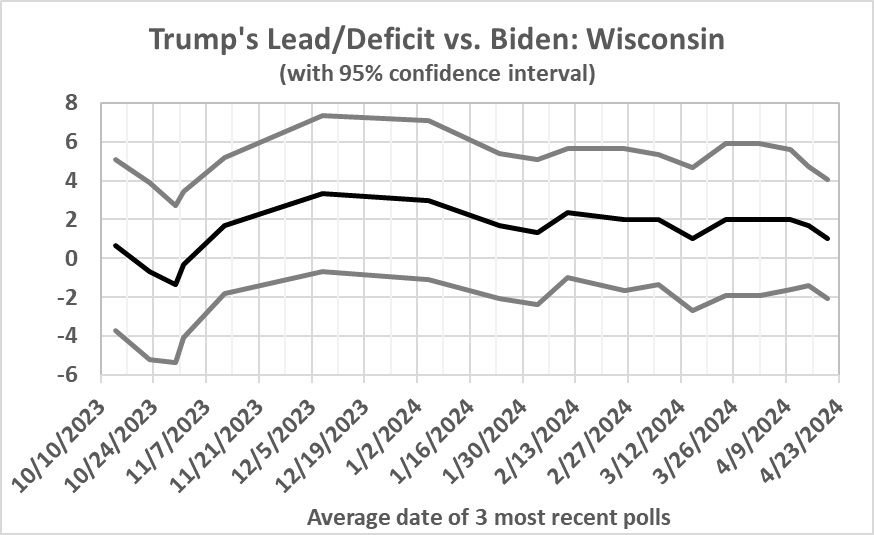
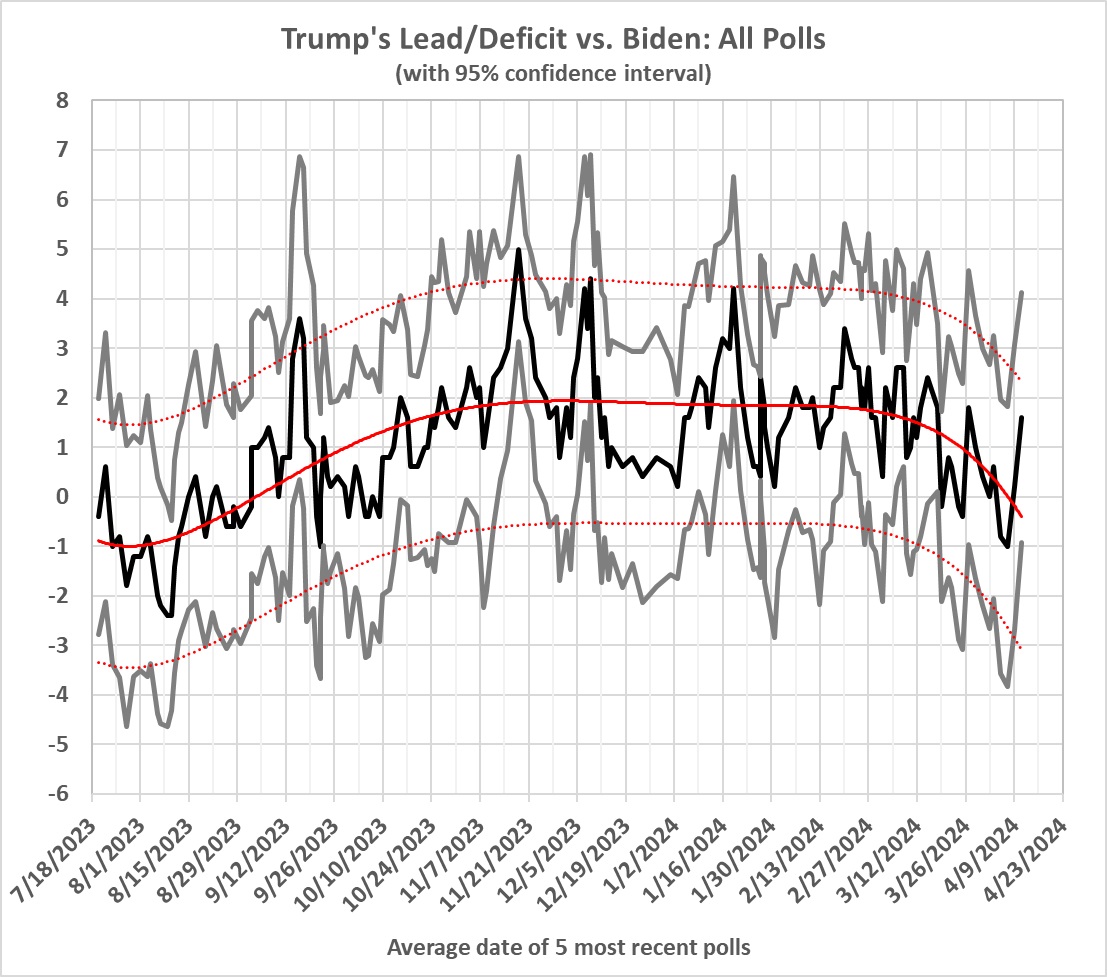
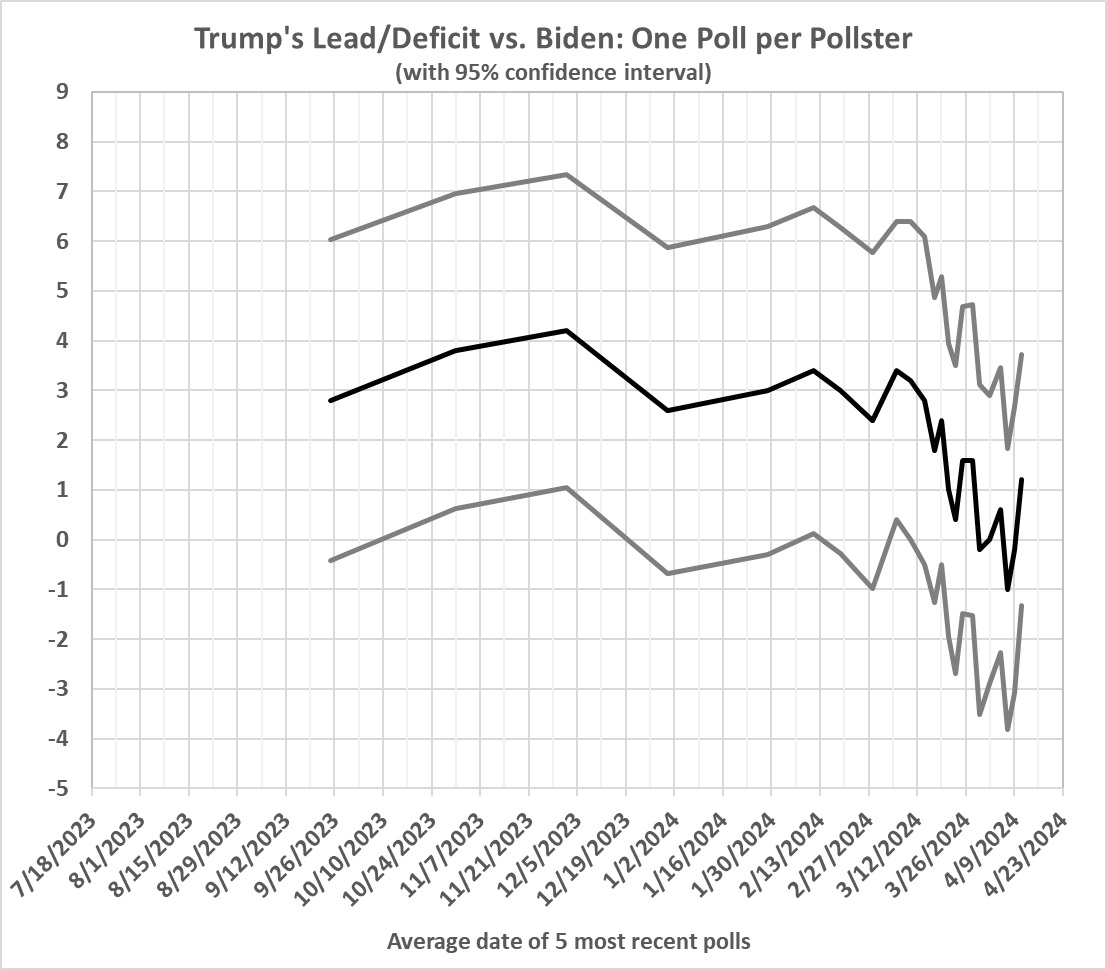
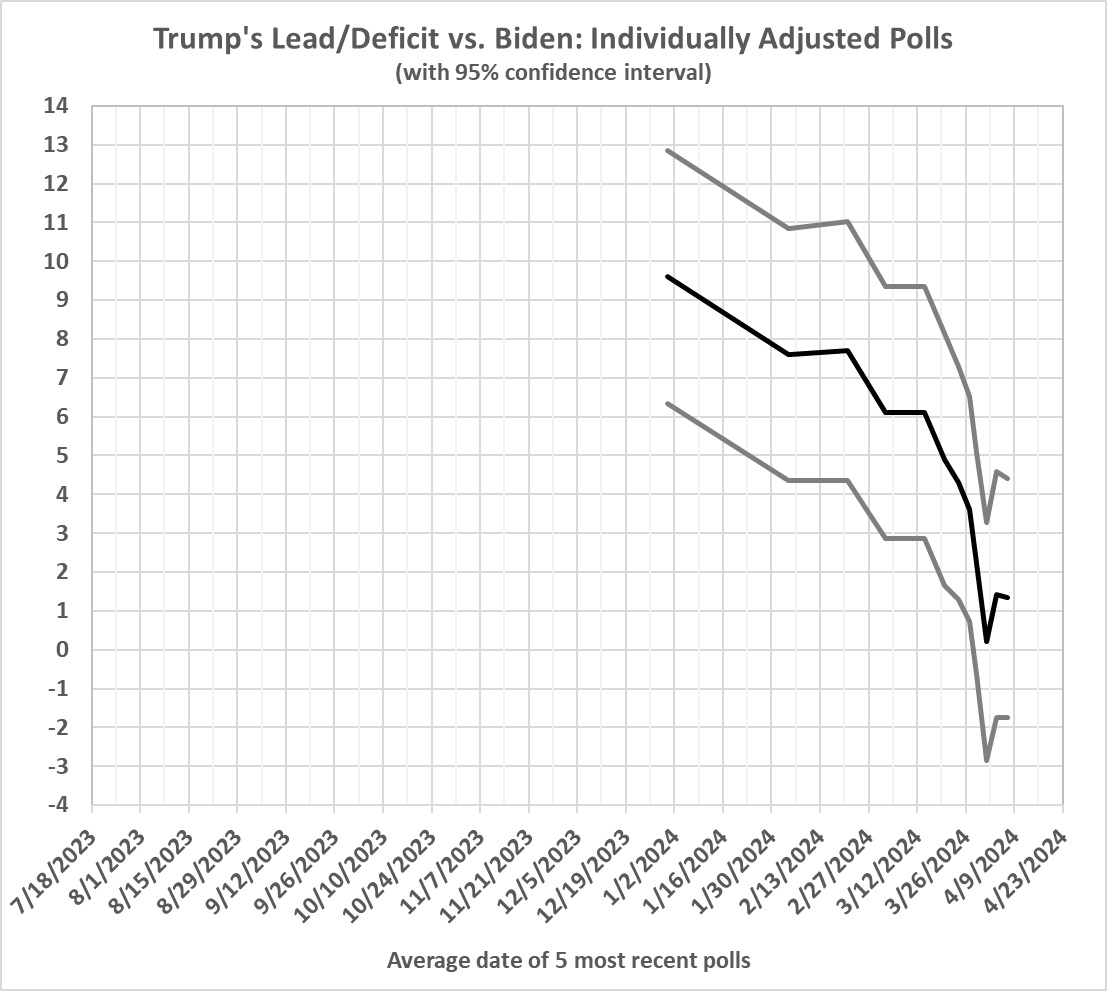
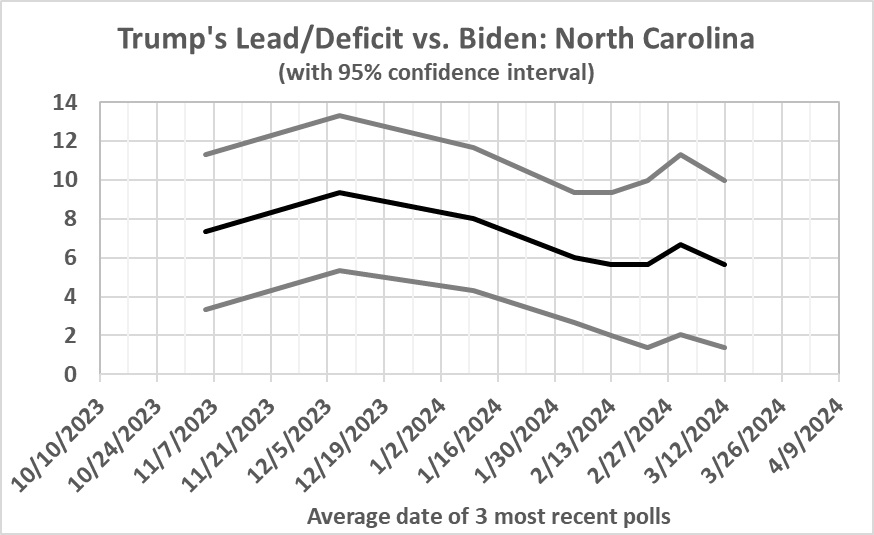
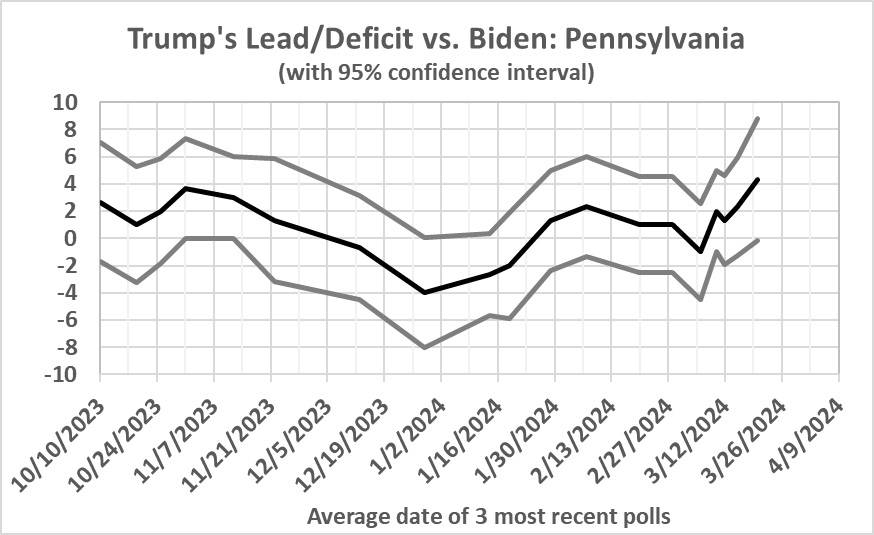
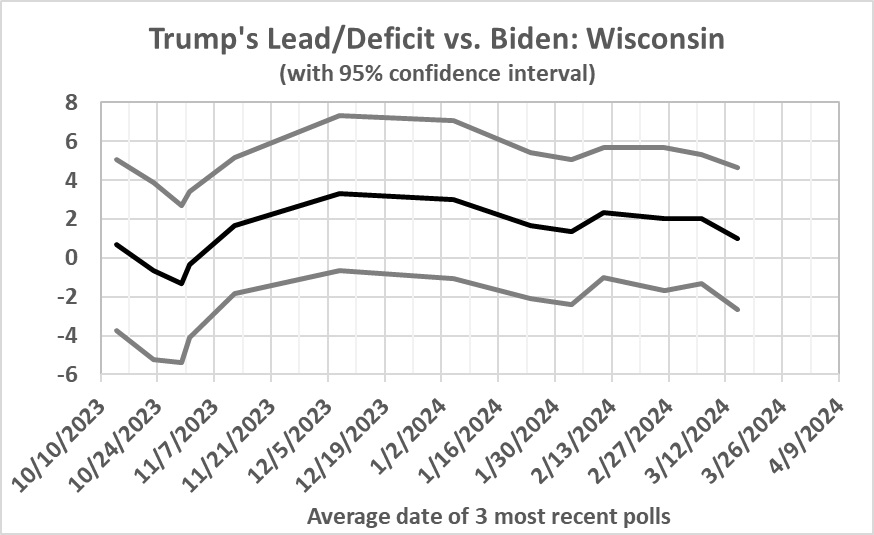
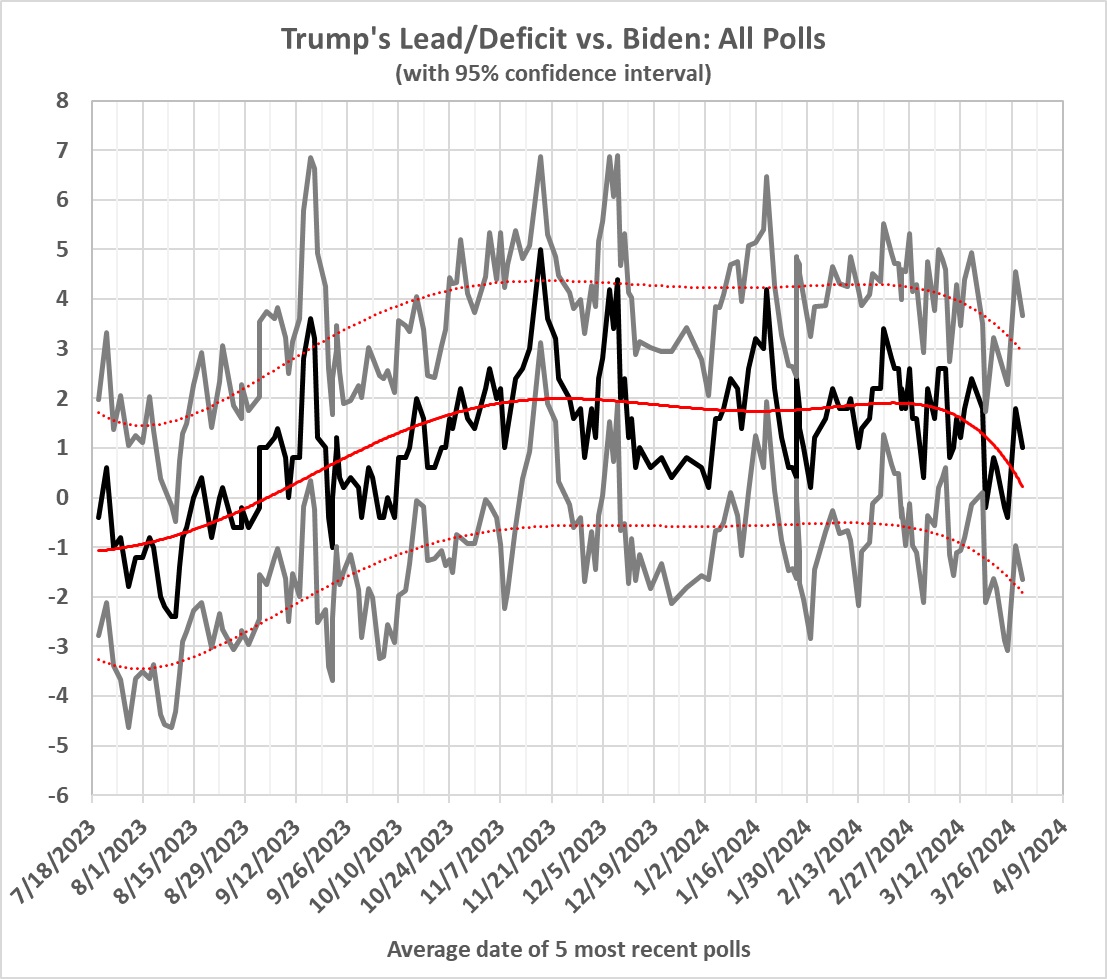
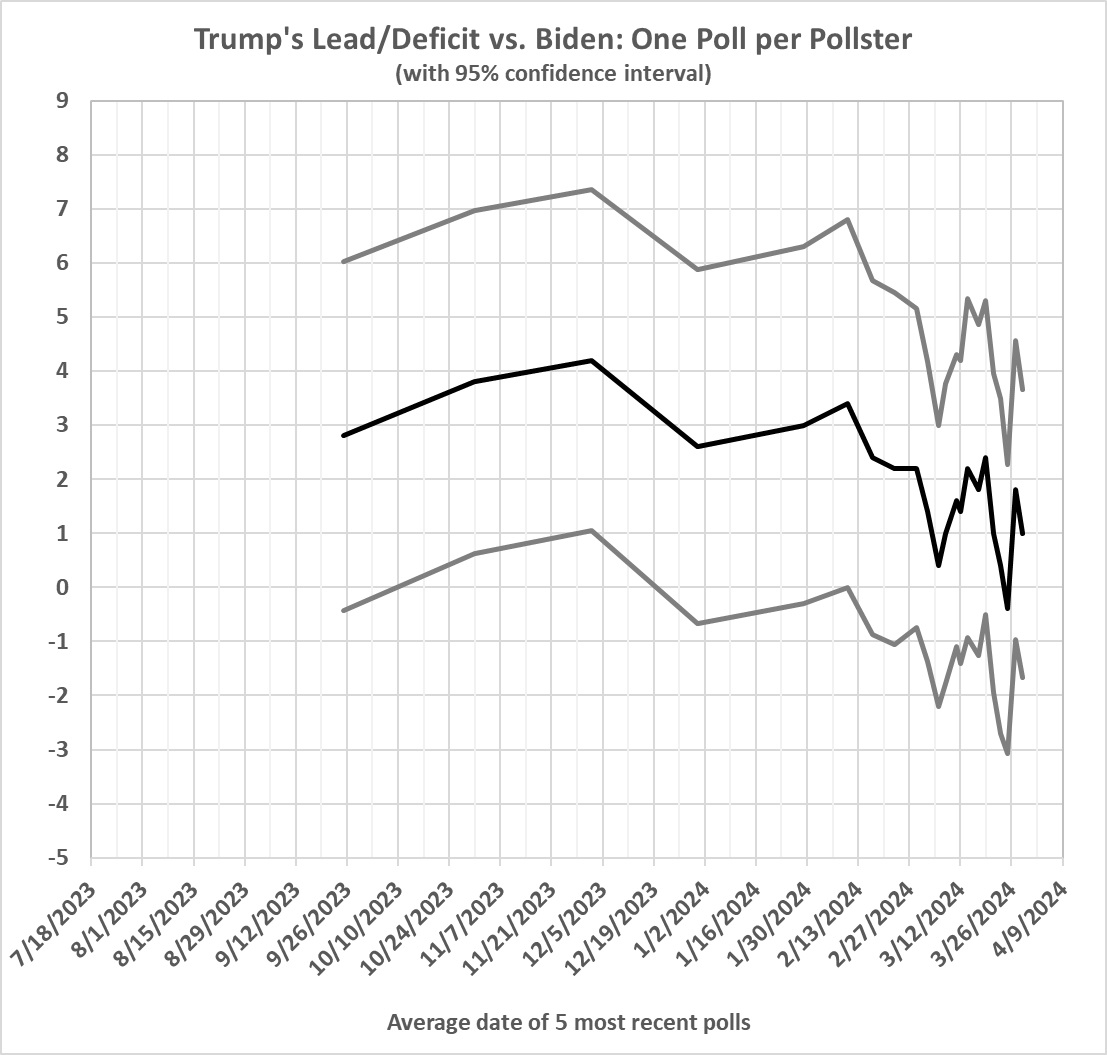
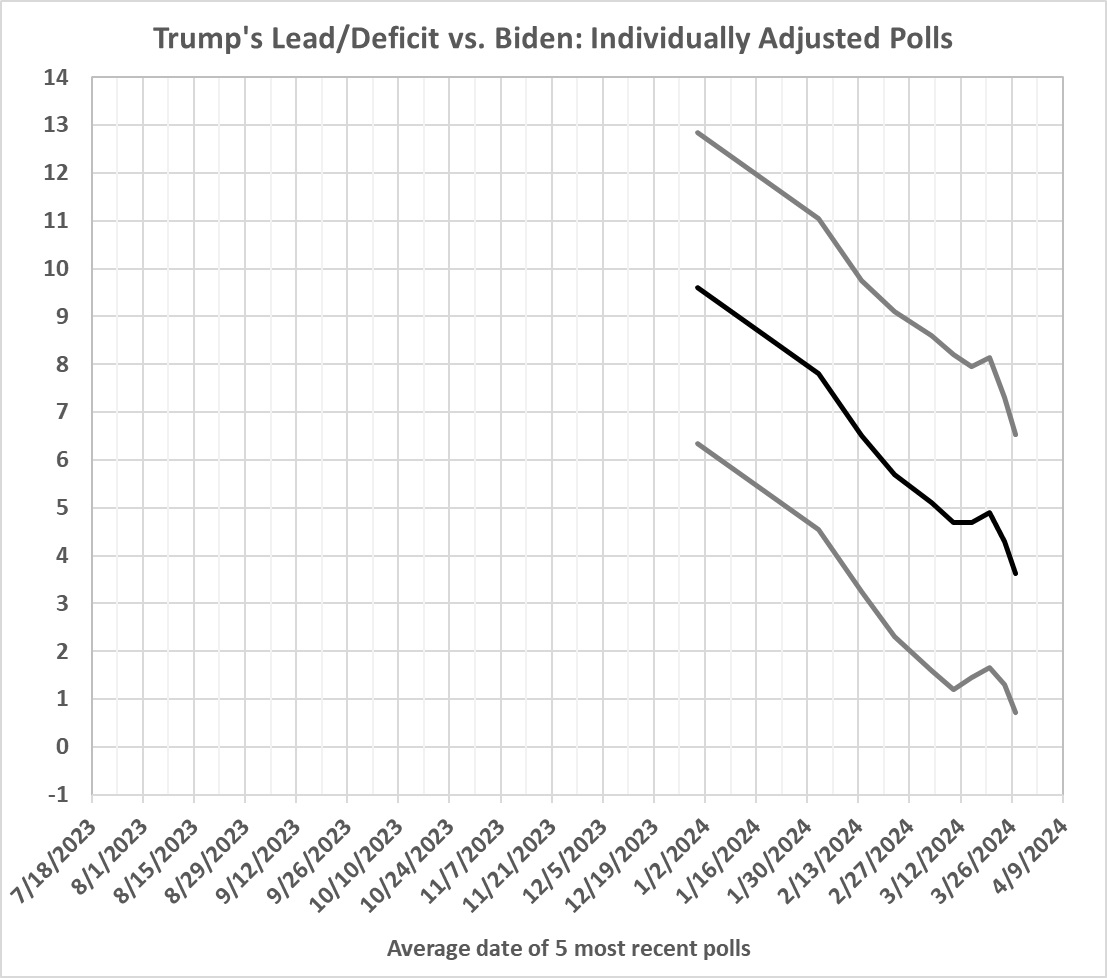
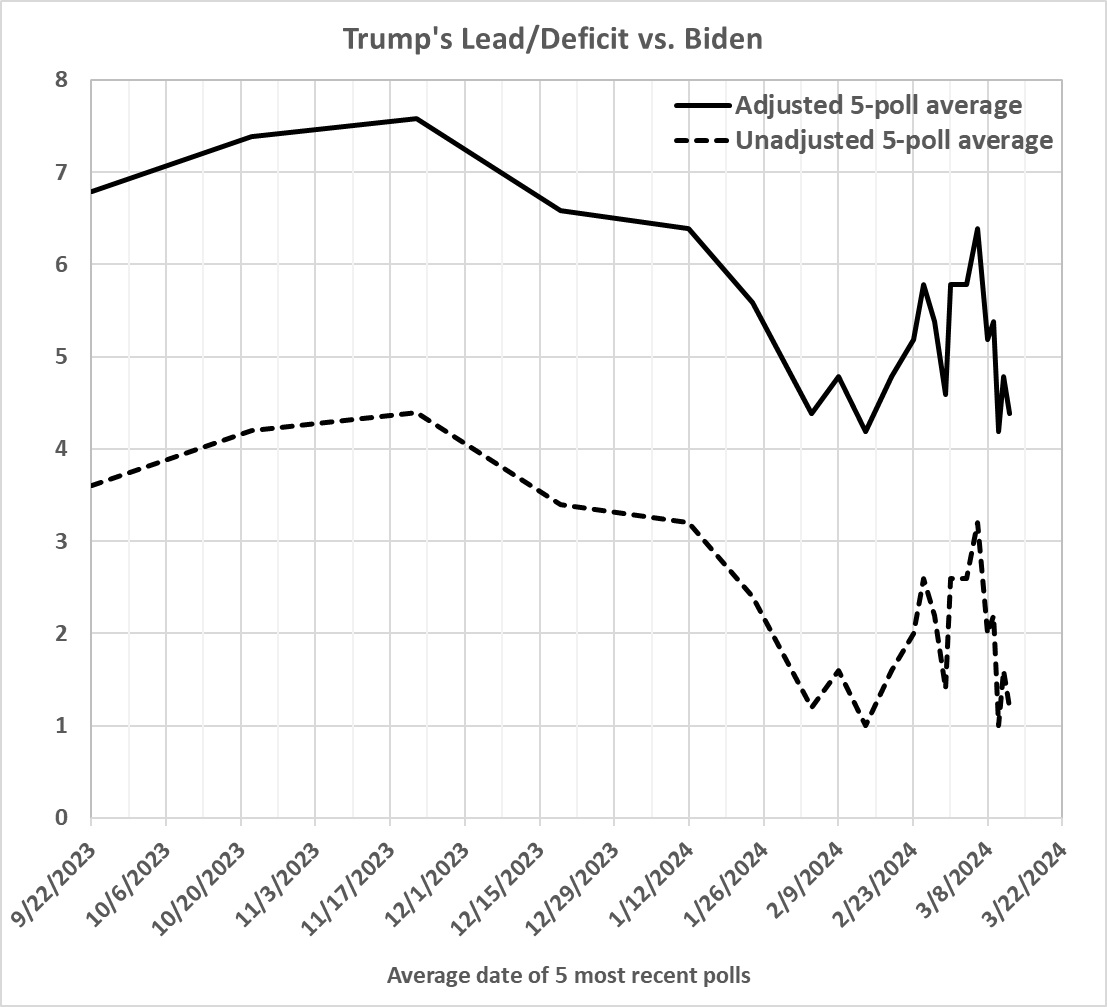
Why would Biden or his advisers believe that he would lose when nationwide polls have put him in a virtual tie with Trump? Because they have done something like the analysis that I’ve done, which suggests a virtual tie in the polls means that Biden is actually running at least 3 percentage points behind Trump nationwide. That deficit portends spells certain defeat given that Biden would run up huge, superfluous margins in deep-Blue states.
In rehearsing for the debate, Biden’s performance must have seemed at least passable. If it hadn’t, a plausible excuse for postponement or cancellation would have been found, and it would have done less damage to Biden’s chances than his actual performance did. But the rehearsals, which included a stand-in for Trump, weren’t the real thing.
Biden’s performance in the actual debate must have come as a shock to himself, to Jill, to those who advised him to debate, and to those who helped him prepare for the debate. Biden’s performance certainly came as huge shock to the millions who planned to vote for him and who saw the real person in action, not the mummy whose condition has been hidden (as much as possible) from public view by aides and compliant corporate media.
Now what? Top Democrats (the Clintons, Obama, major donors, etc.) may have concluded that Trump will win no matter whom he faces. If they have concluded that, they are almost certainly right — barring a shockingly adverse development for Trump between now and when voting starts.
For example, they may be betting that Judge Merchan (of the “hush money” case) will announce a prison sentence or house arrest when he sentences Trump on July 11. First, any sentence will be anti-climactic — voters have long since factored the guilty verdicts into their voting plans. Second, Trump can appeal, and failure at the State level is almost certain to result in a speedy hearing and decision by the U.S. Supreme Court. Third, will any court (other than Judge Merchan’s) want to legitimize DA Bragg’s blatant act of election interference: the prosecution of Trump on charges with a flimsy legal foundation? I think not. Fourth, in any event, a sentence of some kind for Trump might be just the trigger that’s needed to evoke a tidal wave of GOP voters in the fall, swamping not only Biden but Democrats down the ticket — including, more importantly, races for U.S. Senate and House seats.
Given all of that, why would the Democrats in charge want to replace Biden? The result would be to burden a new candidate with a loss, when he or she could run in 2028 as a “fresh face” who hasn’t lost a presidential race.
So, barring a development that I can’t foresee (which might include death or a crippling disability), I expect to see Trump and Biden at the head of their parties’ tickets in November. If Biden isn’t the Democrat nominee, the nod will go to the equally expendable Kamala.