The bottom line of this post is an an assessment of the prospects for Trump’s re-election, which have declined markedly since coronavirus began to do real damage to the economy.
To reach that assessment, I review Trump’s poll numbers and the economic outlook as reflected in the stock market. I derive the poll numbers from a reliable source: Rasmussen Reports:
Polling
Trump’s approval ratings have dropped steadily in the past 8 weeks:
FIGURE 1

Derived from Rasmussen Reports approval ratings for Trump.
Trump’s standing, relative to Obama’s, has slipped considerably:
FIGURE 2

Derived from Rasmussen Reports approval ratings for Obama and Trump.
Trump’s slippage is also obvious in a straightforward comparison of strong-approval ratings, averaged over 7 days. It is now almost as low as Obama’s was at this stage 8 years ago, when Obama’s was holding steady before a sharp pre-election rise:
FIGURE 3
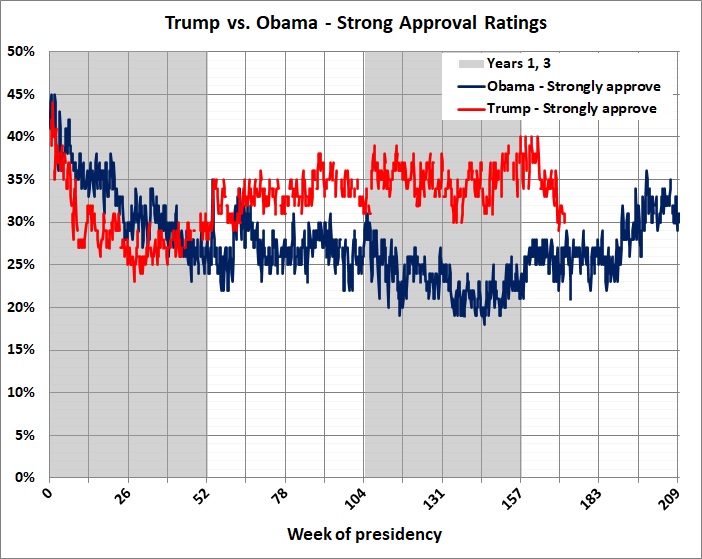
Source: Same as figure 2.
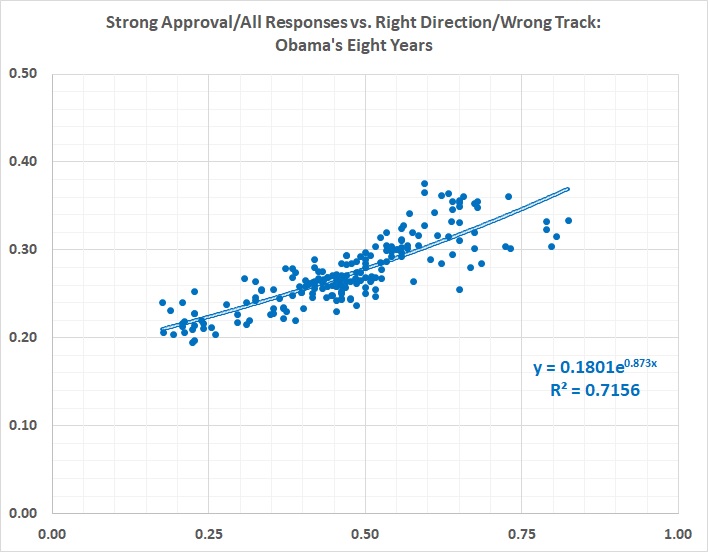
I also compute an enthusiasm ratio, which is the 7-day average of the following ratio: the fraction of likely voters expressing strong approval divided by the fraction of likely voters responding. The same pattern is evident in that ratio:
FIGURE 4

Source: Same as figure 2.
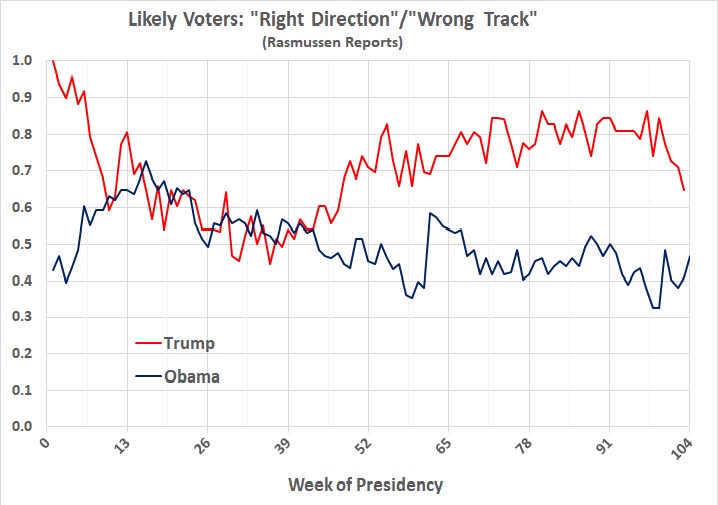
Every week since the first inauguration of Obama, Rasmussen Reports has asked 2,500 likely voters whether they see the country as going in the right direction or being on the wrong track. Figure 5 shows the ratios of right direction/wrong track for Trump and Obama. Here, again, the mood of the voters has turned starkly gloomy, a bad sign for Trump:
FIGURE 5
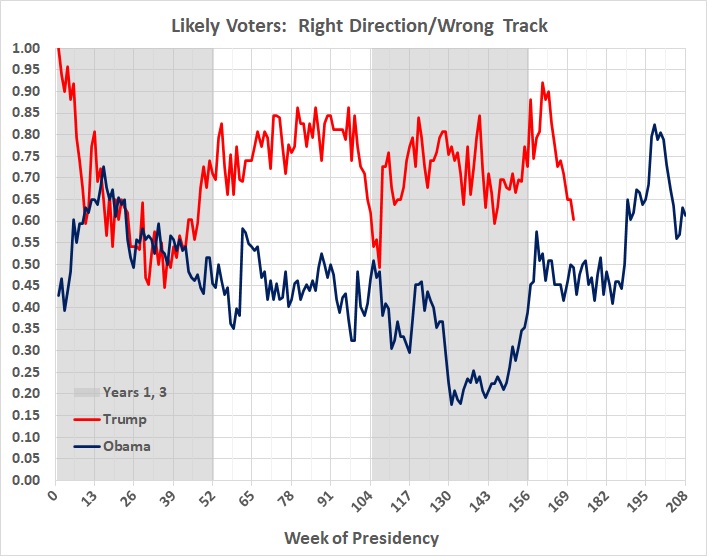
Source: Rasmussen Reports, “Right Direction or Wrong Track“.
Economic Outlook
Meanwhile, despite the largest quarter-to-quarter decline in real GDP (-4.8 percent) since the crash of 2008, the stock market has begun a tentative recovery from a steep decline:
FIGURE 6

Re-election Watch
Minuses:
Trump’s popularity, relative to Obama’s 8 years ago, is in decline. (See figure 2.)
Trump’s hard-core support is also declining. (See figures 3 and 4.)
Voters currently have a much gloomier view of the state of the nation than they did when Obama was re-elected. (See figure 5.)
Potential pluses:
The tentative stock-market recovery (Figure 6) may signal an economic recovery, which could lead to a recovery in Trump’s popularity.
The possibility that U.S. Attorney John Durham’s criminal investigation of the origins of Spygate will yield revelations damaging to Democrats.
Stay tuned.