UPDATED 02/09/17
There was much talk during the recent presidential election campaign about “shy” Trump supporters. Scott Adams theorized about them on September 9, 2016:
It’s hard to count people who are intentionally hiding [a preference for Trump]. But just for fun, let’s see if we can deduce how many so-called Shy Trump Supporters are out there.
For starters, we can say with certainty that they exist. I have a better ear for that than most of you because of my Trump blogging and my public endorsement of Clinton for my personal safety. People feel comfortable telling me privately, and also anonymously online, that they hide their Trump support from their spouse and coworkers. So we know they exist. We just don’t know how many.
We know that sometimes robocall surveys and online surveys show more Trump support than human-to-human polling. So that might be an indicator, but we don’t know what other variables are in play.
In a recent Reuters poll, 7% of respondents “refused” to vote for either Trump or Clinton. I’m guessing some Shy Trump Supporters “park” their votes with Gary Johnson (polling at 9.3%) or Jill Stein (polling at 3.3%).
But I wonder if the Shy Trump supporters are mostly parked with Johnson because of gender (consciously or unconsciously), whereas Stein is more of a real protest vote against Clinton. Anecdotally, Shy Trump Supporters tell me they do park their pre-vote preferences with Johnson. So far, none have told me they are parking their vote with Stein. (This is anecdotal, and a small sample of perhaps a dozen.)
Then you also have the question of turnout. Trump is clearly generating the most enthusiasm in public appearances. I would think that translates into more new voters.
Most of my predictions so far this election cycle have been based on what I call the Master Persuader Hypothesis. I’ll depart from that model for this prediction because this one is based on a gut feel – which I understand in my rational mind to feel identical to confirmation bias. Therefore, you should place zero confidence in my prediction.
I predict that 3% of voters are Shy Trump Supporters. As polls continue to tighten, especially in battleground states, that will be enough for an electoral landslide for Trump.
And it was an electoral landslide, popular-vote totals to the contrary notwithstanding. See my analysis in “H.L. Mencken’s Final Legacy.”
In a commentary about Adams’s post, “The ‘Shy Trump Supporter’ Hypothesis” (September 10, 2016), I said this:
So I believe that Scott Adams is right. A lot of “shy Trump supporters” are claiming that they’ll vote for Johnson, but most of them will vote — if they do vote — for Trump. My evidence? Trump’s standing in Rasmussen’s poll is strongly (r-squared = 0.6) and negatively correlated with Johnson’s standing. As voters decide that they aren’t going to waste votes on Johnson, they’ll turn (mainly) to Trump….
If Johnson’s popular-vote share slips from its current 9 percent to 3 percent on election day — which is 3 times better than his showing in 2012 — Trump would pick up 3 percentage points. On the other hand, if Stein’s support slips from its current 2 percent to 1 percent on election day — 3 times better than her showing in 2012 — Clinton would pick up 0.7 percentage point. So far, so good, for Trump.
My forecasts of Johnson’s and Stein’s slippage were just about on the money. But I was nevertheless pessimistic about Trump’s chances:
[A]s the “other-undecided” vote shrinks from its present level of 7 percent to 1 percent (a bit higher than in recent elections), Clinton will pick up 5.5 percentage points while Trump picks up only 1.3 percentage point.
Adding it up, there’s a likely gain for Trump of 4+ percentage points and a likely gain for Clinton of 6+ percentage points. Adding those numbers to Rasmussen’s latest results for Trump (39 percent) and Clinton (43 percent) yields something like 43 or 44 percent for Trump and 49 or 50 percent for Clinton.
And I was wrong. As the outcome of the recent election attests, there are a lot of shy Republicans lurking in the ranks of nominally unaffiliated voters.
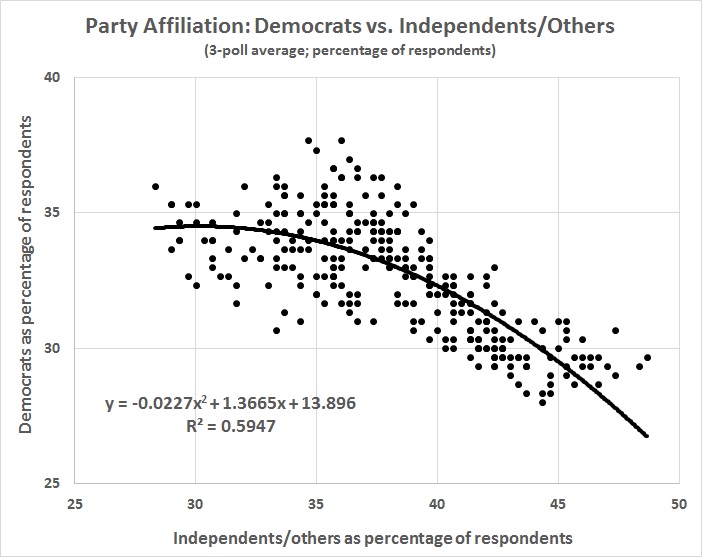
How many? I have estimated their strength by analyzing the Gallup poll of party affiliations. For 303 polls conducted from January 2004 to January 2017, here are the relationships between the non-aligned respondents and those who claimed a Democrat or Republican affiliation. The non-aligned respondents are those who claimed to be independents plus the small fraction of other respondents not claiming to be Democrat, Republican, or independent:
There’s a somewhat stronger, mirror-image relationship for Republicans:
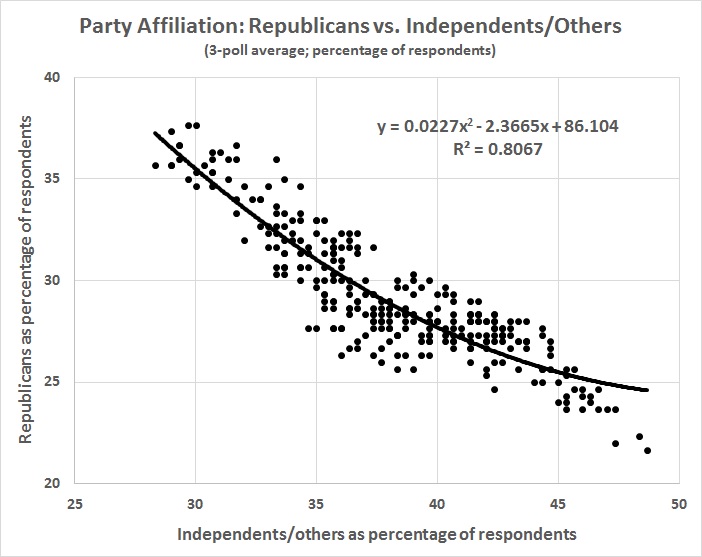
As the size of the non-aligned block shrinks, more members of that bloc choose the Republican label than choose the Democrat label. For example, referring to the first graph, a drop in the fraction claiming independent/other status from the maximum of 49 percent to the minimum of 28 percent results in a gain for Democrats of 8 percentage points. Referring to the second graph, the same reduction in the independent/other fraction results in a gain for Republicans of 13 percentage points.
The equations represent long-run averages, of course, and Democrats have had their share of success among nominally unaligned voters, especially around the time of Obama’s win in 2008. The underestimation of latent support for Democrats at that time shows up in the following graph, which represents the actual results of the 303 Gallup polls and the results derived from the equations in the first two graphs:
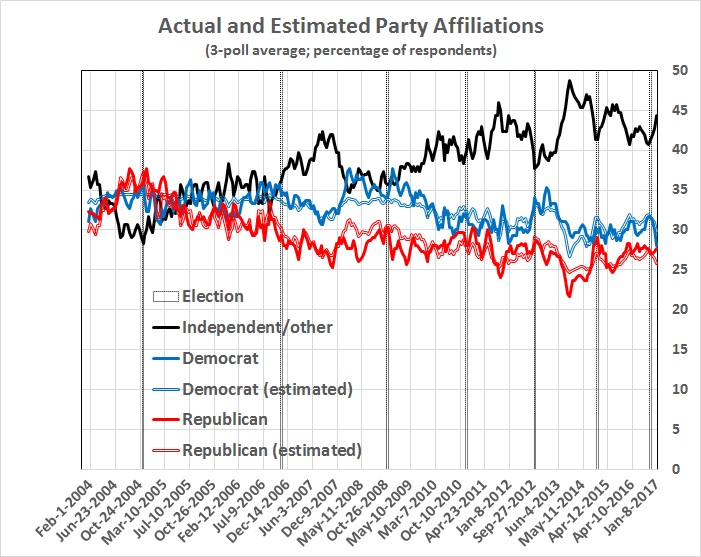
The key to the outcome of the 2016 election is the net change in voters claiming GOP and Democrat affiliation since the high-water mark of those claiming independent-other status, which occurred in December 2013. From then until November 2016, the percentage of voters claiming independent-other status went from 48 to 41, a drop of 7 percentage points. Of the 7 points , the Republican Party added 4.7 while the Democrat Party added 2.3. As a result, Clinton’s long-expected national landslide became a hollow, California-based, popular-vote victory — and a comfortable electoral-vote win for Trump.
