GO TO “TRUMP IN THE POLLS: AN UPDATE” FOR LATER POLLING DATA.
This was a final update before election day. The Dems won a majority in the House, though a narrow one. Meanwhile, the GOP has increased its majority in the Senate. That is the better half of the loaf because control of the Senate means that Trump can continue to remake the judiciary in a conservative image. Further, the House will be perceived as the obstructionist body for the next two years, setting the stage for a GOP restoration there. Barring the unforeseeable, a largely successful Trump presidency will set the stage for Republican dominance in 2020.
How is Trump’s popularity these days? And how will his standing with voters affect the outcome of tomorrow’s elections?
Trump’s approval ratings have been fairly steady since early in the year, with a recent uptick that bodes well for GOP candidates:
FIGURE 1
 Derived from Rasmussen Reports approval ratings for Trump.
Lest you believe that those numbers are weak, consider this comparison with Obama’s numbers:
FIGURE 2
 Derived from Rasmussen Reports approval ratings for Obama and Trump.
In this age of polarization, it’s hard for any president to routinely attain high marks:
FIGURE 3
 Source: Same as figure 2.
The good news, again, is that Trump’s strong approval rating has been significantly higher than Obama’s for the past several months.
Ratios of the ratios in figure 2 yield enthusiasm ratios: the strength of strong approval ratings relative to overall approval ratings:
FIGURE 4
 Source: Same as figure 2.
Since the spike associated with the Singapore summit, Trump”s enthusiasm ratio has settled into a range that is comfortably higher than Obama’s.
There is a different poll that is more revealing of Trump’s popularity. Every week since the first inauguration of Obama, Rasmussen Reports has asked 2,500 likely voters whether they see the country as going in the “right direction” or being on the “wrong track”. The following graph shows the ratios of “right direction”/”wrong track” for Trump and Obama:
FIGURE 5
 Source: Rasmussen Reports, “Right Direction or Wrong Track“.
The ratio for Trump, after a quick honeymoon start, fell into the same range as Obama’s. But it jumped with the passage of the tax cut in December 2017, and has remained high since then, despite the faux scandals concocted by the leftist media and their concerted attack on Trump.
Figure 5 suggests that the squishy center of the electorate is lining up behind Trump, despite the incessant flow of negative “reporting” about him and his policies. (See “related reading” at the end of this post.) His base is with him all the way.
Trump’s coattails may be be decisive in November. Based on an analysis of the relationships between Obama’s popularity (or unpopularity) and the outcome of House elections, it looks like the GOP will hold the House while losing about 10 seats. (This is a very rough estimate with a wide margin of error.)
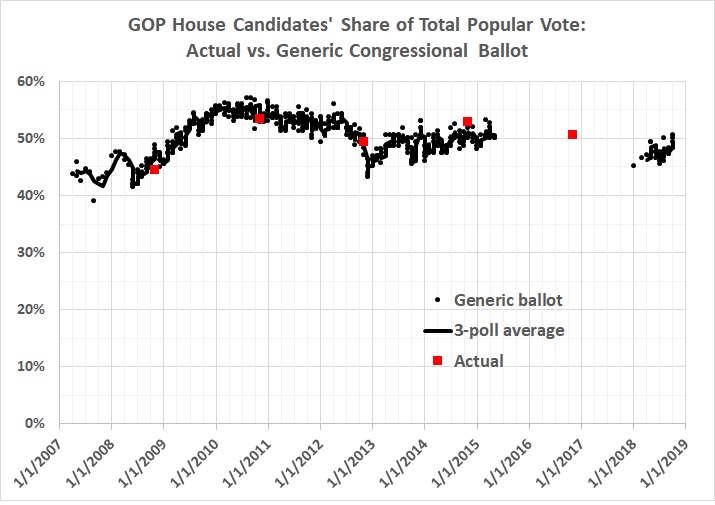
Rasmussen’s generic congressional ballot affords a similar view. The polling data, which are behind a paywall, span April 2007 to May 2015 (when the poll was discontinued), and January 2018 (when the poll was resumed) to the present.
This graph compares the polling results to date with the actual nationwide vote shares compiled by House candidates in the general elections of 2008, 2010, 2010, and 2014:
FIGURE 6
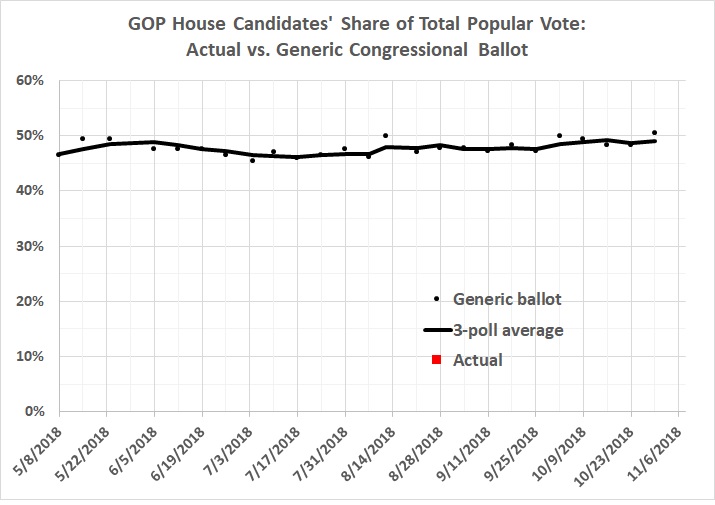
Taking a closer look:
FIGURE 7
Rasmussen advertises a 2-percentage-point margin of error, which is borne out by the results for the elections of 2008-2014. In fact, the generic congressional ballot was spot-on in 2010 and 2012, while the GOP under-performed slightly in 2008 (the year of the financial crisis) and over-performed slightly in 2014 (a mid-term referendum on Obama).
Let’s say, for the sake of argument, that this year’s polls are spot-on. The latest poll (figure 7) gives the GOP 51 percent of the two-party vote. How does that translate into House seats? Recent history is probably the best guide:
FIGURE 8

A 51-percent share of the vote would give the GOP about 52 percent of House seats; that is, the GOP would hold the House. In fact, two years ago the GOP won more than 55 percent of House seats with 50.5 percent of the two-party vote.
There’s more evidence against the loss of the House:
1. I correlated measures of Obama’s popularity (or lack thereof) with with the outcomes of House mid-terms during his presidency. I then applied those correlations to measures of Trump’s popularity (or lack thereof), which is markedly higher than Obama’s at this stage of their respective presidencies (according to Rasmussen, at least).
2. I correlated the outcomes of post-WWII mid-terms during GOP presidencies with the GOP presidents’ shares of the 2-party vote in the preceding elections. I then applied that result to Trump’s share of the 2-party vote in 2016.
Both methods yield the same result for 2018: a loss of 4 House seats by the GOP (yes, four seats, not 4 percent of seats). The estimates are surrounded by a wide margin of error. Given that, the results support the view that the GOP will hold the House.
In the end, the outcome will depend on turnout. Are Democrats more charged up than Republicans? I don’t think so.
Stay tuned.
Related reading:
Alex Castellanos, “How Trump Has Managed to Defy Gravity“, RealClearPolitics, July 31, 2018
Selwyn Duke, “Media Collusion: 100-Plus Papers Agree to Simultaneously Run Anti-Trump Editorials“, The New American, August 14, 2018
Dennis Prager, “The Greatest Hysteria in American History“, RealClearPolitics, July 24, 2018
Ned Ryun, “None Dared Call It Treason … When It Was a Democrat“, American Greatness, July 24, 2018
