UPDATED 01/23/20
Recent weather events have served to reinforce climate hysteria. There are the (usual) wildfires in California, which have nothing to do with “climate change” (e.g., this, this, and this), but you wouldn’t know it if you watch the evening news (which I don’t but impressionable millions do).
Closer to home, viewers have been treated to more of the same old propaganda from our local weather nazi, who proclaims it “nice” when daytime high temperatures are in the 60s and 70s, and who bemoans higher temperatures. (Why does he stay in Austin, then?) We watch him because when he isn’t proselytizing “climate change” he delivers the most detailed weather report available on Austin’s TV stations.
He was in “climate change” heaven when in September and part of October (2019) Austin endured a heat wave that saw many new high temperatures for the relevant dates. To top it off, tropical storm Imelda suddenly formed in mid-September near the gulf coast of Texas and inundated Houston. According to him, both events were due to “climate change”. Or were they just weather? My money’s on the latter.
Let’s take Imelda, which the weather nazi proclaimed to be an example of the kind of “extreme” weather event that will occur more often as “climate change” takes us in the direction of catastrophe. Those “extreme” weather events, when viewed globally (which is the only correct way to view them) aren’t occurring more often. This is from “Hurricane Hysteria“, which I have just updated to include statistics compiled as of today (11/19/19):
[T]he data sets for tropical cyclone activity that are maintained by the Tropical Meteorology Project at Colorado State University cover all six of the relevant ocean basins as far back as 1972. The coverage goes back to 1961 (and beyond) for all but the North Indian Ocean basin — which is by far the least active.
Here is NOAA’s reconstruction of ACE in the North Atlantic basin through November 19, 2019, which, if anything, probably understates ACE before the early 1960s:
The recent spikes in ACE are not unprecedented. And there are many prominent spikes that predate the late-20th-century temperature rise on which “warmism” is predicated. The trend from the late 1800s to the present is essentially flat. And, again, the numbers before the early 1960s must understate ACE.
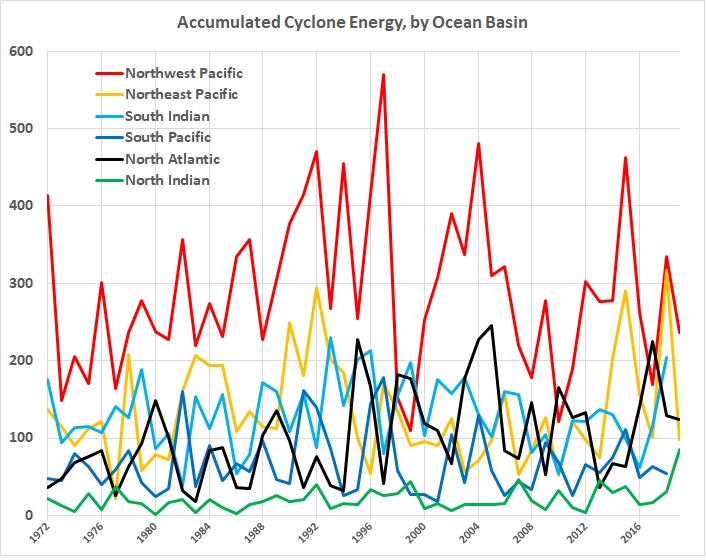
Moreover, the metric of real interest is global cyclone activity; the North Atlantic basin is just a sideshow. Consider this graph of the annual values for each basin from 1972 through November 19, 2019:
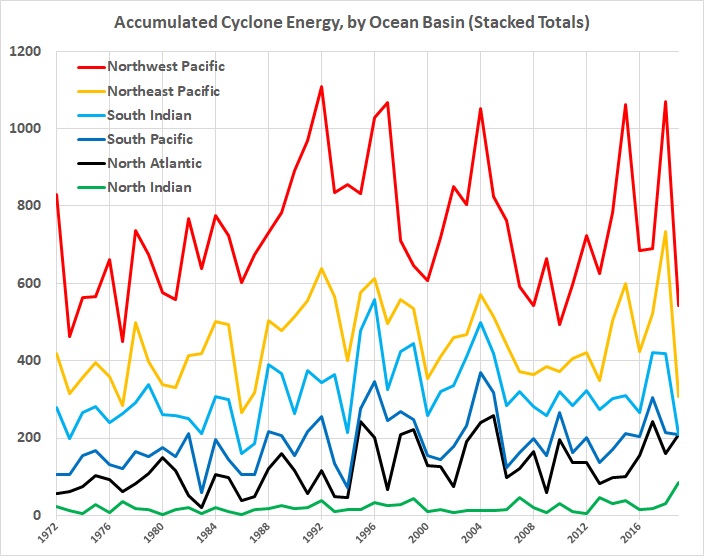
Here’s a graph of stacked (cumulative) totals for the same period:
The red line is the sum of ACE for all six basins, including the Northwest Pacific basin; the yellow line in the sum of ACE for the next five basins, including the Northeast Pacific basin; etc.
I have these observations about the numbers represented in the preceding graphs:
- If one is a believer in CAGW (the G stands for global), it is a lie (by glaring omission) to focus on random, land-falling hurricanes hitting the U.S. or other parts of the Western Hemisphere.
- The overall level of activity is practically flat between 1972 and 2019, with the exception of spikes that coincide with strong El Niño events.
- There is nothing in the long-term record for the North Atlantic basin, which is probably understated before the early 1960s, to suggest that global activity in recent decades is unusually high.

Imelda was an outlier — an unusual event that shouldn’t be treated as a typical one. Imelda happened along in the middle of a heat wave and accompanying dry spell in central Texas. This random juxtaposition caused the weather nazi to drool in anticipation of climate catastrophe.
There are some problems with the weather nazi’s reaction to the heat wave. First, the global circulation models (GCMs) that forecast ever-rising temperatures have been falsified. (See the discussion of GCMs here.) Second, the heat wave and the dry spell should be viewed in perspective. Here, for example are annualized temperature and rainfall averages for Austin, going back to the decade in which “global warming” began to register on the consciousnesses of climate hysterics:
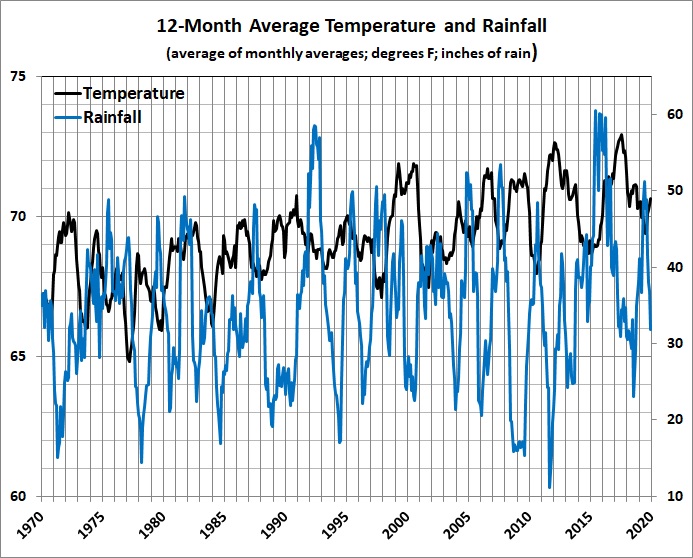
What do you see? I see a recent decline in Austin’s average temperature from the El Nino effect of 2015-2016. I also see a decline in rainfall that doesn’t come close to being as severe the a dozen or so declines that have occurred since 1970.
In fact, abnormal heat is to be expected when there is little rain and a lot of sunshine. Temperature data, standing by themselves, are of little use because of the pronounced urban-heat-island (UHI) effect (discussed here). Drawing on daily weather reports for Austin for the past five years, I find that Austin’s daily high temperature is significantly affected by rainfall, wind speed, wind direction, and cloud cover. For example (everything else being the same):
- An additional inch of rainfall induces an temperature drop of 1.4 degrees F.
- A wind of 10 miles an hour from the north induces a temperature drop of about 5.8 degrees F relative to a 10-mph wind from the south.
- Going from 100-percent sunshine to 100-percent cloud cover induces a temperature drop of 0.5 degrees F. (The combined effect of an inch of rain and complete loss of sunshine is therefore 1.9 degrees F, even before other factors come into play.)
The combined effects of variations in rainfall, wind speed, wind direction, and cloud cover are far more than enough to account for the molehill temperature anomalies that “climate change” hysterics magnify into mountains of doom.
Further, there is no systematic bias in the estimates, as shown by the following plot of regression residuals:

Summer is the most predictable of the seasons; winter, the least predicable. Over- and under-estimates seem to be evenly distributed across the seasons. In other words, the regression doesn’t mask changes in seasonal temperature patterns. Note, however, that this fall (which includes both the hot spell and cold snap discussed above) has been dominated by below-normal temperatures, not above-normal ones.
Anyway, during the spell of hot, dry weather in the first half of the meteorological fall of 2019, the maximum temperature went as high as 16 degrees F above the 30-year average for relevant date. Two days later, the maximum temperature was 12 degrees F below the 30-year average for the relevant date. Those extremes tell us a lot about the variability of weather in central Texas and nothing about “climate change”.
However, the 16-degree deviation above the 30-year average was far from the greatest during the period under analysis; above-normal deviations have ranged as high as 26 degrees F above 30-year averages. By contrast, during the subsequent cold snap, deviations reached their lowest levels for the period under analysis. The down-side deviations (latter half of meteorological fall, 2019) are obvious in the preceding graph. The pattern suggests that, if anything, fall 2019 in Austin was abnormally cold rather than abnormally hot.
Winter 2019-2020 has started on out the warm side, by not abnormally so. Further, the warming can be attributed in part to weak El Nino conditions.
