What Makes a Winning Team?

As Eric Walker — the real inventor of “moneyball” — puts it, “moneyball is about seeking undervalued commodities.” Perhaps baseball teams have done a better job of acquiring undervalued commodities since the publication of Michael Lewis’s Moneyball in 2003. But arbitrage opportunities are fleeting, as the price of a “bargain” is driven up and it is no longer a “bargain.” Moreover, as Walker explains, “moneyball” has been around since the 1980s and the concept surely had some influence on player selection even before Lewis made it famous.

At any rate, I have analyzed the performance and payrolls of American League (AL) teams for 1988-2011 to determine their effects on teams’ won-lost (W-L) records. I focused on the AL because an analysis of both major leagues would have been complicated by the presence of the designated hitter in the AL and the absence of the DL in the National League. I began with 1988 because that is the first year covered by the USATODAY Salaries Database for baseball. Performance data are from Retrosheet.

What did I learn from those 24 years’ worth of data? This:

1. Payroll does not drive W-L record.

2. Payroll is mainly determined by 7 aspects of performance.

3. W-L record is mainly determined by 9-11 aspects of performance, only 2-4 of which overlap with the determinants of payroll.

4. W-L record is strongly correlated with the ratio of runs scored (RS) to runs allowed (RA), with an r-squared of 0.89. There is considerable overlap between the determinants of RS-RA and the determinants of W-L record. There is not much overlap between the determinants of RS:RA and the determinants of payroll.

I begin with the relationship between payroll and W-L record:

 Payroll index is the ratio of a team’s payroll in a given season to the average payroll of all AL teams in the same season. A regression on W-L record with payroll index as an explanatory variable cannot include additional explanatory variables that are statistically significant (less than 1 percent chance of a random relationship with the dependent variable). As discussed below, this result indicates that payroll index is a proxy for measures of performance that are statistically significant determinants of a W-L record and RS:RA.

The following table summarizes the results of six regressions. Instead of showing the coefficients for the explanatory variables, I have converted them to elasticities, expressed as the percentage increase in a dependent variable that results from a 1-percent increase in the value of the explanatory variable.

Before I walk through the table, I should observe that the figures represent average tendencies over a 24-year span. The figures are significant, but they do not necessarily indicate the best course of action for a given team in a given situation. The best  course of action for a given team in a given situation will depend on the team’s options (e.g., players available on the free-agent market), on the likely payoff of those options (e.g., addition to runs scored if player A is signed and player B is traded away), and on the cost of obtaining each payoff (e.g., net addition to payroll if player A is signed and player B is traded).

The results in the payroll index column show that the payrolls of AL teams in 1988-2011 were driven mainly by batters’ on-base percentage (OBP); pitchers’ avoidance of giving up home runs; pitchers’ ability to strike out batters (SO); fielders’ avoidance of errors (ERR); batters’ home runs (HR); catchers’ throwing out base stealers (CS); and batters’ not hitting a lot of triples (3B) — perhaps because of the typical characteristics of triples hitters (e.g., they are not usually home-run hitters).

In the next column we see, again, that payroll spending — in the aggregate over 24 seasons — does not strongly influence W-L record. But because payroll is a proxy for several performance variables, no other variable show up as statistically significant when payroll index is used as an explanatory variable. It is important to note, however, that the relatively weak relationship between W-L record and payroll index for the entire AL masks considerable variation across teams. Here is a summary comparison, for the 13 teams that were in the AL in every year from 1988 through 2011:

The Oakland A’s of “moneyball” fame did will for the amount of money spent on payroll, as measured by W-L record divided by payroll index (right-hand column). But, on that measure, the A’s did no better than the Twins, and not a lot better than the Royals and White Sox.

The Yankees were the best team in the AL during 1988-2011, and they paid what it took to be the best. The Red Sox were the second-best team, and they paid accordingly. After that, results were mixed. The A’s paid a lot less than the Yankees and Red Sox, and still won a lot — but did not get much in return when they spent more (correlation coefficient of 0.19, as against 0.50 for the Yankees and 0.31 for the Red Sox). Though an above-average payroll index was not required for a winning record, four of the top six team in W-L and every team with a payroll index of 1.00 or grater had a winning record. All teams but one — the Rangers — managed to eke out some additional wins by increasing their payrolls.

The following graphs illustrate several story lines, such as success with young, low-priced players who then become higher-priced and less-productive players; overspending on once-outstanding veterans whose best seasons were behind them; overspending on promising players whose performance did not rise with their salaries. For ease of reading each team’s W-L record, I have inserted in each graph a horizontal black line at the break-even mark (.500).

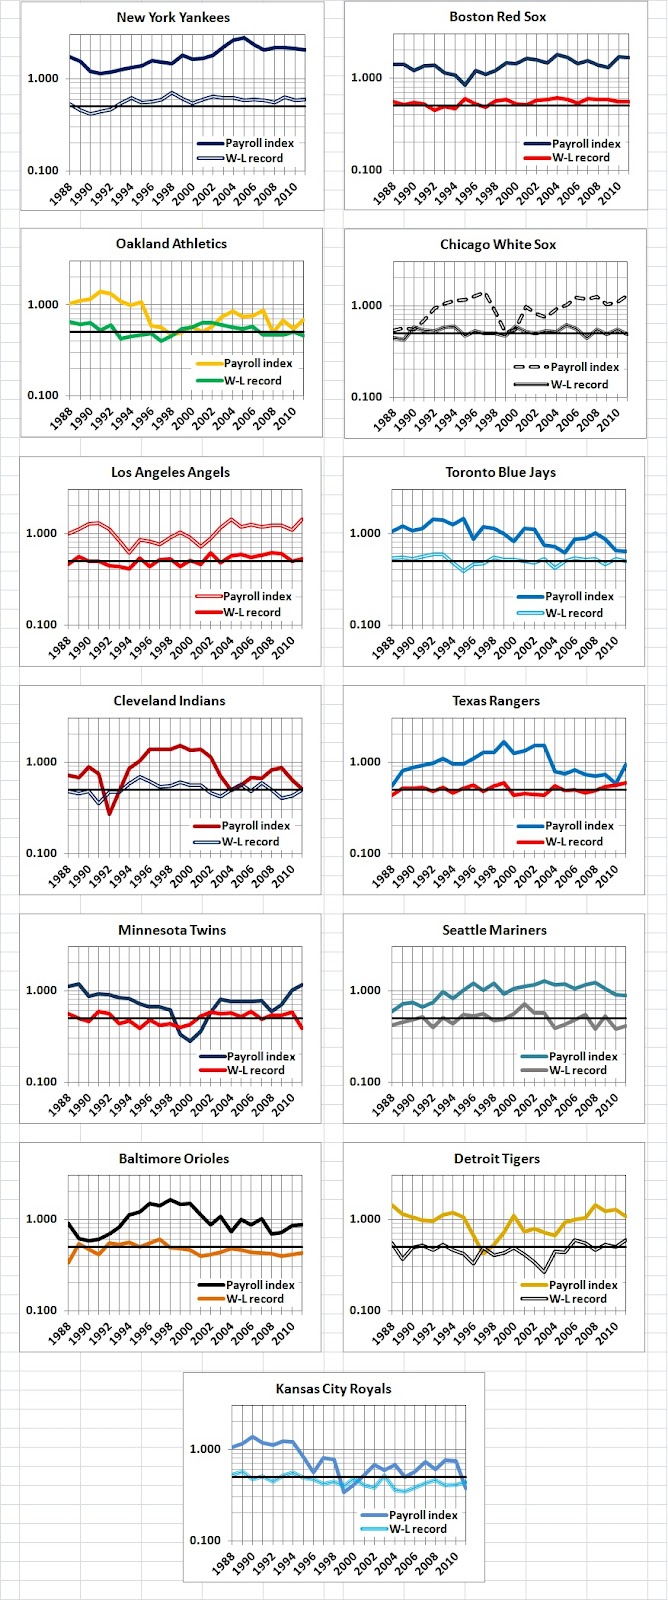
Seen in the context of 13 team histories, the A’s look like a team that did well for a while with relatively high-priced players; pared its payroll as its fortunes faded; happened to do well for a while on low-priced players, and then faded as its payroll rose.

Let us now to the column headed W-L record (II) in the first table above. This is where the bat meets the ball, so to speak, because it tells us something about the aspects of performance that determine a team’s W-L record. Except for on-base percentage (OBP), the determinants of payroll have little to do with winning. Defense (represented in fielding average) is far and away the most important determinant of winning. (The payoff of defense may be somewhat overstated, as I will come to.) After that, preventing hits (H) and getting them weigh heavily. Pitchers who save games (SV) are important to winning, as are pitchers who do not give up a lot of walks (BB). Home runs (HR) are just as important as payroll, even though they are down the list of factors that determine payroll.

As mentioned earlier, W-L record is strongly correlated with the ratio of runs scored to runs allowed (RS:RA). The next two columns of the table assess the relationships between RS and various measures of performance; the right-hand column deals with RA. On the offensive side, HR remains important, as does OBP appear, directly and in the form of key elements — H, BA, and BB. On the defense side, fielding is key (more below). Next are H, BB, and HR allowed by pitchers, meaning that allowing relatively few H, BB, and HR are keys to the defensive side of the game. Another key, though a less important one, is striking out batters (SO).

As for fielding, a position-by-position view is more relevant, and the possibility of obtaining better fielding is overstated for some positions. The following table affords the position-by-position view and eliminates the overstatements:

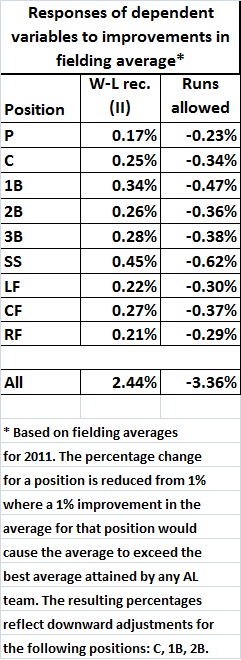
What this tells us is that improved fielding, at any position, can strongly improve a team’s chances of winning, even though fielding is not among the key determinants of payroll.

Is Jeter Worth It?

Rumor has it that the Yankees have offered Derek Jeter a three-year contract worth $45 million. The annual rate of $15 million would be a comedown from Jeter’s 2010 pay of $22.6 million (source), but in terms of on-field performance, Jeter would be grossly overpaid. And he wants to be more grossly overpaid, of course.

Let’s look at Jeter’s value to the Yankees since 1996, the first year for which his salary is known:

OPS+ per
Year Age OPS+ Salary $10 mn
1996 22 101 $130,000 0.07769
1997 23 103 $550,000 0.01873
1998 24 127 $750,000 0.01693
1999 25 153 $5,000,000 0.00306
2000 26 128 $10,000,000 0.00128
2001 27 123 $12,600,000 0.00098
2002 28 111 $14,600,000 0.00076
2003 29 125 $15,600,000 0.00080
2004 30 114 $18,600,000 0.00061
2005 31 125 $19,600,000 0.00064
2006 32 132 $20,600,000 0.00064
2007 33 121 $21,600,000 0.00056
2008 34 102 $21,600,000 0.00047
2009 35 125 $21,600,000 0.00058
2010 36 90 $22,600,000 0.00040
119 $205,430,000 0.00087

OPS+ is a measure of offensive performance. It is on-base percentage plus slugging average (OPS) adjusted for year and ballpark. An OPS+ of 100 represents the average for the league and year.

Jeter’s on-field value to the Yankees, as an offensive player, peaked in 1999, when his OPS+ reached a career-high 153. His OPS+ per $10 million of salary in that year was 0.00306. It has been all downhill since, both in terms of OPS+ (though there have been some good years since 1999) and OPS+ per $10 million of salary. The latter figure dwindled to 0.00040 in 2010, when Jeter’s OPS+ fell to 90, that is, 90 percent of the league average.

It is only reasonable to assume that Jeter’s productivity will decline further from its peak, even if he recovers somewhat from the 2010’s unusually weak performance. Even at $15 million per season, Jeter will be an over-priced commodity, given his likely on-field performance.

So, if Jeter is worth $15 million a year, or more, it’s only because of his leadership qualities (which can’t be measured) and his draw as a symbol of Yankee greatness. I suspect that Jeter’s leadership qualities will not be enough to reverse the Yankees’ evident decline. Further, that decline will more than offset whatever value Jeter has at the box office.

I look forward, with sadness, to some relatively lean years in the Bronx, and to buyer’s remorse on the part of the Yankees if they settle with Jeter for much more than $15 million a season.

The American League’s Greatest Hitters: Part II

SUPERSEDED BY “THE AMERICAN LEAGUE’S GREATEST HITTERS: III

UPDATED 12/08/11

When last seen, the best of the American League’s greatest hitters were:

Adjusted Nominal Player Years in AL Batting average % change # change
rank* rank (all-caps, Hall of Fame; From To Nominal Adjusted in BA in rank
* indicates active)
1 12 Ichiro Suzuki* 2001 2010 .331 .353 6.2% 11
2 1 TY COBB 1905 1928 .366 .353 -3.9% -1
3 2 Shoeless Joe Jackson 1908 1920 .356 .351 -1.3% -1
4 10 NAP LAJOIE 1901 1916 .336 .333 -0.9% 6
5 3 TRIS SPEAKER 1907 1928 .345 .331 -4.0% -2
6 16 ROD CAREW 1967 1985 .328 .331 0.9% 10
7 11 EDDIE COLLINS 1906 1930 .333 .326 -2.2% 4
8 6 BABE RUTH 1914 1934 .343 .324 -6.1% -2
9 8 LOU GEHRIG 1923 1939 .340 .323 -5.4% -1
10 18 JOE DIMAGGIO 1936 1951 .325 .322 -0.7% 8
11 4 TED WILLIAMS 1939 1960 .344 .319 -7.9% -7
12 15 WADE BOGGS 1982 1999 .328 .319 -2.8% 3

I left the earlier post hanging on the question of how the top hitters would compare when their batting averages were adjusted further, for age. I now have some of the answers.

To get the answers, I quantified the relationship between adjusted batting average and age for the 120 hitters considered in the earlier post. (As a reminder, those hitters attained nominal lifetime averages of .285 or better in at least 5,000 plate appearances in the American League. Their averages take into account long-term and year-to-year changes in playing conditions, as well as differences among ballparks at a give time and over time.) Here is the relationship, in graphical form:


I used the equation shown on the graph to adjust each hitter’s annual batting average according to the age at which he attained the average. If the “normal” hitter peaks at 28, as the equation suggests, averages attained before and after the age of 28 are “understated.” That is, if a player hits .300 at the age of 20, that’s equivalent to hitting .315 at the age of 28; and if a player hits .300 at the age of 40, that’s equivalent to hitting .341 at the age of 28.

My analysis of age-adjusted batting average has yielded two key findings, thus far. The first finding, which is captured in the following graph and its accompanying table, is that the top averages for ages 18-41 were accomplished by just seven different players. This graph compares the year-by-year, age-adjusted averages for each of the seven players:


For ease of viewing, I omitted the five players (Speaker, Carew, Collins, Ruth, and Gehrig) who never hold the top spot at any age, despite their impressive career averages. The top hitters at each age are as follows:

Age-adjusted
Age Player BA
18 Cobb .267
19 Cobb .336
20 Cobb .369
21 Jackson .392
22 Cobb .395
23 Cobb .399
24 Cobb .387
25 Cobb .397
26 Cobb .391
27 Cobb .380
28 Cobb .379
29 Lajoie .383
30 Cobb .396
31 Cobb .387
32 Cobb .369
33 Suzuki .377
34 DiMaggio .362
35 Lajoie .414
36 Suzuki .364
37 Lajoie .373
38 Williams .398
39 Williams .343
40 Cobb .357
41 Boggs .343

Given that information, it shouldn’t surprise you to learn that Ty Cobb returns to the top of the heap when his single-season averages are age-adjusted, and weighted by his at-bats in each season, to obtain an age-adjusted lifetime average. Here is the age-adjusted list of top-12 career batting averages:

Batter Age-adjusted career BA
1 Ty Cobb .3639
2 Shoeless Joe Jackson .3559
3 Ichiro Suzuki* .3582
4 Nap Lajoie .3405
5 Tris Speaker .3313
6 Rod Carew .3307
7 Ted Williams .3306
8 Eddie Collins .3258
9 Babe Ruth .3236
10 Lou Gehrig .3228
11 Joe DiMaggio .3223
12 Wade Boggs .3190
* Through 2010 season; before .272 average in 2011 reduced career BA by .0054.

I have not extended my analysis to include the 2011 season, but it is clear that Suzuki now belongs in 3rd place. The loss of .0054 from his nominal career BA in 2011 is far greater than his age-adjusted lead (.0023) over Jackson through 2010.

The American League’s Greatest Hitters

Through a painstaking series of adjustments for changes in playing standards and conditions, and for differences among ballparks, I have reassessed the single-season and career batting averages of the American League’s top hitters. The reassessment covers 120 players whose career average in the American League is at least .285 in at least 5,000 plate appearances.

I will devote a future post to a detailed explanation of the adjustments. In this post, I give an overview of the adjustments and present a revised ranking of the 120 players. I also discuss — but do not adjust for — the effects of age on the revised batting averages and relative standing of players.

I make three kinds of adjustments to nominal (official) BA. One adjustment is a time constant, which captures gradual changes from 1901 to the present that have worked against batters. Such changes would be the improvement of fielding gloves (which have made it harder to get hits, while also raising fielding averages), the introduction of night baseball, and the gradual increase in proportion of games played at night.

A second adjustment is an annual factor that captures the up-and-down swings in the relative difficulty of hitting. These swings have occurred because of changes in the ball, the frequency of its replacement, the size of the strike zone, and the height of the pitching mound, and perhaps other factors.

A third adjustment — one that is unique to each team-park combination — reflects the relative ease or difficulty of hitting in the various parks that have been used in the American League. In many cases the adjustment factor for a given park changes during the years of its use because of significant changes in the dimensions of the field.

The following graph combines the effects of the first two adjustments into a single number for each season. A value greater than 1 means that each hitter’s nominal average for that season was increased to some degree. A value less than 1 means that each hitter’s average for that season was decreased to some degree.


The largest upward adjustments affect averages compiled in the “deadball” years of 1902-1909 and 1913-1916, and in the “era of the pitcher,” from 1962 through 1975. The largest downward adjustments affect averages compiled in the first two years of the AL’s existence and the “lively” ball era, which — judging from the numbers — began in 1919 and lasted through 1938.

The final adjustments — for differences in parks — range widely. For example, Red Sox hiiters (including Ted Williams) suffered a penalty of 5.9 percent for the 1934-2010 seasons, when Fenway Park acquired its present dimensions. By contrast, Yankees who played in the original Yankee Stadium from 1923 through 1973 earned a boost of 4 percent because the original park (despite its short foul lines) was inimical to batters (including Joe DiMaggio).

The following graph captures the total effect of the three adjustments. Each point represents one of the 120 hitters.

The pattern, which the curved line emphasizes, is consistent with the adjustments summarized in the first graph. The points don’t fall neatly on the curved line for three reasons: (1) variations in the length of players’ careers, (2) variations in the numbers of at-bats across seasons (and thus in the weight attached to a season in compiling a career average), and (3) the park-adjustment factor, which varies widely from park to park and (sometimes) for a particular park, if its configuration changed significantly.

How did the various adjustments affect the rankings? First, as would be expected because of the inflation of batting averages in the 1920s and 1930s, those decades are over-represented among the 120 hitters, as shown in the following table. (“Median year” refers to the decade in which a player’s median year occurs. For example, Ty Cobb’s career spanned 1905-1928, so he is counted as a member of the 1911-1920 decade in the following table and the one after it.)

Distribution of Hitters, by Decade
Median year Number Percent
1901-1910 2 1.7%
1911-1920 7 5.8%
1921-1930 17 14.2%
1931-1940 21 17.5%
1941-1950 8 6.7%
1951-1960 8 6.7%
1961-1970 3 2.5%
1971-1980 8 6.7%
1981-1990 10 8.3%
1991-2000 22 18.3%
2001-2010 14 11.7%
120 100%

The adjustments to nominal batting averages did a good job of rectifying the bias toward players of the 1920s and 1930s:

Average Rank, by Decade
Median year Nominal Adjusted Change*
1901-1910 28 17 11
1911-1920 22 23 -1
1921-1930 29 65 -36
1931-1940 44 83 -39
1941-1950 60 63 -3
1951-1960 84 54 30
1961-1970 83 43 40
1971-1980 86 49 37
1981-1990 79 52 27
1991-2000 79 64 15
2001-2010 58 79 -21
* Positive number represents improvement (higher average rank); negative number represents slippage (lower average rank).

Until someone convinces me otherwise, I conclude that the top hitters of the “deadball” era really were great by comparison with those who came later. They are not alone at the top, however. Among the top 10 in the following table are a contemporary player (Ichiro Suzuki), a player of recent memory (Rod Carew), and three Yankees who enjoyed great years in the 1920s and 1930s (Babe Ruth, Lou Gehrig, and Joe DiMaggio). Here, then, are all 120 hitters, listed in the order of adjusted rank:

Adjusted Nominal Player Years in AL Batting average % change # change
rank* rank (all-caps = Hall of Fame; asterisk = From To Nominal Adjusted in BA in rank
active)
1 12 Ichiro Suzuki* 2001 2010 .331 .353 6.2% 11
2 1 TY COBB 1905 1928 .366 .353 -3.9% -1
3 2 Shoeless Joe Jackson 1908 1920 .356 .351 -1.3% -1
4 10 NAP LAJOIE 1901 1916 .336 .333 -0.9% 6
5 3 TRIS SPEAKER 1907 1928 .345 .331 -4.0% -2
6 16 ROD CAREW 1967 1985 .328 .331 0.9% 10
7 11 EDDIE COLLINS 1906 1930 .333 .326 -2.2% 4
8 6 BABE RUTH 1914 1934 .343 .324 -6.1% -2
9 8 LOU GEHRIG 1923 1939 .340 .323 -5.4% -1
10 18 JOE DIMAGGIO 1936 1951 .325 .322 -0.7% 8
11 4 TED WILLIAMS 1939 1960 .344 .319 -7.9% -7
12 15 WADE BOGGS 1982 1999 .328 .319 -2.8% 3
13 47 Don Mattingly 1982 1995 .307 .318 3.3% 34
14 74 MICKEY MANTLE 1951 1968 .298 .317 6.0% 60
15 7 HARRY HEILMANN 1914 1929 .342 .315 -8.9% -8
16 30 Derek Jeter* 1995 2010 .314 .314 0.1% 14
17 5 GEORGE SISLER 1915 1928 .344 .313 -9.8% -12
18 36 Edgar Martinez 1987 2004 .312 .312 0.1% 18
19 25 KIRBY PUCKETT 1984 1995 .318 .311 -2.1% 6
20 89 EDDIE MURRAY 1977 1997 .295 .311 5.1% 69
21 99 Thurman Munson 1969 1979 .292 .310 6.1% 78
22 53 PAUL MOLITOR 1978 1998 .306 .310 1.2% 31
23 35 Magglio Ordonez* 1997 2010 .312 .310 -0.6% 12
24 31 Harvey Kuenn 1952 1960 .313 .309 -1.4% 7
25 44 Roberto Alomar 1991 2004 .309 .308 -0.4% 19
26 9 AL SIMMONS 1924 1944 .337 .308 -9.3% -17
27 17 EARLE COMBS 1924 1935 .325 .308 -5.6% -10
28 68 Minnie Minoso 1949 1964 .300 .307 2.4% 40
29 70 Joe Judge 1915 1934 .299 .307 2.7% 41
30 45 SAM CRAWFORD 1903 1917 .309 .307 -0.5% 15
31 55 Tony Oliva 1962 1976 .304 .307 0.7% 24
32 92 Mickey Rivers 1970 1984 .295 .306 3.7% 60
33 38 Baby Doll Jacobson 1915 1927 .311 .305 -1.9% 5
34 83 Carl Crawford* 2002 2010 .296 .305 2.8% 49
35 67 Julio Franco 1983 1999 .301 .304 1.3% 32
36 54 GEORGE BRETT 1973 1993 .305 .304 -0.3% 18
37 56 Paul O’Neill 1993 2001 .303 .304 0.1% 19
38 48 HOME RUN BAKER 1908 1922 .307 .303 -1.2% 10
39 72 Cecil Cooper 1971 1987 .298 .303 1.7% 33
40 20 SAM RICE 1915 1934 .322 .303 -6.2% -20
41 14 HEINIE MANUSH 1923 1936 .331 .303 -9.1% -27
42 32 BILL DICKEY 1928 1946 .313 .303 -3.3% -10
43 101 Lou Piniella 1964 1984 .291 .302 3.9% 58
44 29 Cecil Travis 1933 1947 .314 .302 -3.9% -15
45 103 Carney Lansford 1978 1992 .290 .302 4.1% 58
46 41 LUKE APPLING 1930 1950 .310 .302 -2.8% -5
47 50 Stuffy McInnis 1909 1922 .307 .302 -1.7% 3
48 114 Bill Skowron 1954 1967 .286 .301 5.2% 66
49 98 Luis Polonia 1987 2000 .292 .301 3.0% 49
50 84 Garret Anderson 1994 2008 .296 .301 1.5% 34
51 79 AL KALINE 1953 1974 .297 .300 0.9% 28
52 52 GEORGE KELL 1943 1957 .306 .300 -2.2% 0
53 34 Manny Ramirez* 1993 2010 .312 .300 -4.1% -19
54 81 Bernie Williams 1991 2006 .297 .299 0.7% 27
55 64 Frank Thomas 1990 2008 .301 .299 -0.8% 9
56 13 JIMMIE FOXX 1925 1942 .331 .298 -11.1% -43
57 97 Mike Hargrove 1974 1985 .292 .298 1.8% 40
58 42 Bobby Veach 1912 1925 .310 .298 -4.2% -16
59 60 Alex Rodriguez* 1994 2010 .303 .297 -2.0% 1
60 91 Kevin Seitzer 1986 1997 .295 .297 0.6% 31
61 105 John Olerud 1989 2005 .289 .297 2.5% 44
62 102 NELLIE FOX 1947 1963 .290 .297 2.2% 40
63 107 Wally Joyner 1986 2001 .289 .296 2.4% 44
64 104 Harold Baines 1980 2001 .289 .296 2.2% 40
65 112 Carlos Guillen* 1998 2010 .286 .296 3.2% 47
66 116 ROBIN YOUNT 1974 1993 .285 .295 3.4% 50
67 119 Gene Woodling 1946 1962 .284 .295 3.6% 52
68 90 LOU BOUDREAU 1938 1952 .295 .294 -0.3% 22
69 111 Raul Ibanez 1996 2008 .286 .294 2.8% 42
70 120 YOGI BERRA 1946 1963 .284 .294 3.5% 50
71 86 Kenny Lofton 1992 2007 .296 .293 -1.0% 15
72 23 HANK GREENBERG 1930 1946 .319 .293 -8.8% -49
73 93 Albert Belle 1989 2000 .295 .293 -0.8% 20
74 94 Pete Runnels 1951 1962 .294 .292 -0.7% 20
75 82 Shannon Stewart 1995 2008 .297 .292 -1.5% 7
76 66 Ivan Rodriguez 1991 2009 .301 .292 -3.0% -10
77 110 Mickey Vernon 1939 1958 .287 .292 1.8% 33
78 95 Hal McRae 1973 1987 .293 .292 -0.4% 17
79 96 Tony Fernandez 1983 2001 .293 .292 -0.4% 17
80 115 Miguel Tejada* 1997 2010 .286 .292 2.0% 35
81 22 MICKEY COCHRANE 1925 1937 .320 .291 -10.0% -59
82 78 Mike Sweeney 1995 2010 .298 .291 -2.4% -4
83 21 CHARLIE GEHRINGER 1924 1942 .320 .290 -10.5% -62
84 80 Buddy Lewis 1935 1949 .297 .290 -2.5% -4
85 49 George Burns 1914 1929 .307 .289 -6.2% -36
86 26 GOOSE GOSLIN 1921 1938 .316 .289 -9.4% -60
87 58 Mike Greenwell 1985 1996 .303 .288 -5.1% -29
88 51 Johnny Pesky 1942 1954 .307 .287 -6.7% -37
89 24 EARL AVERILL 1929 1940 .318 .287 -10.8% -65
90 88 Juan Gonzalez 1989 2005 .295 .287 -3.0% -2
91 43 John Stone 1928 1938 .310 .287 -8.0% -48
92 19 Ken Williams 1918 1929 .324 .286 -13.1% -73
93 100 Ken Griffey 1989 2010 .291 .286 -1.8% 7
94 65 Billy Goodman 1947 1961 .301 .286 -5.2% -29
95 28 Bibb Falk 1920 1931 .314 .286 -10.0% -67
96 113 Willie Wilson 1976 1992 .286 .286 0.0% 17
97 108 Rafael Palmeiro 1989 2005 .288 .285 -0.8% 11
98 59 Buddy Myer 1925 1941 .303 .285 -6.1% -39
99 69 Michael Young* 2000 2010 .300 .285 -5.3% -30
100 73 JIM RICE 1974 1989 .298 .285 -4.6% -27
101 39 Bob Meusel 1920 1929 .311 .285 -9.2% -62
102 46 Gee Walker 1931 1941 .307 .283 -8.6% -56
103 62 Ben Chapman 1930 1941 .302 .282 -7.1% -41
104 27 Jack Tobin 1916 1927 .315 .282 -11.5% -77
105 117 Alan Trammell 1977 1996 .285 .282 -1.2% 12
106 76 Mo Vaughn 1991 2000 .298 .281 -5.8% -30
107 106 Chuck Knoblauch 1991 2002 .289 .281 -2.7% -1
108 33 JOE SEWELL 1920 1933 .312 .281 -11.0% -75
109 37 Bing Miller 1921 1936 .311 .281 -10.9% -72
110 85 Bob Johnson 1933 1945 .296 .280 -6.0% -25
111 109 Johnny Damon* 1995 2010 .287 .280 -2.8% -2
112 118 CARL YASTRZEMSKI 1961 1983 .285 .279 -2.2% 6
113 61 Hal Trosky 1933 1946 .302 .278 -8.6% -52
114 40 Joe Vosmik 1930 1944 .311 .278 -11.6% -74
115 71 Sam West 1927 1942 .299 .276 -8.2% -44
116 77 Pete Fox 1933 1945 .298 .276 -8.0% -39
117 75 Dom DiMaggio 1940 1953 .298 .276 -8.1% -42
118 63 JOE CRONIN 1928 1945 .302 .275 -9.7% -55
119 87 Doc Cramer 1929 1948 .296 .274 -7.9% -32
120 57 Charlie Jamieson 1915 1932 .303 .274 -10.8% -63
* The adjusted rank considers only the 120 players listed here. Players not listed could outrank some of the players near the bottom of the list.

The names of Hall-of-Famers are capitalized to draw your attention to several who were enshrined mainly on the strength of grossly inflated batting averages.

There is more work to be done, especially with respect to age. Consider, for example, Shoeless Joe Jackson, whose career ended at age 30. Had Jackson continued to play until he was 40, say, his career average would have declined, and with it his position on the list.

Ichiro Suzuki didn’t play in the U.S. until he was 27. Would his career average be even higher if he had crossed over the Pacific in his early 20s? He is atop the list because of his post-32 performance, relative to Ty Cobb’s.

Then there is the case of Ted Williams, whose average and ranking slipped markedly because he enjoyed the friendly confines of Fenway Park. But Williams, who also hit well in his “old age,” missed a lot of peak batting time during WWII and the Korean War.

I will end, for now, with this tantalizing comparison of Suzuki, Cobb, Jackson, and Williams:


Cobb’s consistent brilliance from age 22 to age 32 borders on the amazing. Williams was a great “old” hitter, as Suzuki is proving to be. It is evident that Jackson, despite the closeness of his average to Cobb’s, probably wouldn’t have caught Cobb, unless he had finished in a Suzuki-like manner.

ADDENDUM:

Final, age-adjusted BA for the top-3 all-time AL hitters:

Cobb 0.363919
Suzuki 0.358241
Jackson 0.355946

Go here for details.

The Winningest Managers

Thanks to Baseball-Reference.com, I have compiled the following table:

Managers with at least 1000 wins after 1900, sorted by W-L record
Yrs From To G W L W-L% ▾
Joe McCarthy 24 1926 1950 3487 2125 1333 .615
Billy Southworth 13 1929 1951 1770 1044 704 .597
John McGraw 33 1899 1932 4769 2763 1948 .586
Al Lopez 17 1951 1969 2425 1410 1004 .584
Earl Weaver 17 1968 1986 2541 1480 1060 .583
Fred Clarke 19 1897 1915 2829 1602 1181 .576
Davey Johnson 14 1984 2000 2039 1148 888 .564
Steve O’Neill 14 1935 1954 1879 1040 821 .559
Walter Alston 23 1954 1976 3658 2040 1613 .558
Bobby Cox 29 1978 2010 4508 2504 2001 .556
Miller Huggins 17 1913 1929 2570 1413 1134 .555
Billy Martin 16 1969 1988 2267 1253 1013 .553
Charlie Grimm 19 1932 1960 2368 1287 1067 .547
Sparky Anderson 26 1970 1995 4030 2194 1834 .545
Hughie Jennings 16 1907 1925 2203 1184 995 .543
Danny Murtaugh 15 1957 1976 2068 1115 950 .540
Leo Durocher 24 1939 1973 3739 2008 1709 .540
Joe Cronin 15 1933 1947 2315 1236 1055 .540
Joe Torre 29 1977 2010 4329 2326 1997 .538
Tony LaRussa 32 1979 2010 4934 2638 2293 .535
Whitey Herzog 18 1973 1990 2409 1281 1125 .532
Tom Lasorda 21 1976 1996 3041 1599 1439 .526
Bill McKechnie 25 1915 1946 3647 1896 1723 .524
Red Schoendienst 14 1965 1990 1999 1041 955 .522
Clark Griffith 20 1901 1920 2918 1491 1367 .522
Dusty Baker 17 1993 2010 2690 1405 1284 .522
Dick Williams 21 1967 1988 3023 1571 1451 .520
Jack McKeon 15 1973 2005 1952 1011 940 .518
Lou Piniella 23 1986 2010 3548 1835 1713 .517
Ralph Houk 20 1961 1984 3157 1619 1531 .514
Frankie Frisch 16 1933 1951 2246 1138 1078 .514
Bobby Valentine 15 1985 2002 2189 1117 1072 .510
Chuck Dressen 16 1934 1966 1990 1008 973 .509
Casey Stengel 25 1934 1965 3766 1905 1842 .508
Mike Hargrove 16 1991 2007 2363 1188 1173 .503
Felipe Alou 14 1992 2006 2054 1033 1021 .503
Wilbert Robinson 19 1902 1931 2819 1399 1398 .500
Art Howe 14 1989 2004 2266 1129 1137 .498
Jim Leyland 19 1986 2010 3013 1493 1518 .496
Chuck Tanner 19 1970 1988 2738 1352 1381 .495
Bruce Bochy 16 1995 2010 2574 1274 1300 .495
Bucky Harris 29 1924 1956 4410 2158 2219 .493
Lou Boudreau 16 1942 1960 2404 1162 1224 .487
Connie Mack 53 1894 1950 7755 3731 3948 .486
John McNamara 19 1969 1996 2395 1160 1233 .485
Bill Rigney 18 1956 1976 2561 1239 1321 .484
Jim Fregosi 15 1978 2000 2123 1028 1095 .484
Gene Mauch 26 1960 1987 3942 1902 2037 .483
Tom Kelly 16 1986 2001 2386 1140 1244 .478
Jimmy Dykes 21 1934 1961 2962 1406 1541 .477
Frank Robinson 16 1975 2006 2242 1065 1176 .475

Provided by Baseball-Reference.com: View Original Table
Generated 10/6/2010.

I will take a stab at assessing the “greatness” of the top ten in a future post.

The Yankees’ 2010 Season, in One Graph

Here:


The Yankees’ season didn’t fall apart until September 5. Despite some ups and downs, the Yankees’ season record stood at .632 after the game of Saturday, September 4. At that point, the Yankees had a lead of 2.5 games — their largest lead since July 26.

And then the bottom dropped out. The Yankees went 9-17 (.346) in the last four weeks of the season, finishing second in the AL East, with a final record of .586. The “stretch drive” was just too much for New York’s aging position players and shaky pitching staff.

The End of a Dynasty

UPDATED

The Yankees’ recent record [written 09/26/10] — 4 straight losses, 6-12 in the past three weeks, .529 since the All-Star break — suggests that their third dynasty may be drawing to a close [but not quite, see below]. It would be unsurprising if that turns out to be so. Where are the replacements for Jeter, Posada, Pettitte, and Rivera, whose average age is 38? A-Rod is close behind, at 34, and not the A-Rod of a few years ago. Tex, at 30, is on the cusp of decline, and his numbers show it. Of the younger generation of position players, only Robinson Cano exudes star quality. Curtis Granderson is no Bernie Williams; Nick Swisher, no Paul O’Neill.

The only reliable starter is CC Sabathia. A.J. Burnett and Javier Vasquez don’t belong on a championship-calibre team. Phil Hughes isn’t convincing, despite his 17 wins. The bullpen reminds me of a rowboat in a hurricane. Even Mariano has become a question mark.

Given the evident dearth of outstanding young players, the end of the present dynasty seems to be in sight — or perhaps visible in the rear-view mirror. The 2009 World Series may have marked the end of Yankees Dynasty III.

Dynasty I lasted from 1921, the year of the Yankees’ first AL championship, to 1964, the year of their 29th AL championship. There were some “down” years sprinkled throughout the period — most notably, 1925, the year of the Babe’s big stomach ache, when the Yankees finished seventh in the days of the eight-team league. But the Yankees never went more than four seasons without a pennant, and finished below third (in eight- and ten-team leagues) only twice. Overall record in 44 seasons: 29 league championships and 20 World Series championships.

Dynasty II lasted only six seasons: 1976-1981. The Yankees led their division in four of those years, and wound up with the AL crown in 1981, despite an overall fourth-place finish, thanks to the split season (due to a players’ strike) and a post-season playoff to determine the division winner. Overall record in six seasons: 5 division championships, 4 league championships, and 2 World Series championships.

Dynasty III (on the current evidence) lasted 16 19 seasons: 1994-2009 2012. Overall record: 14 17 appearances in post-season play, 12 14 division championships, 7 league championships, and 5 World Series championships. (Don’t forget that in 1994 the Yankees had no opportunity to compete for a league or World Series championship because a players’ strike wiped out post-season play.) That’s a lot better than Dynasty II and a lot worse than Dynasty I.

In the following graph [updated to include the 2011-13 seasons], the black line indicates the Yankees’ finishes in the American League (1901-1968) or Eastern Division of the AL (1969-2013). The red, horizontal bars indicate the number of teams in the league or division, for each season. The blue shading highlights the years of the Yankees’ dynasties, to date. It looks like the end for Dynasty III — and end that coincides with the retirements of Mariano Rivera and Andy Pettite, the final declines of Jeter and A-Rod.

Team W-L Histories: 1901-2009

In the course of preparing the three preceding posts, I compiled the table below. Note that the American League’s overall record is slightly better than the National League’s. That’s because of the AL’s edge in interleague play, which continues into 2010.

Won-Lost records, 1901-2009
(franchise histories at bottom of table)
National League
Team Games Won Lost W-L%
Giants 16994 9070 7834 .537
Dodgers 16995 8841 8065 .523
Cardinals 17006 8774 8128 .519
Pirates 16993 8607 8292 .509
Cubs 17012 8545 8367 .505
Reds 17010 8484 8436 .501
Diamondbacks 1944 970 974 .499
Astros 7652 3812 3835 .498
Braves 16983 8168 8708 .484
Mets 7644 3655 3981 .479
Marlins 2686 1283 1403 .478
Nationals 6511 3098 3409 .476
Rockies 2692 1281 1411 .476
Phillies 16955 7830 9051 .464
Padres 6518 3008 3508 .462
Brewers 1943 889 1053 .458
NL totals 173538 86315 86455 .4996
American League
Team Games Won Lost W-L%
Yankees 16962 9575 7294 .568
Red Sox 16973 8730 8160 .517
Indians 16987 8622 8274 .510
Tigers 17013 8564 8356 .506
White Sox 16982 8540 8339 .506
Angels 7811 3887 3921 .498
Blue Jays 5224 2589 2632 .496
Athletics 16947 8189 8671 .486
Royals 6505 3143 3360 .483
Twins 16995 8138 8748 .482
Brewers 4570 2200 2367 .482
Orioles 16986 8013 8863 .475
Mariners 5223 2461 2760 .471
Rangers 7797 3657 4134 .469
Rays 1941 826 1115 .426
AL totals 174916 87134 86994 .5004
Franchise histories:
National League
Giants in San Francisco, 1958- ; in New York (also as Gothams), 1883-1957
Dodgers in Los Angeles, 1958 – ; in Brooklyn (also as Robins, Bridegrooms, Grooms), 1890-1957); previously in American Association (as Bridegrooms, Grays, Atlantics), 1884-1889
Cardinals in St. Louis (also as Perfectos, Browns), 1892- ; previously in American Association (as Browns, Brown Stockings), 1882-1891
Pirates in Pittsburgh (also as Alleghenys), 1887- ; previously in American Association (as Alleghenys), 1882-1886
Cubs in Chicago (also as Orphans, Colts, White Stockings), 1876-
Reds in Cincinnati (also as Redlegs), 1890- ; previously in American Association (as Red Stockings), 1882-1889
Diamondbacks in Arizona (Phoenix), 1998-
Astros in Houston (also as Colt .45’s), 1962-
Braves in Atlanta, 1966- ; in Milwaukee, 1953-1965; in Boston (also as Bees, Rustlers, Doves, Beaneaters, Red Caps), 1876-1952
Mets in New York, 1962-
Marlins in Florida (Miami), 1993-
Nationals in Washington, 2005- ; in Montreal (as Expos), 1969-2004
Rockies in Colorado (Denver), 1993-
Phillies in Philadelphia (also as Quakers), 1883-
Padres in San Diego, 1969-
Brewers in Milwaukee, 1998- (see AL entry for previous history)
American League
Yankees in New York (also as Highlanders), 1903- ; in Baltimore (as Orioles), 1901-1902
Red Sox in Boston (also as Americans), 1901-
Indians in Cleveland (also as Naps, Bronchos, Blues), 1901-
Tigers in Detroit, 1901-
White Sox in Chicago, 1901-
Angels in Anaheim, 1961- , but indentified variously as Los Angeles Angels of Anaheim, Anaheim Angels, California Angels, Los Angeles Angels
Blue Jays in Toronto, 1977-
Athletics in Oakland, 1968- ; in Kansas City, 1955-1967; in Philadelphia, 1901-1954
Twins in Minnesota (Minneapolis), 1961- ; in Washington (as Senators), 1901-1960
Royals in Kansas City, 1969-
Brewers in Milwaukee, 1970-1997; in Seattle (as Pilots), 1969
Orioles in Baltimore, 1954- ; in St. Louis (as Browns), 1902-1953; in Milwaukee (as Brewers), 1901
Rangers in Texas (Arlington), 1972- ; in Washington (as Senators) 1961-1971
Mariners in Seattle, 1977-
Rays in Tampa Bay (St. Petersburg, also as Devil Rays), 1998-

A Simpler Pythagorean Formula

According to an article posted in the “Bullpen” at Baseball-Reference.com, the Pythagorean Theorem of Baseball

relates the number of runs a team has scored and surrendered to its actual winning percentage….

There are two ways of calculating Pythagorean Winning Percentage (W%). The more commonly used, and simpler version uses an exponent of 2 in the formula.

W%=[(Runs Scored)^2]/[(Runs Scored)^2 + (Runs Allowed)^2]

More accurate versions of the formula use 1.81 or 1.83 as the exponent.

W%=[(Runs Scored)^1.81]/[(Runs Scored)^1.81 + (Runs Allowed)^1.81]

An analysis of statistics available at Baseball-Reference.com, which include expected W%, yields the following straightforward version of the Pythagorean expectation:

W% = 1.8195*RS% – 0.4098, where

W% = games won/(games won + games lost),

RS% = runs scored/(runs scored + runs allowed), and

* indicates multiplication.

The Pythagorean formula used by Baseball-Reference.com bears a strong resemblance to the long-term (1901-2009) relationship between W% and RS%, which is:

W% = 1.8372*RS% – 0.4191

This equation is no longer accurate, however. Nor is any equation that neglects the evolution of the game through its six “modern” eras: Deadball (1901-1919), Lively Ball I (1920-1941), Wartime Lull (1942-1946), Lively Ball II (1947-1961), High Plateau (1962-1993), and Juiced Player (1994-2xxx). Here are the formulae for each of the six eras:

Deadball

W% = 1.7679 * RS% – 0.3843

Lively Ball I

W% = 1.8965 * RS% – 0.4482

Wartime Lull

W% = 1.7389 * RS% – 0.3686

Lively Ball II

W% = 1.8704*RS% – 0.4377

High Plateau

W% = 1.7521*RS% – 0.3760

Juiced Player

W% = 1.9882*RS% – 0.4940

This final equation seems like the one to use, until there is a marked change in the style of play. Results will vary from year to year, of course. Here, for example, is the equation for 2009:

W% = 1.9419*RS% – 0.4707

Related post: Explaining a Team’s W-L Record

The Six Eras of Baseball

In the preceding post, I identified six eras of “modern” baseball:

1901-1919 — Deadball (“modern”)

1920-1941 — Lively Ball I

1942-1946 — Wartime Lull

1947-1961 — Lively Ball II

1962-1993 — High Plateau

1994-2xxx — Juiced Player

These six eras have distinctive characters, which are captured in the following table:

Change from 1901-1919
Runs per HR per Add’l runs Add’l HR Runs per
Era # Teams game game per game per game add’l HR
1901-1919 16 7.84 0.30
1920-1941 16 9.69 0.97 1.85 0.67 2.76
1942-1946 16 8.14 0.88 0.30 0.58 0.52
1947-1961* 18 8.91 1.62 1.07 1.32 0.81
1962-1993** 26 8.37 1.56 0.53 1.26 0.42
1994-2009*** 30 9.62 1.63 1.78 1.33 1.34
1994-2009 “old 16” 9.73
1901-2009 30 8.82
1901-2009 “old 16” 8.85
* 2 expansion teams in 1961
** 2 expansion teams in 1962; 4 in 1969; 2 in 1977; 2 in 1993
*** 2 expansion teams in 1998

Lively Ball Era I was the most dynamic era to date. There were more home runs than in the Deadball era, to be sure, but it is evident that much of the “small ball” action of the Deadball era carried over into Lively Ball I.

The Wartime Lull was just that. There were more home runs than in the Deadball era, but every home run netted only 0.52 runs on the scoreboard. Think of batters reaching base and mostly waiting around for a home run to be hit, usually to no avail.

The next two eras — Lively Ball II and High Plateau — saw a resurgence of home-run hitting, but run production didn’t return to the level of Lively Ball II. Again, there was a lot of waiting around for home runs, usually to no avail.

The era of the Juiced Player rivals (but falls short of) the dynamism of Lively Ball I. Yes, a lot more home runs per game (what would you expect?), but not quite the same number of runs per game.

I have always had the impression that baseball in the 1920s and 1930s was baseball at its exciting best: power added to the “small ball” wiles of the Deadball era. The numbers seem to confirm that impression.

EXTRA INNINGS:

The runs-per-game figures for the “old 16” teams — the franchises in existence from 1901 through 1960 — suggest that those teams have done better than the expansion upstarts. In fact, for the Juiced Player era (1994-2009), the “old 16” have a W-L record of .512.

But not all of the “old 16” have fared well. Here are the W-L rankings of the “old 16” for the period 1994-2009:

Rank (of 30) Team G W L W-L%
1 NYY 2524 1514 1007 .601
2 ATL 2525 1456 1068 .577
3 BOS 2526 1409 1117 .558
4 CLE 2523 1353 1170 .536
5 STL 2525 1347 1176 .534
7 LAD 2526 1336 1190 .529
9 OAK 2524 1312 1212 .520
10 CHW 2527 1312 1212 .520
11 SFG 2526 1310 1215 .519
14 PHI 2526 1260 1266 .499
17 MIN 2525 1251 1273 .496
19 CIN 2530 1232 1295 .488
20 CHC 2524 1230 1294 .487
24 BAL 2525 1175 1347 .466
27 DET 2526 1108 1418 .439
28 PIT 2523 1091 1431 .433

“Old 16” teams occupy the top five spots and 10 of the top 15 spots. But Baltimore (13 straight losing seasons, 1998-2010), Detroit (12 straight losing seasons, 1994-2005), and Pittsburgh (18 straight losing seasons, 1993-2010) have turned in especially embarrassing performances.

The Lively Ball Eras

It is generally thought that the lively ball era began in 1920. In that year, the number of home runs per major-league game jumped to 0.511, eclipsing the previous “modern” high of 0.411, set in 1911. But the home-run barrage was only beginning in 1920. It jumped to 0.762 per game in 1921 — nearly double the 1911 mark — and continued around a rising trend through the rest of the pre-World War II era:

Despite Babe Ruth’s dominance in the early years of the lively ball era — he hit almost 9 percent of ML home runs in 1920, and more than 6 percent in 1927 — it wasn’t until 1931 that the AL began to outslug the NL every year. But there was plenty of slugging to go around, as the peaks and high valleys of 1930-1941 attest. I attribute the higher home-run output of those years to arrival of a new generation of players, who were selected more often than not for their slugging ability and encouraged to cultivate that ability.

But the real lively ball eras were yet to come:

Following a lull from 1942 through 1946, the home-run barrage resumed in 1947, with the post-war return of slugging veterans and the influx of newcomers raised in the slugging tradition. The second lively ball era peaked in 1961. It subsided with the “era of the pitcher” and the first waves of expansion. But even at its lowest ebb in the 1970s and 1989s, the pace of home-run production exceeded the peaks of the first lively ball era, with only a few exceptions.

Then came 1994 and a third era. This one, sad to say, probably owed its existence not to a “juiced” baseball but to “juiced” baseball players. Given the crackdown on performance-enhancing substances, the rate of home-run production in 2010 (to date) has dropped to that of 1961 — when the “juice” in the game came from a performance-inhibiting substance known as alcohol.

I hereby declare the following eras:

1901-1919 — Deadball (“modern”)

1920-1941 — Lively Ball I

1942-1946 — Wartime Lull

1947-1961 — Lively Ball II

1962-1993 — High Plateau

1994-2xxx — Juiced Player

Future Hall of Famers?

The induction of Andre Dawson into the Hall of Fame provides a new benchmark for admission:

  • a career OPS+* of at least 119 and
  • a career BA of at least .279

By that standard, there are 45 players (past and present) with substantial careers (at least 8,000 plate appearances) who deserve (or will deserve) membership in the Hall of Fame. Here they are, ranked by career OPS+ and then by career BA:

OPS+ rank Player OPS+ BA
1 Barry Bonds 181 .298
2 Frank Thomas 156 .301
3 Manny Ramirez 155 .313
4 Jeff Bagwell 149 .297
5 Edgar Martinez 147 .312
6 Alex Rodriguez 146 .303
7 Jason Giambi 143 .282
8 Vladimir Guerrero 143 .320
9 Chipper Jones 142 .306
10 Gary Sheffield 140 .292
11 Larry Walker 140 .313
12 Todd Helton 138 .324
13 Carlos Delgado 138 .280
14 Bob Johnson 138 .296
15 Will Clark 137 .303
16 Reggie Smith 137 .287
17 Sherry Magee 136 .291
18 Ken Griffey 135 .284
19 Fred McGriff 134 .284
20 Rafael Palmeiro 132 .288
21 Ken Singleton 132 .282
22 Bobby Abreu 130 .296
23 John Olerud 128 .295
24 Keith Hernandez 128 .296
25 Joe Torre 128 .297
26 Ellis Burks 126 .291
27 Bernie Williams 125 .297
28 Bobby Bonilla 124 .279
29 Rusty Staub 124 .279
30 Bob Elliott 124 .289
31 Jimmy Ryan 124 .308
32 Jeff Kent 123 .290
33 Tim Raines 123 .294
34 Cesar Cedeno 123 .285
35 Hal McRae 122 .290
36 Ed Konetchy 122 .281
37 Dave Parker 121 .290
38 Al Oliver 121 .303
39 George Van Haltren 121 .316
40 Harold Baines 120 .289
41 Paul O’Neill 120 .288
42 Jose Cruz 120 .284
43 Derek Jeter 119 .314
44 Mark Grace 119 .303
45 Stan Hack 119 .301

BA rank Player OPS+ BA
1 Todd Helton 138 .324
2 Vladimir Guerrero 143 .320
3 George Van Haltren 121 .316
4 Derek Jeter 119 .314
5 Manny Ramirez 155 .313
6 Larry Walker 140 .313
7 Edgar Martinez 147 .312
8 Jimmy Ryan 124 .308
9 Chipper Jones 142 .306
10 Alex Rodriguez 146 .303
11 Will Clark 137 .303
12 Al Oliver 121 .303
13 Mark Grace 119 .303
14 Frank Thomas 156 .301
15 Stan Hack 119 .301
16 Barry Bonds 181 .298
17 Jeff Bagwell 149 .297
18 Joe Torre 128 .297
19 Bernie Williams 125 .297
20 Bob Johnson 138 .296
21 Bobby Abreu 130 .296
22 Keith Hernandez 128 .296
23 John Olerud 128 .295
24 Tim Raines 123 .294
25 Gary Sheffield 140 .292
26 Sherry Magee 136 .291
27 Ellis Burks 126 .291
28 Jeff Kent 123 .290
29 Hal McRae 122 .290
30 Dave Parker 121 .290
31 Bob Elliott 124 .289
32 Harold Baines 120 .289
33 Rafael Palmeiro 132 .288
34 Paul O’Neill 120 .288
35 Reggie Smith 137 .287
36 Cesar Cedeno 123 .285
37 Ken Griffey 135 .284
38 Fred McGriff 134 .284
39 Jose Cruz 120 .284
40 Jason Giambi 143 .282
41 Ken Singleton 132 .282
42 Ed Konetchy 122 .281
43 Carlos Delgado 138 .280
44 Bobby Bonilla 124 .279
45 Rusty Staub 124 .279

___
* OPS+ is on-base percentage plus slugging average (OPS) adjusted for where and when a batter compiled his statistics.

Statistics derived from the Play Index at Baseball-Reference.com.

The Decline of the Slugger

Are sluggers becoming more or less prevalent?

To answer that question, I went to the Play Index feature of Baseball-Reference.com. I was able to find (thanks to a paid subscription to Play Index) the number of players, by season, with an OPS+ statistic* of 150 or more, from 1901 through 2009. Dividing each season’s number by the number of major-league teams, I obtained the following result:


Observations:

1. There has been a slight but noticeable decline in the average number of players per team with an OPS+ of 150 or more, especially following the second round of expansion in 1969.

2. The surge from 1996 to 2002 probably marks the peak use of performance-enhancing drugs.

3. The decline resumed after 2002.

Thus, for whatever reason(s), slugging seems to be in decline.

__________
* Definition: “OPS+ is OPS [on-base plus slugging percentage] adjusted for the park and the league in which the player played,” where the league average for a given year is 100. Thus “An OPS+ of 150 or more is excellent and 125 very good, while an OPS+ of 75 or below is poor.”

The Vanishing Complete Game

Drawing on statistics available at Baseball-Reference.com, I have plotted complete games as a percentage of games started, by league and for both major leagues, at five-year intervals from 1904 through 2009. (It would have been too cumbersome and not worth the effort to have transcribed the statistics for every season from 1901 through 2010).

The result:


Observations:

The rise of complete games in the American League following the introduction of the designated hitter was a transitory phenomenon.

The statistics for the National League are therefore more indicative of long-term trends.

The complete game has been on the wane since the early 1900s, but the trend has accelerated since 1970. (The use of the logarithmic scale for the vertical axis highlights that acceleration.)

It is likely that the incidence of complete games has reached a minimum, at around three percent of games started. That is to say, the percentage is unlikely to drop further because there will always be those (infrequent) occasions on which a starter is still throwing well and has thrown fewer than 100 pitches as he goes into the eighth and ninth innings of a game in which his team is leading, tied, or only a run or two behind.

A Typical Career Arc for a Batter

It has long been conventional wisdom in baseball that batters hit their peak in their late 20s and go into decline after the age of 30. But inasmuch as this conventional wisdom pre-dates the days of massive computerized databases and spreadsheets, can it be true, or is it the baseball equivalent of an old wives tale?

To answer that question, I went to the Play Index feature of Baseball-Reference.com. I was able to find (thanks to a paid subscription to Play Index) the career OPS+ statistic* for all inactive or retired players from 1901 through 2009 who had at least 3,000 plate appearances. As of yesterday, there were 1,416 such players. I selected 57 of them by the simple (and essentially random) method of picking #1 Babe Ruth (career OPS+ 207) and every 25th batter thereafter: #26 Jeff Bagwell (149), #51 Babe Herman (140, and so on, down to #1401 Bill Kellefer (63). The resulting sample represents great-to-poor batters, players in all eras from 1901 onward, and careers long, short (but not too short), and in between.

I indexed each player’s single-season OPS+ statistics to that player’s career-high OPS+. For example, Babe Ruth’s career looks like this:

Season Age OPS+ Indexed
1914 19 50 0.196
1915 20 189 0.741
1916 21 121 0.475
1917 22 162 0.635
1918 23 194 0.761
1919 24 219 0.859
1920 25 255 1.000
1921 26 239 0.937
1922 27 181 0.710
1923 28 239 0.937
1924 29 220 0.863
1925 30 137 0.537
1926 31 227 0.890
1927 32 226 0.886
1928 33 208 0.816
1929 34 193 0.757
1930 35 211 0.827
1931 36 218 0.855
1932 37 201 0.788
1933 38 176 0.690
1934 39 161 0.631
1935 40 118 0.463

After making the same computation for the other 56 batters, I plotted the indexed values for all batters against age, with the following result:


The ages at which the players peaked (index value of 1.00) range from 22 to 36, but the polynomial curve tells the tale: major-league batters tend to improve gradually as they approach ages 29-30, and then to decline gradually thereafter.

That is a broad generalization, based on a random sample of batters. Even within that sample, and certainly across the entire population of batters, there are many-many exceptions. Babe Ruth is a prominent exception. He peaked at age 25, by the measure of OPS+, declined somewhat, improved somewhat, and did not go into his final decline until the age of 37.

In any event, the conventional wisdom stands up to scrutiny, but (like conventional wisdom about many things) it is a rule of thumb, not an iron-clad law of behavior.
__________
* Definition: “OPS+ is OPS [on-base plus slugging percentage] adjusted for the park and the league in which the player played,” where the league average for a given year is 100. Thus “An OPS+ of 150 or more is excellent and 125 very good, while an OPS+ of 75 or below is poor.”

World Series Contestants: Usually Not the Best Teams

Since the advent of three-tiered postseason play in 1995, a league’s best team has seldom appeared in the World Series. Here’s the tally (National League teams listed first; * indicates winner of World Series):

1995 —
Atlanta Braves (division winner; .625 W-L, best record in NL)*
Cleveland Indians (division winner; .694 W-L, best record in AL)

1996 —
Atlanta Braves (division winner; .593, best in NL)
New York Yankees (division winner; .568, second-best in AL)*

1997 —
Florida Marlins (wild-card team; .568, second-best in NL)*
Cleveland Indians (division winner; .534, fourth-best in AL)

1998–
San Diego Padres (division winner; .605 third-best in NL)
New York Yankees (division winner, .704, best in AL)*

1999–
Atlanta Braves (division winner; .636, best in NL)
New York Yankees (division winner; .605, best in AL)*

2000–
New York Mets (wild-card team; .580, fourth-best in NL)
New York Yankees (division winner; .540, fifth-best in AL)*

2001–
Arizona Diamondbacks (division winner; .568, fourth-best in NL)*
New York Yankees (division winner; .594, third-best in AL)

2002–
San Francisco Giants (wild-card team; .590, fourth-best in NL)
Anaheim Angels (wild-card team; .611, third-best in AL)*

2003–
Florida Marlines (wild-card team; .562, third-best in NL)*
New York Yankees (division winner; .623, best in AL)

2004–
St. Louis Cardinals (division winner; .648, best in NL)
Boston Red Sox (wild-card team; .605, second-best in AL)*

2005–
Houston Astros (wild-card team; .549, third-best in NL)
Chicago White Sox (division winner; .611, best in AL)*

2006–
St. Louis Cardinals (division winner; .516, fifth-best in NL)*
Detroit Tigers (wild-card team; .586, third-best in AL)

2007–
Colorado Rockies (wild-card team; .552, second-best in NL)
Boston Red Sox (division winner; .593, tied for best in AL)*

2008–
Philadelphia Phillies (division winner; .568, second-best in NL)*
Tampa Bay Rays (division winner; .599, second-best in AL)

2009–
Philadelphia Phillies (division winner; .574, second-best in NL)
New York Yankees (division winner; .636, best in AL)*

There you have it. The last year in which the World Series featured each league’s best team was 1999. The only other time was in 1995.

Of the 15 Series from 1995 through 2009, 9 were won by the inferior team, as measured by W-L record. Division winners opposed each other in only 6 of the 15 Series.

Wild-card teams appeared in 8 of the 15 Series. With an all wild-card Series in 2002, wild-card teams have occupied almost a third of the 30 Series slots — 9 of 30.

As I have said, the winner of the World Series can claim nothing more than having been the better team over a span of four to seven games.

Explaining a Team’s W-L Record

According to Baseball-Reference.com:

The Pythagorean Theorem of Baseball is a creation of Bill James which relates the number of runs a team has scored and surrendered to its actual winning percentage, based on the idea that runs scored/runs allowed is a better indicator of a team’s (future) performance than a team’s actual winning percentage. This results in a formula which is referred to as Pythagorean Winning Percentage….

There are two ways of calculating Pythagorean Winning Percentage (W%). The more commonly used, and simpler version uses an exponent of 2 in the formula.

W%=[(Runs Scored)^2]/[(Runs Scored)^2 + (Runs Allowed)^2]

More accurate versions of the formula use 1.81 or 1.83 as the exponent.

W%=[(Runs Scored)^1.81]/[(Runs Scored)^1.81 + (Runs Allowed)^1.81]

Expected W-L can then be obtained by multiplying W% by the team’s total number of games played, then rounding off….

The rationale behind Pythagorean Winning Percentage is that, while winning as many games as possible is still the ultimate goal of a baseball team, a team’s run differential (once a sufficient number of games have been played) provides a better idea of how well a team is actually playing. Therefore, barring personnel issues (injuries, trades), a team’s actual W-L record will approach the Pythagorean Expected W-L record over time, not the other way around. Expected W-L is almost always within 3 games of actual W-L at the end of a season (although a recent exception is the 2005 and 2007 Arizona Diamondbacks, who both beat their expected W-L by 11 games). Deviations from expected W-L are often attributed to the quality of a team’s bullpen, or more dubiously, “clutch play”; many sabermetrics advocates believe the deviations are the result of luck and random chance.

I agree with those who say that deviations reflect the quality of a team’s bullpen. A more precise formula can be obtained by regressing winning percentage on two explanatory variables: RFA (runs scored/[runs scored + runs allowed]) and saves recorded by a team’s bullpen. The result for the American League in 2008:

W-L percentage (expressed as a decimal fraction) = -0.44595 + 1.66556 x RFA + 0.002747 x saves

Adjusted R-squared: 0.899; standard error: 0.022 (i.e., 2.2 percentage points); t-statistics on the intercept and coefficients: -4.246, 7.319, 3.763 (all significant above the 0.99 level).

That is, the average American League team (RFA = .506, saves = 41) compiled a W-L percentage of .510. (The AL beat the NL in interleague play, thus enabling the AL as a whole to compile a better-than-.500 average.)

According to the Pythagorean formula, the LA Angels were the lucky recipients of 11 extra wins in 2008; that is, the formula underestimates the Angels’ 2008 wins by 11. The regression equation, on the other hand, underestimates the Angels’ 2008 wins by only 2. Generally, the regression equation (indicated by blue) gives much better results than the Pythagorean formula (indicated by black):


“Luck” is a catch-all term for unexplained variance. It shouldn’t be thrown around as if it has real meaning. In this case, the evidence suggests that a decisive factor in a team’s W-L record is the quality of its bullpen — especially the quality of its closers.

Baseball in the Nation’s Capital, Revisited

Way back in September 2004, before the Montreal Expos became the Washington Nationals, I wrote:

To succeed financially, the new Washington team must draw well from the Maryland and Virginia suburbs. Attendance will be high for a few years, because the closeness of major-league baseball will be a novelty to fans who’ve had to trek to Baltimore to see the increasingly hapless Orioles. But suburbanites’ allegiance to the new Washington team won’t survive more than a few losing seasons — and more than a few seem likely, given the Expos’ track record. As the crowds wane, suburbanites will become increasingly reluctant to journey into the city. And, so, the taxpayers of D.C. (and perhaps the taxpayers of the nation) are likely to be stuck with an expensive memento of false civic pride.

I’m not sure about this year’s attendance, but the trend is almost certain to be downward, given the Nats steady dive toward the bottom of the National League. Here are the Nats’ W-L records from 2005 through yesterday:

2005 – .500 (5th of 5 in their division; tied for 9th in their 16-team league)

2006 – .438 (5th of 5 in their division; 14th in the league)

2007 – .451 (4th of 5 in their division; tied for 11th in the league)

2008 – .366 (5th of 5 in their division; last in the league)

2009. – .345 (5th of 5 in their division; last in the league)

As I’ve said before, D.C. isn’t a baseball town. The teams are jinxed by their non-fans.

Maddux to the Hall?

Greg Maddux, who is about to announce his retirement from baseball, is a cinch for election to the Hall of Fame: 355 wins, .610 winning average, ERA+ of 132. But Maddux, like recently-retired Mike Mussina, shouldn’t be ranked with the “immortals” — the 16 Hall of Fame pitchers whose excellence, in my view, ranks them above their peers. (See this post and this post for relevant background.)

Maddux had only two 20-win seasons, which is why he isn’t an “immortal” pitcher, in my book. Roger Clemens, Maddux’s contemporary, had six 20-win seasons (in addition to his 354 wins, .658 winning average, ERA+ of 143), which would make him an “immortal” but for the strong suspicion that his career totals were inflated by steroids and HGH. (It is, by the way, a strong suspicion that cannot be confirmed by statistical evidence.)

P.S. (12/08/08) The election of Joe Gordon to the Hall of Fame is a joke, by my reckoning.

Mussina to the Hall?

I once opined that a

Hall of Fame [starting] pitcher will have

  • at least 300 wins
  • or, at least 250 wins and an ERA+ of 120 or higher. (Go here and scroll down for the definition of ERA+.)
  • or, at least 200 wins and a W-L average of .600 or better and an ERA+ of 120 or higher.

I opined, further, that an ” ‘immortal’ pitcher will have at least 250 wins, a winning average of at least .600, and an ERA+ of at least 120.”

Well, it turns out that, by my definition, Mike Mussina qualifies as an “immortal”: 270 wins, a winning average of .638, and an ERA+ of 123. Not so fast.

Mussina, who has just announced his retirement, deserves to be in the Hall of Fame; I have no quibble with his qualifications on that score. But Mussina doesn’t strike me as an “immortal,” which is an honor that I would reserve for these starting pitchers:

Pete Alexander
John Clarkson
Bob Feller
Lefty Grove
Carl Hubbell
Walter Johnson
Tim Keefe
Christy Mathewson
Kid Nichols
Jim Palmer
Eddie Plank
Charley Radbourn
Tom Seaver
Cy Young

Accordingly, I must add another criterion for “immortality” among starting pitchers: at least five seasons with 20 or more wins. Mussina had only one such season: his last.

If — in this era of the relief pitcher — there is never another “immortal” starting pitcher, so be it. Tom Seaver will then have the honor of being the last of the breed.