Vulgar Keynesianism and Capitalism

A REISSUE (WITHOUT UPDATES) OF THE ORIGINAL POST DATED DECEMBER 4, 2011

Robert Higgs quite rightly disparages “vulgar Keynesianism”:

Most of the people who purport to possess expertise about the economy rely on a common set of presuppositions and modes of thinking. I call this pseudo-intellectual mishmash vulgar Keynesianism. It’s the same claptrap that has passed for economic wisdom in this country for more than fifty years and seems to have originated in the first edition of Paul Samuelson’s Economics (1948), the best-selling economics textbook of all time and the one from which a plurality of several generations of college students acquired whatever they knew about economic analysis. Long ago, this view seeped into educated discourse and writing in the news media and in politics and established itself as an orthodoxy.

Unfortunately, this way of thinking about the economy’s operation, particularly its overall fluctuations, is a tissue of errors of both commission and omission. Most unfortunate have been the policy implications derived from this mode of thinking, above all the notion that the government can and should use fiscal and monetary policies to control the macroeconomy and stabilize its fluctuations. Despite having originated more than half a century ago, this view seems to be as vital in 2009 as it was in 1949.

Higgs then dissects “the six most egregious aspects of this unfortunate approach to understanding and dealing with economic booms and busts.” These are the aggregation of myriad and disparate economic actions, failure to take into account changes in relative prices, misunderstanding of the meaning and economic role of interest rates, disregard for the importance of capital, blind “money pumping” as a “solution” to recessions, and disregard for the disincentivizing effects of government activism on the private sector.

I agree with everything said by Higgs, and I have said many of the same things (in my own way) at this blog and its predecessor.  However, GDP — an aggregate measure of economic activity — is a useful construct, as flawed as it may be. It is an indicator of the general direction and magnitude of economic activity. Other aggregate measures — such as employment, jobs added and lost, unemployment rate — are also useful in that regard. If, for example, constant-dollar GDP per capita was twice as high in 2010 than it was 40 years earlier, in 1970 (computed here), it indicates that most Americans enjoyed a significantly higher standard of living in 2010 than they and their predecessors did in 1970. Further, the difference is so significant that it overshadows the difficulty of aggregating the value of billions of disparate transactions and separating the effects of price inflation from quality improvements.

What is special about 1970? It marks a turning point in the economic history of the U.S., which I discussed in a post that is now two-and-a-half years old:

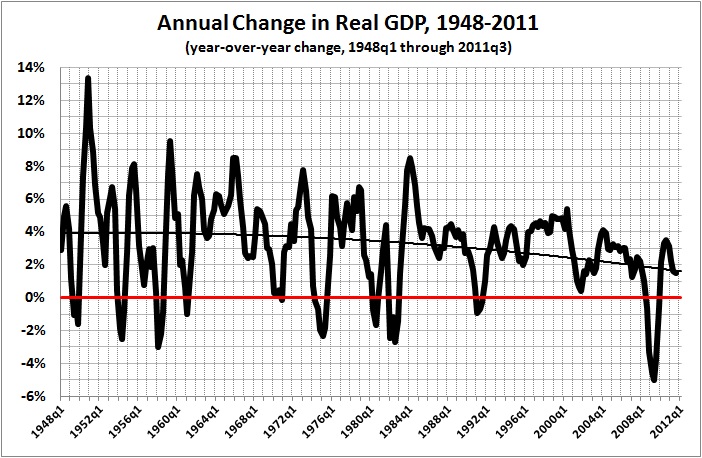
Can we measure the price of government intervention [in the economy]? I believe that we can do so, and quite easily. The tale can be told in three graphs, all derived from constant-dollar GDP estimates available here. The numbers plotted in each graph exclude GDP estimates for the years in which the U.S. was involved in or demobilizing from major wars, namely, 1861-65, 1918-19, and 1941-46. GDP values for those years — especially for the peak years of World War II — present a distorted picture of economic output….

The trend line in the first graph indicates annual growth of about 3.7 percent over the long run, with obviously large deviations around the trend. The second graph contrasts economic growth through 1907 with economic growth since: 4.2 percent vs. 3.6 percent. But lest you believe that the economy of the U.S. somehow began to “age” in the early 1900s, consider the story implicit in the third graph:

  • 1790-1861 — annual growth of 4.1 percent — a booming young economy, probably at its freest
  • 1866-1907 — annual growth of 4.3 percent — a robust economy, fueled by (mostly) laissez-faire policies and the concomitant rise of technological innovation and entrepreneurship
  • 1908-1929 — annual growth of 2.2 percent — a dispirited economy, shackled by the fruits of “progressivism” (e.g., trust-busting, regulation, the income tax, the Fed) and the government interventions that provoked and prolonged the Great Depression (see links in third paragraph)
  • 1970-2008 — annual growth of 3.1 percent –  [2.8 percent for 1970-2010] an economy sagging under the cumulative weight of “progressivism,” New Deal legislation, LBJ’s “Great Society” (with its legacy of the ever-expanding and oppressive welfare/transfer-payment schemes: Medicare, Medicaid, a more generous package of Social Security benefits), and an ever-growing mountain of regulatory restrictions.

Taking the period 1970-2010 as a distinctive era — that of the full-fledged regulatory-welfare state — it may be possible to discern some aggregate relationships that were stable during that era (and may well continue to hold). The relationship that I want to explore is suggested by Higgs’s discussion of the vulgar Keynesian view of aggregate demand and the role of capital in economic production:

Because the vulgar Keynesian has no conception of the economy’s structure of output, he cannot conceive of how an expansion of demand along certain lines but not along others might be problematic. In his view, one cannot have, say, too many houses and apartments. Increasing the spending for houses and apartments is, he thinks, always good whenever the economy has unemployed resources, regardless of how many houses and apartments now stand vacant and regardless of what specific kinds of resources are unemployed and where they are located in this vast land. Although the unemployed laborers may be skilled silver miners in Idaho, it is supposedly still a good thing if somehow the demand for condos is increased in Palm Beach, because for the vulgar Keynesian, there are no individual classes of laborers or separate labor markets: labor is labor is labor. If someone, whatever his skills, preferences, or location, is unemployed, then, in this framework of thought, we may expect to put him back to work by increasing aggregate demand, regardless of what we happen to spend the money for, whether it be cosmetics or computers.

This stark simplicity exists, you see, because aggregate output is a simple increasing function of aggregate labor employed:

Q = f (L), where dQ/dL > 0.

Note that this “aggregate production function” has only one input, aggregate labor. The workers seemingly produce without the aid of capital! If pressed, the vulgar Keynesian admits that the workers use capital, but he insists that the capital stock may be taken as “given” and fixed in the short run. And ― which is highly important ― his whole apparatus of thought is intended exclusively to help him understand this short run. In the long run, he may insist, we are, as Keynes quipped, “all dead”; or he may simply deny that the long run is what we get when we place a series of short runs back to back. The vulgar Keynesian in effect treats living for the moment, and only for it, as a major virtue. At any given time, the future may safely be left to take care of itself.

In fact, the Keynesian-Marxian view of capital is about 180 degrees from the truth:

1. A broad array of capital goods (e.g., metal presses and railroad cars) will produce the same outputs (e.g., auto body parts of a certain quality and a certain number of passenger-miles) despite wide variations in the intelligence, education, and motor skills of their operators.

2. That is to say, capital leverages labor (especially unskilled labor).

3. Rewards justifiably — if unpredictably — flow to those who invent capital goods, innovate improvements in capital goods, invest in the production of such goods, and take the risk of owning businesses that use such goods in the production of consumer goods and services.

4. The activities of those inventors, innovators, investors, and entrepreneurs constitute a form of labor, but it is a very special form. It is not the brute force kind of labor envisaged by Marx and his intellectual progeny. It is a kind of labor that involves mental acuity, special knowledge, a penchant for risk-taking, and — yes, at times — hard work.

Without capital, labor would produce far less than it does. Capital, by the same token, enables labor of a given quality to produce more than it otherwise would.

(By “invest in the production of capital goods,” I mean to include individuals whose saving — whether or not it goes directly into the purchases of stocks and corporate bonds — helps to fund the purchases of capital goods by businesses.)

With that in mind, look at the aggregate relationship between the stock of private non-residential capital and private-sector GDP (GDP – G) for the period 1970-2010:

GDP - G vs net private capital stock, 1970-2010
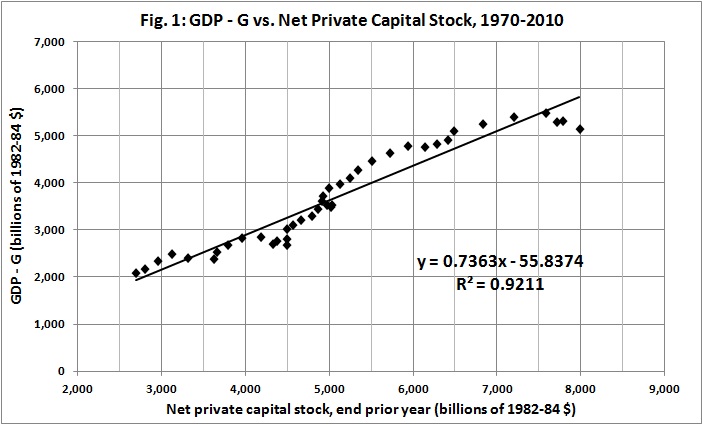
Notes:  Current-dollar values for GDP and G are from Bureau of Economic Analysis, Table 1.1.5. Gross Domestic Product (available here). Capital stock estimates are from Bureau of Economic Analysis, Table 4.1. Current-Cost Net Stock of Private Nonresidential Fixed Assets by Industry Group and Legal Form of Organization (available here). Current-dollar values for GDP – G and capital stock were adjusted to 1982-84 dollars by constructing and applying deflators from CPI-U statistics for 1913-present (available here).

Variations around the trend line indicate fluctuations in economic activity. I treat the difference between “actual” GDP and the trend line as a residual to be explained by factors other than the aggregate value of the private, nonresidential capital stock. Measures of employment or unemployment will not do the job; they are simply proxies for aggregate output. The best measure that I have found is the value of new investment in the current year, relative to the value of the capital stock at the end of the prior year:

Residual vs new invest per PY capital stock
Notes: Residual GDP – G derived from Fig. 1, as discussed in text. Estimates of new investment in private capital stock are from Bureau of Economic Analysis, Table 4.7. Investment in Private Nonresidential Fixed Assets by Industry Group and Legal Form of Organization (available here); adjusted for inflation as discussed in notes for Fig. 1.

Using the trendline equation from Fig. 2, I adjusted the estimates derived from the trendline equation of Fig. 1, with this result:

Adjusted GDP - G vs. net private capital stock

There is precious little for labor to do but to show up for work and apply itself to the tools provided by capitalism:

Change in priv emply vs change in real GDP

*   *   *

Knowledgeable readers will understand that I have taken some statistical liberties. And I have done so as a way of satirizing the view that prosperity depends on labor and its correlate, consumption spending. But my point is a serious one: Capital should not be denigrated. Those who denigrate it give aid and comfort to the enemies of economic growth, that is, to the “progressives” who are the real enemies of the poor, of labor, and of liberty.

Why Are Interest Rates So Low?

A REISSUE (WITHOUT UPDATES) OF THE ORIGINAL POST DATED DECEMBER 7, 2011

Interest rates reflect the supply of and demand for funds. Money is tighter now than it was in the years immediately before the onset of the Great Recession. Tim Congdon explains:

In the three years to October 2008, the quantity of money soared from $10,032 billion to $14,186 billion, with a compound annual growth rate of just over 12 per cent. The money growth rate in this period was the highest since the early 1970s. Indeed, 1972 and 1973 had many similarities to 2006 and 2007, with bubbling asset markets, buoyant consumer spending and incipient inflationary pressures. On the other hand, in the three years from October 2008 the quantity of money was virtually unchanged. (It stood at $14,340 billion in October 2011.) In other words, in the three years of the Great Recession the quantity of money did not increase at all.

But if money is relatively tight, why are interest rates so low? For example, as of October 2011, year-over-year inflation stood at 3.53 percent (derived from CPI-U estimates, available here). In October, Aaa bond yields averaged 3.98 percent, for a real rate of about 0.4 percent; Baa bond yields averaged 5.37 percent, for a real rate of about 1.8 percent; and conventional mortgages averaged 4.07 percent, for a real rate of about 0.5 percent. By contrast, in 1990-2000, when the CPI-U rose at an annual rate of 3.4 percent, real Aaa, Baa, and conventional mortgage rates hovered in the 4-6 percent range. (Real rates are derived from interest rate statistics available here.)

The reason for these (and other) low rates is that borrowers have become less keen about borrowing; that is, they lack confidence about future prospects for income (in the case of households) and returns on investment (in the case of businesses). Why should that be?

If the post-World War II trend is any indication — and I believe that it is — the American economy is sinking into stagnation. Here is the long view:

  • 1790-1861 — annual growth of 4.1 percent — a booming young economy, probably at its freest
  • 1866-1907 — annual growth of 4.3 percent — a robust economy, fueled by (mostly) laissez-faire policies and the concomitant rise of technological innovation and entrepreneurship
  • 1970-2010 — annual growth of 2.8 percent – sagging under the cumulative weight of “progressivism,” New Deal legislation, LBJ’s “Great Society” (with its legacy of the ever-expanding and oppressive welfare/transfer-payment schemes: Medicare, Medicaid, a more generous package of Social Security benefits), and an ever-growing mountain of regulatory restrictions.

(From this post, as updated in this one.)

And here is the post-World War II view:

Annual change in real GDP 1948-2011

This trend cannot be reversed by infusions of “stimulus spending” or “quantitative easing.” It reflects an underlying problem that cannot be cured by those simplistic macroeconomic “fixes.”

The underlying problem is not “tight money,” it is that American businesses are rightly pessimistic about an economic future that is dominated by a mountain of debt (in the form of promised “entitlements”) and by an ever-growing regulatory burden. Thus business investment has been a decline fraction of private-sector GDP:

Non-household GPDI fraction GDP - G
Derived from Bureau of Economic Analysis, Table 1.1.5. Gross Domestic Product (available here). The numerator is gross private domestic investment (GPDI, line 7) less the residential portion (line 12). The denominator is GDP (line 1) less government consumption expenditures and gross investment (line 21).

As long as business remains (rightly) pessimistic about the twin burdens of debt and regulation, the economy will sink deeper into stagnation. The only way to overcome that pessimism is to scale back “entitlements” and regulations, and to do so promptly and drastically.

In sum, the present focus on — and debate about — conventional macroeconomic “fixes” (fiscal vs. monetary policy) is entirely misguided. Today’s economists and policy-makers should consult Hayek, not Keynes or Friedman or their intellectual descendants. If economists and policy-makers would would read and heed Hayek — the Hayek of 1944 onward, in particular — they would understand that our present and future economic morass is entirely political in origin: Failed government policies have led to more failed government policies, which have shackled both the economy and the people.

Economic and political freedoms are indivisible. It will take the repeal of the regulatory-welfare state to restore prosperity and liberty to the land.

Obamanomics: A Report Card (Updated)

Here.

Not-So-Random Thoughts (VIII)

Links to the other posts in this occasional series may be found at “Favorite Posts,” just below the list of topics.

I begin with a post of mine, “Civil Society and Homosexual ‘Marriage’“:

[A]s sure as the sun sets in the west, the state will begin to apply the equal protection clause of the Fourteenth Amendment in order to protect homosexual “marriage” from its critics. Acting under the rubric of “civil rights” — and  in keeping with the way that anti-discrimination laws have been applied to date — the state will deal harshly with employers, landlords, and clergy who seem to discriminate against homosexual “marriage” and its participants.

And right on schedule:

[T]he New Mexico Supreme Court has found that a photographer who declined to photograph a gay “wedding” was at fault… (Tom Trinko, “New Mexico Takes a Stab at Nullifying the Constitution,” American Thinker, August 25, 2013)

See also my post “Abortion, ‘Gay Rights,” and Liberty.

*****

Keir Maitland nails the pseudo-libertarian mentality:

Libertarians are being torn apart from within. Two groups are responsible for this: the libertines and the liberal bigots. ‘Liberal bigots’ is a phrase that I have stolen from Peter Hitchens and I am using it to describe a group within the libertarian movement who are more concerned about being politically correct than defending anybody’s right to discriminate. By libertines, I mean simply those who view libertarianism as a rebellion against tradition, hierarchy, morality and authority….

The former, the liberal bigots, in my view are often ‘thin libertarians’ of the worst kind: libertarians who believe in the nonaggression axiom and nothing else. These people can only think in terms of libertarian legal theory and, as cultural Marxists, will defend anybody’s way of life, except, oddly enough, a traditionalist and antiegalitarian way of life. The latter, however, are usually ‘thick libertarians’…. Thick libertarians are libertarians who, in addition to being well-versed in libertarian law, think about how a libertarian society would, could and should function. Thick libertarians judge not only whether or not something is legal, but whether it is conducive to libertarian ends. However, sadly, the modal thick libertarian is a libertine: someone who believes that prosperity, happiness and other good ends, for which we all strive, are achieved not through a ‘sensible’ lifestyle but through a relatively reckless one. (“Libertines and Liberal Bigots,” Libertarian Alliance Blog, August 22, 2013)

Maitland’s assessment harmonizes with my own, which I’ve expressed in several posts, including “Defending Liberty against (Pseudo) Libertarians“:

(Pseudo) libertarians like to demonstrate their bogus commitment to liberty by proclaiming loudly their support for unfettered immigration, unfettered speech, unfettered abortion, unfettered same-sex coupling (and legal recognition thereof as “marriage’), and unfettered you-name-it.. In the minds of these moral relativists, liberty is a dream world where anything goes — anything of which they approve, that is….

Another staple of (pseudo) libertarian thought is a slavish devotion to privacy — when that devotion supports a (pseudo) libertarian position. Economists like Caplan and Boudreaux are cagy about abortion. But other (pseudo) libertarians are less so; for example:

I got into a long conversation yesterday with a [Ron] Paul supporter who took me to task for my criticisms of Paul’s positions. For one thing, he insisted, Paul’s position on abortion wasn’t as bad as I made it out, because Paul just thinks abortion is a matter for the states. I pointed out that in my book, saying that states can violate the rights of women [emphasis added] is no more libertarian than saying that the federal government can violate the rights of women.

Whence the “right” to abort an unborn child? Here, according to the same writer:

I do believe that abortion is a liberty protected by the Fourteenth Amendment….

This train of “logic” is in accord with the U.S. Supreme Court’s manufactured “right” to an abortion under the Fourteenth (or was it the Ninth?) Amendment, which I have discussed in various places, including here. All in the name of “privacy.”…

It is no wonder that many (pseudo) libertarians like to call themselves liberaltarians. It is hard to distinguish (pseudo) libertarians from “liberals,” given their shared penchant for decrying and destroying freedom of association and evolved social norms. It is these which underlie the conditions of mutual respect, mutual trust, and forbearance that enable human beings to coexist peacefully and cooperatively. That is to say, in liberty.

*****

A recent foray into constitutional issues unearthed this commentary about the opinion delivered by Chief Justice Roberts in the case of Obamacare:

Oh, how far we’ve deviated from our Founders in just over 200 years.

The entire country is pouring over an incoherent, internally contradictory, ill-conceived and politically motivated decision by Chief Justice Roberts, which grants Congress the power to regulate anything that moves and the power to tax anything that moves and anything that doesn’t move….

If we take the reasoning of Roberts to its logical conclusion, Congress would be able to coerce individuals to buy broccoli once a week, so long as they levy a tax on those who fail to comply with the law.  Putting aside the facial absurdity of Roberts’s tax power jurisprudence, his opinion on the Commerce Clause is nothing to cheer.  While Roberts clearly stated that the Commerce Clause does not grant the federal government the right to regulate inactivity (although it can evidently tax inactivity), he obliquely upheld their authority to regulate any activity under that misconstrued clause.

Amidst the garrulous analysis from the conservative pundit class on the Roberts decision, there is a one-page dissent from Justice Thomas (in addition to his joint dissent with the other 3 conservatives) that has been overlooked….

Take a look at this paragraph from Thomas’s dissent (last two-pages of pdf):

I dissent for the reasons stated in our joint opinion, but I write separately to say a word about the Commerce Clause. The joint dissent and THE CHIEF JUSTICE cor­rectly apply our precedents to conclude that the Individual Mandate is beyond the power granted to Congress under the Commerce Clause and the Necessary and Proper Clause. Under those precedents, Congress may regulate“economic activity [that] substantially affects interstate commerce.” United States v. Lopez, 514 U. S. 549, 560 (1995). I adhere to my view that “the very notion of a ‘substantial effects’ test under the Commerce Clause is inconsistent with the original understanding of Congress’ powers and with this Court’s early Commerce Clause cases.” United States v. Morrison, 529 U. S. 598, 627 (2000) (THOMAS, J., concurring); see also Lopez, supra, at 584–602 (THOMAS, J., concurring); Gonzales v. Raich, 545

….

Justice Thomas is hearkening back to the Founders.  Not only is every word of Obamacare unconstitutional and an anathema to every tenet of our founding, most of the other programs created in recent years are as well.  The fact that Roberts said the Commerce Clause and the Necessary and Proper Clause don’t apply to inactivity is not a victory for constitutional conservatives.  The implicit notion that the federal government can regulate any activity is appalling to conservatives.

Here’s what James Madison had to say about the Commerce Clause in a letter to Joseph C. Cabell in 1829:

For a like reason, I made no reference to the “power to regulate commerce among the several States.” I always foresaw that difficulties might be started in relation to that power which could not be fully explained without recurring to views of it, which, however just, might give birth to specious though unsound objections. Being in the same terms with the power over foreign commerce, the same extent, if taken literally, would belong to it. Yet it is very certain that it grew out of the abuse of the power by the importing States in taxing the non-importing, and was intended as a negative and preventive provision against injustice among the States themselves, rather than as a power to be used for the positive purposes of the General Government, in which alone, however, the remedial power could be lodged.

….

The reality is that not only is Obamacare unconstitutional, almost every discretionary department, welfare program, and entitlement program is unconstitutional…. (Daniel Horowitz, “Thomas Dissents: It’s All Unconstitutional,” RedState (Member Diary), June 29, 2012)

On the general issue of the subversion of constitutional limits on governmental power, see “The Constitution: Original Meaning, Corruption, and Restoration.” Specifically related to Obamacare and the individual mandate: “The Unconstitutionality of the Individual Mandate,” “Does the Power to Tax Give Congress Unlimited Power?,” “Does Congress Have the Power to Regulate Inactivity?,” and “Obamacare: Neither Necessary nor Proper.”

*****

Also from RedState, a story that reads in part:

Sadly, we have deviated from our constitutional form of government over the past century.  That’s why Mark Levin has written The Liberty Amendments, a set of proposed constitutional amendments that will unambiguously downsize the federal government by targeting specific loopholes that have allowed the statists to adulterate our Constitution.  Far from this being a radically new vision, Levin proves – through founding documents and floor debates at the Constitutional Congress – how his ideas are in line with what the Founders envisioned in our Federal government.  It’s just that after years of deviating from the Constitution, it has become clear that we need very specific limitations on federal abuses – abuses that have gone far beyond the imagination of our Founders – in order to restore the Republic. (Daniel Horowitz, “Mark Levin’s Liberty Amendments,” Red State (Member Diary), August 13, 2013)

The story includes a good summary of Levin’s amendments. Recommended reading.

A New, New Constitution” covers the same ground, and more. It’s long, but it closes a lot of loopholes that have been opened by legislative, executive, and judicial action.

*****

I turn, finally, to a pair of items by James Pethokoukis with self-explanatory titles: “The Great Stagnation: JP Morgan Declares US Potential GDP Growth Just Half of What It Used to Be” (AEIdeas, August 12, 2013) and “Why Wall Street Thinks the Future Isn’t What It Used to Be” (AEIdeas, August 13, 2013). Read those pieces, and then go to “The Stagnation Thesis” (and follow the links therein) and “Why Are Interest Rates So Low?” (which is replete with more links). The latter post concludes with this:

As long as business remains (rightly) pessimistic about the twin burdens of debt and regulation, the economy will sink deeper into stagnation. The only way to overcome that pessimism is to scale back “entitlements” and regulations, and to do so promptly and drastically.

In sum, the present focus on — and debate about — conventional macroeconomic “fixes” (fiscal vs. monetary policy) is entirely misguided. Today’s economists and policy-makers should consult Hayek, not Keynes or Friedman or their intellectual descendants. If economists and policy-makers would would read and heed Hayek — the Hayek of 1944 onward, in particular –  they would understand that our present and future economic morass is entirely political in origin: Failed government policies have led to more failed government policies, which have shackled both the economy and the people.

Economic and political freedoms are indivisible. It will take the repeal of the regulatory-welfare state to restore prosperity and liberty to the land.

Amen.

As for how the regulatory-welfare state might be repealed, read “Restoring Constitutional Government: The Way Ahead.

Economics: A Survey

I have reproduced this post as a separate page. It will always be accessible by clicking the link that appears below the banner.

Until I muster the will to finish a plain-language primer on economics that I began several years ago, this post will have to do. It is an annotated compilation of links to the posts at this blog which, taken together, will enlighten those readers who seek a rounded view of economics, that is, one that is both fundamental and practical. The fundamental posts address the principles of economics without resorting to abstruse mathematical expressions. The practical posts (in the main) address the effects of government policy on economic activity.

Many of the posts cited below are illustrated by statistics that are a few months to several years out of date.  The conclusions remain valid, however.

PRINCIPLES

The place to begin is “Trade.” It explains the benefits of voluntary exchange, which is the essence of economic activity.

Trade, in the jargon of economics, is microeconomic activity. Attempts to aggregate and explain economic activity are called macroeconomics. “Macroeconomics and Microeconomics” addresses the relationship between the two disciplines.

Other foundational posts are “The Rationality Fallacy” and “Income and Diminishing Marginal Utility.” The first exposes an error common among economists, which is to equate wealth maximization and happiness. The second exposes an error common among economists and leftists (but I repeat myself), which is to assume that a person’s marginal utility (gain in happiness) diminishes with income.

A Short Course in Economics” and “Addendum to a Short Course in Economics” state a number of basic propositions about economics and economic behavior. These aren’t rigorous expositions of economic principles, but they will point a neophyte in the right direction — that is, away from the upside-down economics spouted by leftists and “journalists” (but I repeat myself).

Closely related is “The Causes of Economic Growth,” which cuts through the gobbledygook that prevails in academic circles.

All of the above posts are non-mathematical because the principles of economics do not have to be stated mathematically. In fact, the mathematization of economic theory is a scam, as discussed in “Mathematical Economics.” Economics, as a discipline, suffers from “physic envy”; too many of its practitioners believe that a coat of mathematical varnish can turn it into a science. But economics is not a science — or if it is, in is only a “soft science” that relies more on intuition than it does on the scientific method. For more on this subject, see “Science, Axioms, and Economics.”

PRACTICE: THE GENERAL ECONOMIC INFLUENCE OF GOVERNMENT

Minimal government protects citizens from foreign and domestic predators, thus enabling peaceful, mutually beneficial, and voluntary exchange (i.e., free markets). When government goes beyond its minimal role and interferes in the economy it inhibits economic output in three ways. First, government spending and borrowing divert resources from productive uses to (mainly) unproductive and counterproductive ones. Second, taxes penalize success and divert resources from growth-inducing capital creation. Third, regulations inhibit business formation and expansion.  These relationships are explored systematically in “Government in Macroeconomic Perspective.”

You may wish to skip that technical and somewhat plodding post, and go directly to some of my estimates of the scope and economic costs of government intervention. Begin with the qualitative assessment given in “The Real Burden of Government,” then turn to “The Laffer Curve, ‘Fiscal Responsibility,’ and Economic Growth,” “The Commandeered Economy,” “Estimating the Rahn Curve: Or, How Government Inhibits Economic Growth,” “The Mega-Depression,” and “Economic Growth since World War II.” (Another, often overlooked, consequence of government intervention in economic affairs is the resulting diminution of liberty; see, for example, “The Indivisibility of Economic and Social Liberty.”)

The posts cited in the preceding paragraph assess the long-run effects of government interventions. Government policy imposes additional costs in the short run, that is, in the span of years rather than decades. The Federal Reserve, to name the main culprit, can claim responsibility for the Great Depression and the Great Recession, as well as other recessions. See “Mr. Greenspan Doth Protest Too Much,” “The Fed and Business Cycles,” and “Money, Credit, and Economic Fluctuations.”

Then there is a phenomenon known as regime uncertainty, in which entrepreneurship and capital formation are discouraged — temporarily, at least — by the threat of new government interventions. That threat that is more potent now than it has been since the New Deal-Great Society era. I address regime uncertainty in “The Keynesian Fallacy and Regime Uncertainty,” “Regime Uncertainty and the Great Recession,” and “Obamanomics: A Report Card.”

Government interventions in economic affairs are prompted by many interests and impulses — power-seeking, rent-seeking, economic illiteracy, and plain old do-goodism being among them. Among the chief reasons given for interventions is “market failure,” which is among the subjects addressed in “Regulation as Wishful Thinking.” Closely related posts that bear reading are “Socialist Calculation and the Turing Test,” “What Free-Rider Problem?,” and “Don’t Just Stand There, ‘Do Something’.” The political economy of government intervention is treated generally in “Tocqueville’s Prescience” and “Understanding Hayek.” The darker impulses are addressed in “Don’t Use the ‘S’ Word When the ‘F’ Word Will Do.” (The “S” and “F” words are “socialism” and “fascism.”)

Last, but only because I put it here, is the baleful influence of Keynesianism on economic policy. I expose the fallacy of Keynesianism and “stimulus” spending in “The Keynesian Multiplier: Phony Math” and “The True Multiplier.” Also relevant, though superseded by the preceding two posts, are “A Keynesian Fantasy Land,” “Why the Stimulus Failed to Stimulate,” “The Real Multiplier,” “The Real Multiplier (II),” and “Keynesianism: Upside-Down Economics in the Collectivist Cause.”

PRACTICE: SALIENT ISSUES

We’re not through with government, which plays an explicit and implicit role in the following matters (arranged alphabetically):

Government Debt and Deficits. The best posts on this subject were inspired by the Bowles-Simpson Deficit Commission, whose work — flawed as it is — seems to have been ignored. The “can” is still being kicked down the road, and the consequences will be dire. Read on: “The Deficit Commission’s Deficit of Understanding,” “The Bowles-Simpson Report,” “The Bowles-Simpson Band-Aid,” and “America’s Financial Crisis Is Now.”

Income Inequality and Redistribution. Some persons earn more money than other persons because of differences in ability, performance, and the value of their contributions to the well-being of others. This straightforward explanation doesn’t suit idiots like Robert Reich, who are handicapped by economic illiteracy, guilt, and hypocrisy. The inescapable fact of income inequality is often conflated with the so-called “war” on the middle class. (Pending a post on that subject, I refer you to this one by Mark J. Perry.)

I have addressed inequality several times. The brief post, “The Last(?) Word about Income Inequality” provides several links that are worth following. Other posts expose income inequality as a bogus issue and warn of the dire economic consequences of taxing “the rich” more than they are already taxed: “Taxing the Rich,” “More about Taxing the Rich,” “In Defense of the 1%,” and “Progressive Taxation Is Alive and Well in the U.S. of A,” and “How High Should Taxes Be?

If you’re in the mood for a more fundamental treatment of the “inequality problem,” try “Income and Diminishing Marginal Utility,” “Greed, Cosmic Justice, and Social Welfare,” “Positive Rights and Cosmic Justice,” “Utilitarianism, ‘Liberalism,’ and Omniscience,” “Utilitarianism vs. Liberty,” “Accountants of the Soul,” “Rawls Meets Bentham,” “Enough of ‘Social Welfare’,” “Positive Liberty vs. Liberty,” “Social Justice,” “More Social Justice,”  “Luck Egalitarianism and Moral Luck,” and “Utilitarianism and Psychopathy.”

Inflation.  Or the threat of it, seems to be a perennial problem. At root, it is a government problem, as I discuss in “Why Government Spending Is Inherently Inflationary,” “Is Inflation Inevitable?,” and “Does the CPI Understate Inflation?

Interest Rates. Government-induced stagnation, addressed above, reappears in “Why Are Interest Rates So Low?” See also “Bonds for the Long Run?

International Trade and Outsourcing. Start with “Trade” (also cited above) and “Why Outsourcing Is Good: A Simple Lesson for ‘Liberal’ Yuppies.” If you need more, go to “Trade-Deficit Hysteria,” “Trade, Government Spending, and Economic Growth,” and “Gains from Trade.”

Monopoly. It’s a dirty word, on a par with “asbestos.” Monopoly — or the hope of attaining it — is essential to economic growth, as discussed in “Monopoly and the General Welfare.” If you want to see a dysfunctional monopoly, look at government (a central point of “Krugman and Monopoly“). Private monopoly, on the other hand, is preferable to government regulation: “Monopoly: Private Is Better than Public.”

Paternalism. “Libertarian paternalism” is an oxymoron; more accurately, it is dangerous, anti-libertarian treachery. My many posts on the subject begin with an eponymous one, and continue through “The Mind of a Paternalist, Revisited.” Pseudo-libertarians have no corner on paternalism, of course. Witness the wars on smoking and obesity of the past 60 years. My most recent post about paternalism is “Obesity and Statism.” Links to all of my posts on paternalism can be found at “Favorite Posts,” under categories V, VII, X and XI.

Two leading proponents of “libertarian paternalism” are Richard Thaler, an economist, and Cass Sunstein, a law professor and erstwhile “regulatory czar” for Obama. Thaler, given his academic background, might once have been a libertarian, but clearly has lost his way. Sunstein never came close to being one, and is about as anti-libertarian as they come, as you will learn if you read the posts about him, which are listed in category VII of “Favorite Posts.” Begin with this one and continue through this one. See especially (but not exclusively) “Cass Sunstein’s Truly Dangerous Mind.”

Regulation. It is fitting to jump from “Paternalism” to “Regulation,” inasmuch as regulation is paternalism writ huge. Regulation touches every facet of our lives and livelihoods. I have written about it so many times that it is hard to choose a list of representative posts. I began with “Fear of the Free Market — Part I,” and continued with “Part II” and “Part III.” Those three (long) posts make a theoretical and practical case against regulation. “Regulation as Wishful Thinking” makes the same case, though less thoroughly (but in far fewer words). The extent of the regulatory burden, at the federal level, is summarized in “Lay My (Regulatory) Burden Down.” That post includes an estimate of the economic cost of regulation.

“Social Insurance” Schemes.  “Social insurance” is properly called income redistribution. The primary engines of income redistribution — in addition to progressive taxation — are Social Security, Medicare, and Medicaid — as expanded by Obamacare. The monumental government debt that will accrue as a result of these schemes is addressed above, under “Government Debt and Deficits.” I have covered income redistribution, generally, under “Income Inequality and Redistribution.” Posts specifically about “social insurance” schemes include “The Mythical, Magical, Social Security Trust Fund,” “Social Security: The Permanent Solution,” and “Saving Social Security.” Obamacare is treated (not gently) in “Rationing and Health Care,” “The Perils of Nannyism: The Case of Obamacare,” “Health-Care ‘Reform’: The Short of It,”

As a bonus, I offer “Social Security Is Unconstitutional,” “The Unconstitutionality of the Individual Mandate,” “Does the Power to Tax Give Congress Unlimited Power?,” and “Does Congress Have the Power to Regulate Inactivity?.” Yes, Social Security and the individual mandate (along with Medicare and Medicaid) are unconstitutional, various majorities of the Supreme Court to the contrary notwithstanding; no, the power to tax doesn’t give Congress unlimited power (according the Constitution); and no, Congress doesn’t have the constitutional power to regulate inactivity (i.e., to penalize or tax a person for not buying insurance).

Tax Policy. Tax policy is implicated in many of the posts already listed. I also address it, directly, in “Productivity Growth and Tax Cuts,” “A True Flat Tax,” “‘Tax Expenditures’ Are Not Expenditures,” “Taxes: Theft or Duty?,” and “Is Taxation Slavery?” (yes).

Obamanomics: A Report Card (Updated)

Here.

Baseball Statistics and the Consumer Price Index

Faithful readers of this blog will have noticed that I like to invoke baseball when addressing matters far afield from America’s pastime. (See this, this, this, this, this, this, this, this, and this.) It lately occurred to me that baseball statistics, properly understood, illustrate the inherent meaninglessness of the Consumer Price Index (CPI).

What does the CPI purport to measure? The Bureau of Labor Statistics (BLS) — compiler of the index — says that it “is a measure of the average change over time in the prices paid by urban consumers for a market basket of consumer goods and services.” Read that statement carefully. The CPI does not measure the average change in prices of the goods and services purchased by every urban consumer; it measures the prices of a “market basket” of goods and services that is thought to represent the purchases of a “typical” consumer. Further, the composition of that “market basket” is assumed to change, over time, in accordance with the preferences of the “typical” consumer. (There is more about the CPI in the note at the bottom of this post.)

To understand the arbitrariness of the CPI — as regards the construction of the “market basket” and the estimation of the prices of its components — one must read no further than the Bureau’s own list of questions and answers, some of which I have reproduced in the footnote. As a measure of your cost of living — at any time or over time — the CPI is as useful as the statement that the average depth of a swimming pool is 5 feet; a non-swimmer who is 6 feet tall puts himself in danger of drowning if he jumps into the deep end of such a pool.

The BLS nevertheless computes one version CPI back to January 1913. If you believe that prices in 1913 can be compared with prices in 2013, you must believe that baseball statistics yield meaningful comparisons of the performance of contemporary players and the players of bygone years. I enjoy making such comparisons, but I do not endorse their validity. As I will discuss later in this post, my reservations about cross-temporal comparisons of baseball statistics apply also to cross-temporal comparisons of prices.

Let us begin our journey into baseball statistics with three popular measures of batting prowess: batting average (BA), slugging percentage (SLG), and on-base plus slugging (OPS). The “normal” values of these statistics have varied widely:

Average major league batting statistics_1901-2012
Source: League Year-by-Year Batting at Baseball-Reference.com.

Aside from the upward trends of SLG and OPS, which are unsurprising to anyone with a passing knowledge of baseball’s history, the most striking feature of these statistics is their synchronicity. Players (and fans) of the 1920s and 1930s enjoyed an upsurge in BA, SLG, and OPS that was echoed in the 1980s and 1990s. How can the three statistics rise in lockstep when BA usually suffers with emphasis on the long ball (captured in SLG and OPS)? The three statistics can rise in lockstep only because of changes in the conditions of play that allow batters to hit for a better average while also getting more long hits. By the same token, changes in conditions of play can have the opposite effect of causing offensive statistics to fall, across the board. But given constant conditions of play, there usually is a tradeoff between batting average and long hits. A key point, to which I will return, is the essential incommensurability of statistics gathered under different conditions of play (or economic activity).

There are many variations in the conditions of play that have resulted in significant changes in offensive statistics. Among those changes are the use of cleaner and more tightly wound baseballs, the advent of night baseball, better lighting for night games, bigger gloves, lighter bats, bigger and stronger players, the expansion of the major leagues in fits and starts, the size of the strike zone, the height of the pitching mound, and — last but far from least in this list — the integration of black and Hispanic players into major league baseball. In addition to these structural variations, there are others that mitigate against the commensurability of statistics over time; for example, the rise and decline of each player’s skills, the skills of teammates (which can boost or depress a player’s performance), the characteristics of a player’s home ballpark (where players generally play half their games), and the skills of the opposing players who are encountered over the course of a career.

Despite all of these obstacles to commensurability, the urge to evaluate the relative performance of players from different teams, leagues, seasons, and eras is irrepressible. Baseball-Reference.com is rife with such evaluations; the Society for American Baseball Research (SABR) revels in them; many books offer them (e.g., this one); and I have succumbed to the urge more than once.

It is one thing to have fun with numbers. It is quite another thing to ascribe meanings to them that they cannot support. Consider the following cross-temporal comparison of baseball statistics:

Top-25 single-season offensive records
Source: Derived from the Play Index at Baseball-Reference.com. (Most baseball fans will recognize all of the names but one: Cy Seymour. His life and career are detailed in this article.)

Take, for example, the players ranked 17-25 in single-season BA. The range of BA for those 9 seasons (.384 to .388) is insignificantly small; it represents a maximum difference of only 4 hits per 1,000 times at bat. Given the vastly different conditions of play — and of the players — what does it mean to say that Rod Carew in 1977 and George Brett in 1980 had essentially the same BA as Honus Wagner in 1905 and 1908? It means nothing. The only thing that is essentially the same is the normalized BA that I concocted to represent those (and other) seasons. Offering normalized BA in evidence is to beg the question. In fact, any cross-temporal comparison of BA (or SLG or OPS) is essentially meaningless.

By the same token, it means nothing to say that prices in 2013 are X times as high as prices in 1913, when — among many other things — consumers in 2013 have access to a vastly richer “market basket” of products and services. Further, the products and services of 2013 that bear a passing resemblance to those of 1913 (e.g., houses, automobiles, telephone service) are demonstrably superior in quality.

So, it is fun to play with numbers, but when it comes to using them to make cross-temporal comparisons — especially over a span of decades — be very wary. Better yet, resist the temptation to make those cross-temporal comparisons, except for the fun of it.
____________
A SELECTION OF QUESTIONS AND ANSWERS ABOUT THE CPI, FROM THIS PAGE AT THE WEBSITE OF THE BUREAU OF LABOR STATISTICS:

Whose buying habits does the CPI reflect?

The CPI reflects spending patterns for each of two population groups: all urban consumers and urban wage earners and clerical workers. The all urban consumer group represents about 87 percent of the total U.S. population. It is based on the expenditures of almost all residents of urban or metropolitan areas, including professionals, the self-employed, the poor, the unemployed, and retired people, as well as urban wage earners and clerical workers. Not included in the CPI are the spending patterns of people living in rural nonmetropolitan areas, farm families, people in the Armed Forces, and those in institutions, such as prisons and mental hospitals. Consumer inflation for all urban consumers is measured by two indexes, namely, the Consumer Price Index for All Urban Consumers (CPI-U) and the Chained Consumer Price Index for All Urban Consumers (C-CPI-U)….

The Consumer Price Index for Urban Wage Earners and Clerical Workers (CPI-W) is based on the expenditures of households included in the CPI-U definition that also meet two requirements: more than one-half of the household’s income must come from clerical or wage occupations, and at least one of the household’s earners must have been employed for at least 37 weeks during the previous 12 months. The CPI-W population represents about 32 percent of the total U.S. population and is a subset, or part, of the CPI-U population….

Does the CPI measure my experience with price change?

Not necessarily. It is important to understand that BLS bases the market baskets and pricing procedures for the CPI-U and CPI-W populations on the experience of the relevant average household, not of any specific family or individual. It is unlikely that your experience will correspond precisely with either the national indexes or the indexes for specific cities or regions….

How is the CPI market basket determined?

The CPI market basket is developed from detailed expenditure information provided by families and individuals on what they actually bought. For the current CPI, this information was collected from the Consumer Expenditure Surveys for 2007 and 2008. In each of those years, about 7,000 families from around the country provided information each quarter on their spending habits in the interview survey. To collect information on frequently purchased items, such as food and personal care products, another 7,000 families in each of these years kept diaries listing everything they bought during a 2-week period….

What goods and services does the CPI cover?

The CPI represents all goods and services purchased for consumption by the reference population (U or W) BLS has classified all expenditure items into more than 200 categories, arranged into eight major groups. Major groups and examples of categories in each are as follows:

  • FOOD AND BEVERAGES (breakfast cereal, milk, coffee, chicken, wine, full service meals, snacks)
  • HOUSING (rent of primary residence, owners’ equivalent rent, fuel oil, bedroom furniture)
  • APPAREL (men’s shirts and sweaters, women’s dresses, jewelry)
  • TRANSPORTATION (new vehicles, airline fares, gasoline, motor vehicle insurance)
  • MEDICAL CARE (prescription drugs and medical supplies, physicians’ services, eyeglasses and eye care, hospital services)
  • RECREATION (televisions, toys, pets and pet products, sports equipment, admissions);
  • EDUCATION AND COMMUNICATION (college tuition, postage, telephone services, computer software and accessories);
  • OTHER GOODS AND SERVICES (tobacco and smoking products, haircuts and other personal services, funeral expenses)….

For each of the more than 200 item categories, using scientific statistical procedures, the Bureau has chosen samples of several hundred specific items within selected business establishments frequented by consumers to represent the thousands of varieties available in the marketplace. For example, in a given supermarket, the Bureau may choose a plastic bag of golden delicious apples, U.S. extra fancy grade, weighing 4.4 pounds to represent the Apples category….

How do I read or interpret an index?

An index is a tool that simplifies the measurement of movements in a numerical series. Most of the specific CPI indexes have a 1982-84 reference base. That is, BLS sets the average index level (representing the average price level)-for the 36-month period covering the years 1982, 1983, and 1984-equal to 100. BLS then measures changes in relation to that figure. An index of 110, for example, means there has been a 10-percent increase in price since the reference period; similarly, an index of 90 means a 10-percent decrease….

Can the CPIs for individual areas be used to compare living costs among the areas?

No, an individual area index measures how much prices have changed over a specific period in that particular area; it does not show whether prices or living costs are higher or lower in that area relative to another. In general, the composition of the market basket and the relative prices of goods and services in the market basket during the expenditure base period vary substantially across areas….

Economic Horror Stories: The Great “Demancipation” and Economic Stagnation

UPDATED 08/03/13

Alternate title: “What We Can Learn from the Labor-Force Participation Rate”

The wholesale entry of women into the labor force after 1960 was considered (and still is, by many) to be a key sign women’s “emancipation.” Because of the baleful effects of that “emancipation,” I prefer to call it “demancipation.” What baleful effects? I begin with this, from a post that I wrote more than eight years ago:

Monetary measures of GDP exclude a lot of things that might be captured in the term “quality of life”; for example:

[F]ailing to account for the output produced within households may lead to misleading comparisons of economy-wide production, as conventionally measured. The female labor force participation rate in the United States has grown enormously since the early part of the 20th century. To the extent that the entry of women into paid employment has reduced the effort women devote to household production, the long-term trend in output, as measured by gross domestic product (GDP), may exaggerate the true growth in national output. [Committee on National Statistics (CNSTAT), Designing Nonmarket Accounts for the United States: Interim Report (2003), p. 9 in HTML version]

The “effort that women devote to household production” involves a lot more than shopping, cooking, cleaning, and all of the other activities usually associated with the term “housewife.” Not the least among those activities is the raising of children. Child-rearing (a quaint but still meaningful phrase) includes more than feeding, bathing, and toilet training. Parents — and especially mothers — impart lessons about civility — lessons that are neglected when children are left on their own to disport with friends, watch TV, and imbibe the nihilistic lyrics that pervade popular music.Yet, the apparently robust growth of real GDP per capita between owes much to the huge increase in the proportion of women seeking work outside the home. The labor-force participation rate for women of “working age” (14 and older in 1900, 16 and older in 2000) grew from 19 percent in 1900 to 60 percent in 2000, while the rate for men dropped only slightly, from 80 percent to 75 percent. Who knows how much damage society has suffered — and will yet suffer — because of the exodus into the workforce of women with children at home?

I went on, in that post and in later ones, to address the damage.

As it turned out, both the female participation rate and the overall rate peaked around 2000 (details here, Table 585). Here is a picture of the overall rate since 1960:

Labor force participation rate_Jan 1960 - Jul 2013
Source: Bureau of Labor Statistics, Labor Force Statistics from the Current Population Survey, Civilian Labor Force Participation Rate (LNS11300000).

The end of demancipation around 2000 wasn’t necessarily an unmixed blessing. Why? Because the graph points to another horror story: economic stagnation.

Look at relationship of the labor-force participation rate and recessions, which are represented by the gray columns in the chart. (The recessionary periods are those defined by the National Bureau of Economic Research, here.) Each recession has marked a reduction or leveling off of the labor force participation rate. This is an unsurprising relationship because dimmed prospects for employment will deter persons from joining or rejoining the labor force.

But the decline since 2000 — and especially since 2009 — is eloquent testimony to a growing lack of faith in the country’s economic prospects. That lack of faith is entirely justified, as I have explained in many of the following related posts:
The Laffer Curve, “Fiscal Responsibility,” and Economic Growth
The Causes of Economic Growth
In the Long Run We Are All Poorer
A Short Course in Economics
Addendum to a Short Course in Economics
The Price of Government
The Price of Government Redux
The Mega-Depression
As Goes Greece
Ricardian Equivalence Reconsidered
The Real Burden of Government
The Illusion of Prosperity and Stability
Estimating the Rahn Curve: Or, How Government Inhibits Economic Growth
Taxing the Rich
More about Taxing the Rich
America’s Financial Crisis Is Now
A Keynesian Fantasy Land
The Keynesian Fallacy and Regime Uncertainty
Why the “Stimulus” Failed to Stimulate
The “Jobs Speech” That Obama Should Have Given
Say’s Law, Government, and Unemployment
Unemployment and Economic Growth
Regime Uncertainty and the Great Recession
Regulation as Wishful Thinking
The Real Multiplier
Vulgar Keynesianism and Capitalism
Why Are Interest Rates So Low?
The Commandeered Economy
Estimating the Rahn Curve: A Sequel
In Defense of the 1%
The Real Multiplier (II)
Lay My (Regulatory) Burden Down
The Burden of Government
Economic Growth Since World War II
More Evidence for the Rahn Curve
The Economy Slogs Along
The Obama Effect: Disguised Unemployment
The Stock Market as a Leading Indicator of GDP
Government in Macroeconomic Perspective
Where We Are, Economically
Keynesianism: Upside-Down Economics in the Collectivist Cause
The Economic Outlook in Brief
Obamanomics: A Report Card

Not-So-Random Thoughts (VII)

Links to the other posts in this occasional series may be found at “Favorite Posts,” just below the list of topics.

UPDATED 07/14/13

In “The Reality of the Wartime Economy,” Steven Horwitz and Michael J. McPhillips bang the drum for Robert Higgs’s account of the role of World War II in ending the Great Depression. Horwitz and McPhillips conclude:

The debate over World War II’s role in ending the Great Depression has enormous relevance in connection with the current anemic recovery from the Great Recession. We have offered evidence to support Robert Higgs’s argument that the wartime macroeconomic data significantly overstated the degree of genuine economic recovery. Higgs’s evidence rests on his reinterpretation of several traditional macroeconomic indicators to compensate for the distinct features of a wartime economy. We show that if one digs below the aggregates and looks at how American households lived during the war, as shown in the media, letters, and journals, Higgs’s case appears to be even stronger. Whatever the war’s effects on seemingly booming conventional macroeconomic aggregates, it entailed a retrogression in the average American’s living standards, and that disconnect should alert us to those aggregates’ limitations. Whenever government commands resources, those who finance this acquisition, whether through taxation or purchase of government bonds, incur opportunity costs. Whether the diverted resources go toward building tanks and guns or toward repairing bridges and roads does not alter this fact. As we continue to debate the effectiveness of large-scale government expenditure to speed recovery from the Great Recession, we should not be looking at the wartime experience of the 1940s as a guide.

I quite agree with the bottom line. (See especially my posts “A Keynesian Fantasy Land” and “The Keynesian Fallacy and Regime Uncertainty.”) But there is reason to believe that the glut of saving during World War II helped to fuel the post-war recovery. (See my posts “How the Great Depression Ended” and “Does ‘Pent Up’ Demand Explain the Post-War Recovery?“)

*     *     *

Highly recommended: “What Difference Would Banning Guns Make?” at Political Calculations. The answer is “not much, if any.” Violence will out, especially when the demographics are right (or wrong, if you will). Which leads to my post “Crime, Explained.”

*     *    *

A Bipartisan Nation of Beneficiaries” (The Pew Report, December 18, 2012) suggests (unsurprisingly) that

a majority of Americans (55%) have received government benefits from at least one of the six best-known federal entitlement programs.

The survey also finds that most Democrats (60%) and Republicans (52%) say they have benefited from a major entitlement program at some point in their lives. So have nearly equal shares of self-identifying conservatives (57%), liberals (53%) and moderates (53%).

What choice is there when the state (a) robs us blind and (b) penalizes initiative and success? In those conditions, most of us respond as one would expect — by feeding at the public trough. See, for example, “The Interest-Group Paradox.”

*     *     *

An increasingly regulated economy, that’s what we have, according to “Counting All the U.S. Government’s Regulations” (Political Calculations, October 18, 2012). And a heavy price we pay for it, as I’ve documented in “The Price of Government, Once More,” and the many posts linked to therein.

*     *     *

UPDATES:

Rich Lowry of National Review, famous mainly for having fired John Derbyshire, continues his attack on what Timothy Sandefur calls “Doughface libertarians”:

… Lincoln said, “I have no purpose to introduce political and social equality between the white and black races.” How could he say such a thing? Well, he said it in his debates with Stephen Douglas, when he was playing defense…. (“The Rancid Abraham Lincoln-Haters of the Libertarian Right,” The Daily Beast, June 17, 2013)

Not so fast, Mr. Lowry. Lincoln wasn’t just playing defense. See “The Hidden Tragedy of the Assassination of Abraham Lincoln,” wherein Lincoln’s plan for the colonization of blacks is discussed.

*     *     *

From Michael Ruse’s “Does Life Have a Purpose?” (Aeon, June 24, 2013):

… Today’s scientists are pretty certain that the problem of teleology at the individual organism level has been licked. Darwin really was right. Natural selection explains the design-like nature of organisms and their characteristics, without any need to talk about final causes. On the other hand, no natural selection lies behind mountains and rivers and whole planets. They are not design-like. That is why teleological talk is inappropriate….

This reminds me of Sandefur’s post, “Teleology without God,” which I addressed in “Evolution, Human Nature, and ‘Natural Rights’” and “More Thoughts about Evolutionary Teleology.”

Obamanomics: A Report Card (Updated 07/06/13)

Here.

The Price of Government, Once More

I was pleased to read a recent post by Mark Perry, “Federal regulations have lowered real GDP growth by 2% per year since 1949 and made America 72% poorer.” It wasn’t the message that pleased me; it was the corroboration of what I have been saying for several years.

Regulation is one of the many counterproductive activities that is financed by government spending. The main economic effect of government spending, aside from regulation, is the deadweight loss it imposes on the economy; that is, it moves resources from productive uses to less productive, unproductive, and counterproductive ones. And then there is taxation (progressive and otherwise), which penalizes success and deters growth-producing investment.

All in all, the price of government is extremely high. But most voters are unaware of the price, and so they continue to elect and support the very “free lunch” politicians who are, in fact, robbing them blind.

Consider, for example, these posts by James Pethokoukis:
Is the Era of Fast U.S. Economic Growth Coming to an End?AEIdeas, July 13, 2013
My Counter: Why U.S. Economic Growth Doesn’t Have to Come to an End,” AEIdeas, August 23, 2012

Pethokoukis’s thesis, with which I agree, is that government — not lack of opportunity — is the main obstacle to the resumption of a high rate of growth.

For much more, see:
The Price of Government
The Price of Government Redux
The Mega-Depression
Ricardian Equivalence Reconsidered
The Real Burden of Government
The Rahn Curve at Work
The “Forthcoming Financial Collapse”
Estimating the Rahn Curve: Or, How Government Inhibits Economic Growth
The Deficit Commission’s Deficit of Understanding
The Bowles-Simpson Report
The Bowles-Simpson Band-Aid
The Stagnation Thesis
America’s Financial Crisis Is Now
Estimating the Rahn Curve: A Sequel
Lay My (Regulatory) Burden Down
More Evidence for the Rahn Curve


The 80-20 Rule, Illustrated

The 80-20 rule “states that, for many events, roughly 80% of the effects come from 20% of the causes.” This rule seems to hold with respect to wealth; that is, about 20 percent of individuals own about 80 percent of the wealth of the world. It’s not that the 20 percent “claim” 80 percent of the wealth (as some would have it), but that the 20 percent have earned 80 percent of the wealth. (The extent of inherited wealth is vastly overstated. And, besides, the prospect of leaving money to one’s heirs — and to charities — stimulates the accumulation of wealth and the beneficial economic activities that give rise to it.)

A good illustration of the 80-20 rule is found in baseball statistics. In the past 50 seasons (1963-2012), there were 1,370 baseball players who compiled one or more seasons in which they appeared at the plate often enough to qualify for a batting championship. Of those 1,370 players, it took only 19.2 percent (264 of them) to compile 80 percent of the single-season batting averages of .300 or higher. (For those of you who live on a remote planet, a batting average of .300 or more — 3 or more hits in every 10 times at bat — has long been considered an outstanding performance in baseball.)

Further, the 1,370 players compiled a total of 6,724 seasons in which they qualified for a batting title. But only 21.4 percent of those seasons resulted in a batting average of .300 or higher. The 19.2 percent of players who accounted for 80 percent of the .300-plus seasons compiled them while playing a total of 1,153 championship-qualifying seasons — 17.4 percent of the 6,724 championship-qualifying seasons played.

Excellence really is a relatively rare (and non-random) commodity. It should be celebrated and emulated. “Progressive” levelers, however, envy those who attain excellence, and use the power of government (i.e., taxation and regulation) to discourage it and penalize its fruits.

Buy Loco

It is loco to buy local, as so-called local merchants urge us to do.

What is the point of buying local? More to the point: How does one decide whether a business is local?

The ultimate in local buying is to buy from oneself, that is, to make with one’s own brain and hands everything that one consumes and uses, and to do so by drawing only on the resources that are available on one’s property. Absurd, you say? Of course.

But if we admit the absurdity of self-sufficiency (except for the rare bird who is willing to dress in animal skins, live in a lean-to without electricity, and subsist on a limited diet), we must admit that trade is necessary. And once we admit the necessity of trade, we are hard-pressed to say how far it can reach.

In terms of the buy-local movement (if it may be called that), are we to boycott a locally owned hardware store because most of what it sells is made elsewhere — and most of that in far-flung places, even including Asia? What makes the locally owned hardware store any more local than a Lowe’s or Home Depot? Certainly not the source of its goods. Certainly not the source of its labor.

Ah, but, there are all those employees (some of them extremely well-paid) who work and live elsewhere. And there are of those shareholders and bondholders, who live as far away as China. How dare they “suck” money out of the local economy.

But they are not “sucking” money out of the local economy. They, along with local employees and suppliers far and wide, are providing items of value to the local economy, in return for which they are paid in dollars that they often spend on products and services of local origin.

The moral of this tale: If you are not willing and able to be truly self-sufficient, you cannot in good conscience subscribe to the buy-local movement.

The Obama Effect: Disguised Unemployment (Updated)

Here.

Obamanomics: A Report Card (Updated)

Here. Read it and weep.

The Obama Effect: Disguised Unemployment (Updated)

Here.

Taxes Matter

A recent story in The Telegraph (UK) leads with this:

Almost two-thirds of the country’s million-pound earners disappeared from Britain after the introduction of the 50 [percent] top rate of tax, figures have disclosed.

Surprise, surprise!

It happens here, too. For example, the net flow of persons among States (i.e., pattern of inter-State migration) is strongly determined by the relative tax burdens of the States (including taxes imposed by local governments).

The table below gives a hint of the strong relationship between tax burdens and inter-State migration. “In/Out represents the number of residents who moved into a State from another State, divided by the number of residents who moved out of the State to another State. The tax burden represents total State and local taxes levied on residents of a State, divided by income earned by residents of the State. (Sources and methods are discussed in the footnote to this post.)

In-out ratios and tax burdens of States

Green shading indicates States in the top (best) one-third of each distribution; gray shading indicates States in the bottom (worst) one-third. Alaska and the District of Columbia are omitted for reasons discussed in the footnote.  As it turns out, statistical analysis yields two significant determinants of a State’s In/Out ratio:

  • whether it is situated in the “Blue,” heavily unionized, North Central region of the United States, with its relatively high unemployment rate; and
  • the State’s tax burden.

Take California (please). In 2010 alone, the Golden State’s heavy tax burden — 11.2 percent vs. the national average of 9.5 percent — cost it 54,000 residents. And California is not the most repulsive of States (“tax-wise”). That “honor” goes to New York, with a burden of 12.8 percent in 2010 — a burden that cost the Empire State 66,000 residents in that year. Then there is Wisconsin — with only 1/6 the population of California — which lost 33,000 current and prospective residents because it is in the North Central region and has a tax burden of 11.1 percent.

When low In/Out ratios persist for years — as they have in California, New York, and most of the North Central States — the result is a massive reduction in the number of taxpaying citizens and businesses. Persistently low In/Out ratios lead to fiscal death-spirals:

  • Current and prospective residents and businesses are driven away by high taxes and other unfavorable conditions (e.g. unionization).
  • Instead of paring government and taking other steps to make the State more attractive (e.g., playing tough with public-sector unions), taxes are raised on remaining residents and businesses.
  • More residents and business are driven away.
  • Some amount of paring may eventually occur, but taxes remain disproportionately high (and other unfavorable conditions usually persist), so more residents and businesses are driven away.
  • And so on.

Detroit — which lost more than 60 percent of its population between 1950 and 2010 — is a prime example of a jurisdiction in a death-spiral, but it is far from the only one.

But voting with one’s feet, which works on the municipal and State levels, does not work on the national level. And the proponents of Big Government understand that. It is a sad fact that, for most citizens, the cost of fleeing the country for a better place (if one can be found) would far outweigh the additional burden of higher marginal tax rates, higher rates on capital gains, the perpetuation and expansion of “entitlements,” and the ever-growing volume of regulations (which are taxes in a different guise).

What the proponents of Big Government do not understand — or do not care about — is that they are killing the goose that lays the golden eggs. When people cannot reap the hard-won rewards of their labors and their investments, they labor and invest less. The result is slower and slower economic growth, and the imminent Europeannirvana” so devoutly wished by proponents of Big Government.

Related posts:
The Laffer Curve, “Fiscal Responsibility,” and Economic Growth
The Causes of Economic Growth
In the Long Run We Are All Poorer
A Short Course in Economics
Addendum to a Short Course in Economics
The Price of Government
The Price of Government Redux
The Mega-Depression
As Goes Greece
Ricardian Equivalence Reconsidered
The Real Burden of Government
The Illusion of Prosperity and Stability
Estimating the Rahn Curve: Or, How Government Inhibits Economic Growth
Taxing the Rich
More about Taxing the Rich
America’s Financial Crisis Is Now
A Keynesian Fantasy Land
The Keynesian Fallacy and Regime Uncertainty
Why the “Stimulus” Failed to Stimulate
The “Jobs Speech” That Obama Should Have Given
Say’s Law, Government, and Unemployment
Unemployment and Economic Growth
Regime Uncertainty and the Great Recession
Regulation as Wishful Thinking
The Real Multiplier
Vulgar Keynesianism and Capitalism
Why Are Interest Rates So Low?
The Commandeered Economy
Stocks for the Long Run?
We Owe It to Ourselves
Stocks for the Long Run? (Part II)
Estimating the Rahn Curve: A Sequel
In Defense of the 1%
Bonds for the Long Run?
The Real Multiplier (II)
Lay My (Regulatory) Burden Down
The Burden of Government
Economic Growth Since World War II
More Evidence for the Rahn Curve
The Economy Slogs Along
The Obama Effect: Disguised Unemployment
The Stock Market as a Leading Indicator of GDP
Government in Macroeconomic Perspective
Where We Are, Economically
Keynesianism: Upside-Down Economics in the Collectivist Cause
The Economic Outlook in Brief
Is Taxation Slavery? (yes)

__________
EXPLANATORY NOTE AND REFERENCES:

I began with Census Bureau estimates of State-to-State migrations in 2010. I derived estimates of in- and out-migration for each State and the District of Columbia. The “turnover” rates for Alaska and the District of Columbia proved to be much higher than the rates for the other 49 States. Preliminary analyses of the relationship between In/Out ratio and key variables (e.g., tax burden) confirmed that the inclusion of Alaska and D.C. in the analysis would bias the results, so I dropped those two entities from the analysis.

For the other 49 States, I considered the relationship between In/Out ratio and several variables:

  • population (from the same source as migration statistics);
  • regional effects, represented by dummy variables for Northeast & Mid-Atlantic (CT, DE, ME, MA, NH, NJ, NY, PA, RI, VT); North Central (IL, IN, MI, MN, OH, WI); South & Southeast (AL, AR, FL, GA, KY, LA, MD, MS, MO, NC, OK, SC, TN, TX, VA, WV); Plains & Mountain States (AZ, CO, IA, ID, KS, MT, NE, NV, NM, ND, SD, UT, WY); and West (CA, HI, OR, WA). (The statistical results are unaffected by reasonable variations in assignments — MD and VA to Northeast & Mid-Atlantic, TX to Plains & Mountain States, for example.)

Regressions on various combinations of explanatory variables yielded one statistically significant equation:

In/Out = 1.60 – 0.21NC – 5.58TB

where NC is 1 if a State is in the North Central region (otherwise it is 0), and TB is the State’s tax burden (expressed as a decimal fraction). Each State’s tax burden includes local taxes and taxes imposed on the State’s residents by other States. (A person who lives in New Jersey and works in New York knows that one price of living in New Jersey is the payment of New York’s income taxes.)

The equation and its constant and coefficients are significant at the 1-percent level, and better. The standard error of the estimate is 0.15, against a mean for In/Out of 1.048. The residuals are randomly distributed with respect to the estimated values.)

According to the equation, a North Central State with a tax burden of 10.2 percent (the average for North Central States) would have an In/Out ratio of 0.82; the average for North Central States is 0.83. A State in another region with a tax burden of 9.4 percent (the average for all other States) would have an In/Out ratio of 1.08; the  average for States not in the North Central region is 1.08.

Here is a plot of estimated vs. actual In/Out ratios:

In-out ratios_estimated vs actual

The outliers — States with residuals greater than 1 standard error — are indicated by the green shading (good) and gray shading (bad):

Residuals for estimate of In-out ratio vs Ncent and tax burden

The top 6 States have something extra going for them; the bottom 9 States have something extra going against them. The extras could be an especially hospitable or inhospitable business climate, climatic and/or geographical allure (or lack thereof), cost of living, unemployment well above or below the national average, the political climate (“Blue” to “Red” shifts prevail), or something else. Whatever the case, I am easily persuaded that New York (where I have lived and run a business), Michigan (my home State), California (a well-known basket case), Nevada (ditto), New Jersey (ditto), and West Virginia (with which I am all too familiar) have a lot going against them, even when it is not an excessive tax burden.

Well-Founded Pessimism

I have never been more pessimistic than I am now about the future of the United States. Not even in the aftermath of 9/11, when the enemy was without and could be defeated, with persistence and resolve.

Patrick Buchanan observes that

Americans are already seceding from one another—ethnically, culturally, politically. Middle-class folks flee high-tax California, as Third World immigrants, legal and illegal, pour in to partake of the cornucopia of social welfare benefits the Golden Land dispenses.

High-tax states like New York now send tens of thousands of pension checks to Empire State retirees in tax-free Florida. Communities of seniors are rising that look like replicas of the suburbs of the 1950s. People gravitate toward their own kind. Call it divorce, American-style.

What author William Bishop called “The Big Sort”—the sorting out of people by political beliefs—proceeds. Eighteen states have gone Democratic in six straight presidential elections. A similar number have gone Republican.

“Can we all just get along?” asked Rodney King during the Los Angeles riot of 1992. Well, if we can’t, we can at least dwell apart.

After all, it’s a big country.

Buchanan has it right — until he counsels voluntary segregation as an antidote to statism. Liberty lovers cannot escape the dictatorial grip of the central government simply by living in a Red locale in a Red State. Big Brother is everywhere: carting off chunks of our income; dictating the manufacture of products that we use; dictating the wages and benefits that must be paid to the employees of companies that we patronize; driving up the cost of the health care that we need while driving providers and insurers out of the market for health care; subsidizing the follies of State and local governments through grants of “federal” (taxpayer) money; setting standards for education at local public schools; undermining the quality of the products and services we buy, locally and on the web, by dictating the racial and gender composition of workforces; driving the economy into stagnation (if not outright decline) through profligate spending on “entitlements”; and on an on.

The country is not big enough — not by a long shot — for voluntary segregation to work. Something has to give, and give soon, or those of us who prefer liberty to slavery will never escape the serfdom into which our “leaders” are marching us. What has to give, of course, is our attachment to the union that was preserved by the force of arms in 1865. As long as we cling to that union we remain subject to its now-irreversible statist commitments. At best, the election of conservative presidents and legislators will slow our descent into total statism, but it will not halt that descent.

Finally (for now), I am rightly pessimistic about the willingness of the left to allow a return to the true federalism that was supposed to have been ensured by the Constitution. The left’s mantra is control, control, control — and it will not relinquish its control of the machinery of government. The left’s idea of liberty is the “liberty” to follow its dictates. I will continue to point out the follies and fallacies of leftist policies, but I will not waste my time by dissecting the left’s specious arguments for its policies. Enough!

More to come.

Obamanomics: A Report Card

A revised and updated version is here.

Much Ado about the Price-Earnings Ratio

Does the long-term trend of the price-earnings ratio have an upward tilt? You might think so, if you encounter Robert Shiller’s Cyclically Adjusted Price-Earnings (CAPE) ratio for the S&P Composite. It looks like this:


Derived from Robert Shiller’s data set at http://www.econ.yale.edu/~shiller/data/ie_data.xls.

The plot begins in January 1881 and extends through October 2012. As explained here, CAPE is supposed to more accurately reflect the value of stocks:

Legendary economist and value investor Benjamin Graham noticed the … bizarre P/E behavior during the Roaring Twenties and subsequent market crash. Graham collaborated with David Dodd to devise a more accurate way to calculate the market’s value, which they discussed in their 1934 classic book, Security Analysis. They attributed the illogical P/E ratios to temporary and sometimes extreme fluctuations in the business cycle. Their solution was to divide the price by a multi-year average of earnings and suggested 5, 7 or 10-years. In recent years, Yale professor Robert Shiller, the author of Irrational Exuberance, has reintroduced the concept to a wider audience of investors and has selected the 10-year average of “real” (inflation-adjusted) earnings as the denominator. As the accompanying chart illustrates, this ratio closely tracks the real (inflation-adjusted) price of the S&P Composite. The historic average is 16.4. Shiller refers to this ratio as the Cyclically Adjusted Price Earnings Ratio, abbreviated as CAPE….

CAPE can be quite misleading, however:

The problem with [the 10-year moving average of earnings] is that the typical or average business cycle has been significantly shorter than 10 years. According to data compiled by the National Bureau of Economic Research, economic contractions have become shorter and expansions longer in recent years. Furthermore, while the business cycle has lengthened in recent years, it is still considerably shorter than 10 years. Measured trough to trough, the average business cycle has been six years and one month for the most recent 11 cycles. Measured peak to peak, the average is five years and six months.

The problem with using a moving average that is longer than the business cycle is that it will overestimate “true” average earnings during a contraction and underestimate “true” average earnings during an expansion. According to the National Bureau of Economic Research, the last recession ended in June 2009 and the U.S. economy is now in an expansion phase. Thus, the average earnings estimate used by the July 2011 CAPE is too low and produces a bearishly biased estimate of value.

Using Shiller’s data, a July 2011 CAPE based on the average of six years of real earnings is 21.26 and the long-term average CAPE based on the average of six years of real earnings is 15.78. Comparison to this average indicates that stocks are overvalued by 34.7%. While still signaling that stocks are overvalued, the degree of overvaluation is much less than the 42.3% estimate provided by the July 2011 CAPE based on a 10-year average of real earnings.

When viewed correctly, then, the long-term P-E ratio for the S&P Composite (based on current earnings) looks like this:


Derived from Shiller’s data set. The vertical bars show variations of 1 standard error around the means for each of the three eras.

If I had fitted a long-term trend line through the entire series, it would tilt upward, as it does for CAPE. But that trend would be misleading because it would give undue weight to the stock-market bubble of the late 1990s and the artificially high P-E ratios resulting from the earnings crash during the Great Recession.

In fact, a trend line for the period 1871-1995 would be perfectly flat. Moreover, as shown in the graph immediately above, there is little difference between the first half of that period (1871-1933) and second half (1934-1995). The standard-error bars for both eras are almost the same height and vertically centered at almost the same value. The second era is just slightly (but insignificantly) more volatile than the first era.

As indicated by the standard-error bars, the P-E ratio for 1996-2012 is markedly higher than for the earlier eras. But, of late, the P-E ratio shows signs of returning to the normal range for 1871-1995.

In sum — and contrary to the story that is peddled by “bulls” — I doubt that the real long-term trend of the P-E ratio is upward. Rather, the apparent upward trend reflects bizarre happenings in the past 16 years: an unprecedented price bubble and a brief but steep earnings crash. I would therefore caution investors not to buy stocks in the belief that the P-E trend is upward. For reasons discussed here, the long-term trend of stock prices is more likely downward.

Related posts:
The Price of Government
The Price of Government Redux
The Mega-Depression
Ricardian Equivalence Reconsidered
The Real Burden of Government
The Rahn Curve at Work
The “Forthcoming Financial Collapse”
Estimating the Rahn Curve: Or, How Government Inhibits Economic Growth
The Deficit Commission’s Deficit of Understanding
The Bowles-Simpson Report
The Bowles-Simpson Band-Aid
The Stagnation Thesis
America’s Financial Crisis Is Now
Stocks for the Long Run?
Estimating the Rahn Curve: A Sequel
Bonds for the Long Run?
The Real Multiplier (II)
Lay My (Regulatory) Burden Down
Economic Growth Since World War II
More Evidence for the Rahn Curve
Progressive Taxation Is Alive and Well in the U.S. of A.
The Economy Slogs Along
The Obama Effect: Disguised Unemployment
The Stock Market as a Leading Indicator of GDP
Where We Are, Economically