Why Are Interest Rates So Low? (II)

Six years ago, I opined that

borrowers have become less keen about borrowing; that is, they lack confidence about future prospects for income (in the case of households) and returns on investment (in the case of businesses). Why should that be?

If the post-World War II trend is any indication — and I believe that it is — the American economy is sinking into stagnation. Here is the long view [growth rates are inflation-adjusted, final entry updated]:

  • 1790-1861 — annual growth of 4.1 percent — a booming young economy, probably at its freest
  • 1866-1907 — annual growth of 4.3 percent — a robust economy, fueled by (mostly) laissez-faire policies and the concomitant rise of technological innovation and entrepreneurship
  • 1970-2010 2018 — annual growth of 2.8 2.7 percent – sagging under the cumulative weight of “progressivism,” New Deal legislation, LBJ’s “Great Society” (with its legacy of the ever-expanding and oppressive welfare/transfer-payment schemes: Medicare, Medicaid, a more generous package of Social Security benefits), and an ever-growing mountain of regulatory restrictions. [All further compounded by Obama’s expansion of Medicare and Medicaid and acceleration of regulatory activity, some of which Trump has reversed, but most of which still throttles the economy.]

Arnold Kling, citing a piece by Andrew McAfee, suggests another reason:

[C]ould this decoupling [economic growth with less resource use] be responsible for low interest rates?… As long as economic growth required more use of resources, you expect a positive return from storing resources. You get a positive interest rate out of that. But when growth is decoupled, you do not expect a positive return from storing resources. If you want to create a store of value with a positive rate of return, you need to find some productive investment.

But storing resources is only part of the picture. The interest rates that producers pay depend on (a) what they expect in the way of future profits and (b) the availability of funds. Even if profitability is rising because of more efficient resource use, rates could be falling because — as a commenter on Kling’s post notes — there is a steady increase in global savings.

Why would that be? Because households (and businesses with large cash balances) have more disposable income as real incomes rise (and profit margins grow). Some of that increment is made available to corporate borrowers through direct purchases of corporate debt and purchases of mutual funds and ETF shares. Even historically low interest rates on corporate debt will attract buyers because the alternatives (low rates on bank deposits and money-market certificates) are worse.

So it would seem that the long-standing slowdown in the U.S. economy isn’t the whole answer to the question. But it remains part of the answer. Interest rates would be higher if the dead hand of government were lifted from the economy’s carcass.

Unorthodox Economics: 5. Economic Progress, Microeconomics, and Microeconomics

This is the fifth entry in what I hope will become a book-length series of posts. That result, if it comes to pass, will amount to an unorthodox economics textbook. Here are the chapters that have been posted to date:

1. What Is Economics?
2. Pitfalls
3. What Is Scientific about Economics?
4. A Parable of Political Economy
5. Economic Progress, Microeconomics, and Macroeconomics

What is economic progress? It is usually measured as an increase in gross domestic product (GDP) or, better yet, per-capita GDP. But such measures say nothing about the economic status or progress of particular economic units. In fact, the economic progress of some economic units will be accompanied by the economic regress of others. GDP captures the net monetary effect of those gains and losses. And if the net effect is positive, the nation under study is said to have made economic progress. But that puts the cart of aggregate measures (macroeconomics) before the horse of underlying activity (microeconomics). This chapter puts them in the right order.

The economy of the United States (or any large political entity) consists of myriad interacting units. Some of them contribute to the output of the economy; some of them constrain the output; some of them are a drain upon it. The contributing units are the persons, families, private charities, and business (small and large) that produce economic goods (products and services) which are voluntarily exchanged for the mutual benefit of the trading parties. (Voluntary, private charities are among the contributing units because they help willing donors attain the satisfaction of improving the lot of persons in need. Voluntary charity — there is no other kind — is not a drain on the economy.)

Government is also a contributing unit to the extent that it provides a safe zone for the production and exchange of economic goods, to eliminate or reduce the debilitating effects of force and fraud. The safe zone is international as well as domestic when the principals of the U.S. government have the wherewithal and will to protect Americans’ overseas interests. The provision of a safe zone is usually referred to as the “rule of law”.

Most other governmental functions constrain or drain the economy. Those functions consist mainly of regulatory hindrances and forced “charity,” which includes Social Security, Medicare, Medicaid, and other federal, State, and local “welfare” programs. In “The Rahn Curve Revisited,” I estimate the significant negative effects of regulation and government spending on GDP.

There is a view that government contributes directly to economic progress by providing “infrastructure” (e.g., the interstate highway system) and underwriting innovations that are adopted and adapted by the private sector (e.g., the internet). Any such positive effects are swamped by the negative ones (see “The Rahn Curve Revisited”). Diverting resources to government uses in return for the occasional “social benefit” is like spending one’s paycheck on lottery tickets in return for the occasional $5 winner. Moreover, when government commandeers resources for any purpose — including the occasional ones that happen to have positive payoffs — the private sector is deprived of opportunities to put those resources to work in ways that more directly advance the welfare of consumers.

I therefore dismiss the thrill of occasionally discovering  a gold nugget in the swamp of government, and turn to the factors that underlie steady, long-term economic progress: hard work; smart work; saving and investment; invention and innovation; implementation (entrepreneurship); specialization and trade; population growth; and the rule of law. These are defined in the first section of “Economic Growth Since World War II“.

It follows that economic progress — or a lack thereof — is a microeconomic phenomenon, even though it is usually treated as a macroeconomic one. One cannot write authoritatively about macroeconomic activity without understanding the microeconomic activity that underlies it. Moreover, macroeconomic aggregates (e.g., aggregate demand, aggregate supply, GDP) are essentially meaningless because they represent disparate phenomena.

Consider A and B, who discover that, together, they can have more clothing and more food if each specializes: A in the manufacture of clothing, B in the production of food. Through voluntary exchange and bargaining, they find a jointly satisfactory balance of production and consumption. A makes enough clothing to cover himself adequately, to keep some clothing on hand for emergencies, and to trade the balance to B for food. B does likewise with food. Both balance their production and consumption decisions against other considerations (e.g., the desire for leisure).

A and B’s respective decisions and actions are microeconomic; the sum of their decisions, macroeconomic. The microeconomic picture might look like this:

  • A produces 10 units of clothing a week, 5 of which he trades to B for 5 units of food a week, 4 of which he uses each week, and 1 of which he saves for an emergency.
  • B, like A, uses 4 units of clothing each week and saves 1 for an emergency.
  • B produces 10 units of food a week, 5 of which she trades to A for 5 units of clothing a week, 4 of which she consumes each week, and 1 of which she saves for an emergency.
  • A, like B, consumes 4 units of food each week and saves 1 for an emergency.

Given the microeconomic picture, it is trivial to depict the macroeconomic situation:

  • Gross weekly output = 10 units of clothing and 10 units of food
  • Weekly consumption = 8 units of clothing and 8 units of food
  • Weekly saving = 2 units of clothing and 2 units of food

You will note that the macroeconomic metrics add no useful information; they merely summarize the salient facts of A and B’s economic lives — though not the essential facts of their lives, which include (but are far from limited to) the degree of satisfaction that A and B derive from their consumption of food and clothing.

The customary way of getting around the aggregation problem is to sum the dollar values of microeconomic activity. But this simply masks the aggregation problem by assuming that it is possible to add the marginal valuations (i.e., prices) of disparate products and services being bought and sold at disparate moments in time by disparate individuals and firms for disparate purposes. One might as well add two bananas to two apples and call the result four bapples.

The essential problem is that A and B will derive different kinds and amounts of enjoyment from clothing and food, and those different kinds and amounts of enjoyment cannot be summed in any meaningful way. If meaningful aggregation is impossible for A and B, how can it be possible for an economy that consists of millions of economic actors and an untold, constantly changing, often improving variety of goods and services?

GDP, in other words, is nothing more than what it seems to be on the surface: an estimate of the dollar value of economic output. It is not a measure of “social welfare” because there is no such thing. (See “Social Welfare” in Chapter 2). And yet it is a concept that infests microeconomics and macroeconomics.

Aggregate demand and aggregate supply are nothing but aggregations of the dollar values of myriad transactions. Aggregate demand is an after-the-fact representation of the purchases made by economic units; aggregate supply is an after-the-fact representation of the sales made by economic units. There is no “aggregate demander” or “aggregate supplier”.

Interest rates, though they tend to move in concert, are set at the microeconomic level by lenders and borrowers. Interest rates tend to move in concert because of factors that influence them: inflation, economic momentum, and the supply of money.

Inflation is a microeconomic phenomenon which is arbitrarily estimated by sampling the prices of defined “baskets” of products and services. The arithmetic involved doesn’t magically transform inflation into a macroeconomic phenomenon.

Economic momentum, as measured by changes in GDP, is likewise a microeconomic phenomenon disguised as a macroeconomic, as previously discussed.

The supply of money, over which the Federal Reserve has some control, is the closest thing there is to a truly macroeconomic phenomenon. But the Fed’s control of the supply of money, and therefor of interest rates, is tenuous.

Macroeconomic models of the economy are essentially worthless because they can’t replicate the billions of transactions that are the flesh and blood of the real economy. (See “Economic Modeling: A Case of Unrewarded Complexity“.) One of the simplest macroeconomic models — the Keynesian multiplier — is nothing more than a mathematical trick. (See “The Keynesian Multiplier: Fiction vs. Fact”.)

Macroeconomics is a sophisticated form of mental masturbation — nothing more, nothing less.

Not-So-Random Thoughts (XIV)

UPDATED 04/19/15 WITH THE ADDITION OF TWO ENTRIES

Links to the other posts in this occasional series may be found at “Favorite Posts,” just below the list of topics.

*     *     *

Paul Mirengoff explores the similarities between Neville Chamberlain and Barack Obama; for example:

We see with Chamberlain the same curious dynamic present in the Obama presidency. At home, a tough-as-nails administration/political machine that takes no prisoners and rarely compromises; abroad, a feckless operation with a pattern of caving to belligerent adversaries. [Neville Chamberlain and Barack Obama: The Similarities Run Deep,” Powerline Blog, April 15, 2014]

See also John Hinderaker’s Powerline post, “Daniel Pipes: The Obama Doctrine Serves Up One Disaster After Another” (April 6, 2015), and a piece by Eileen F. Toplansky,”Obama’s Three Premises” (American Thinker, April 20, 2015).

What is Obama up to? For my take, see “Does Obama Love America?

*     *     *

If it were possible to convince a climate alarmist that he is wrong, Christopher Monckton of Brenchley is the man for the job:

What Evidence,” asks Ronald Bailey’s headline (www.reason.com, April 3, 2015), “Would Convince You That Man-Made Climate Change Is Real?

The answer: a rational, scientific case rooted in established theory and data would convince me that manmade climate change is a problem. That it is real is not in doubt, for every creature that breathes out emits CO2 and thus affects the climate.

The true scientific question, then, is not the fatuous question whether “Man-Made Climate Change Is Real” but how much global warming our sins of emission may cause, and whether that warming might be more a bad thing than a good thing.

However, Mr Bailey advances no rational case. What, then, are the elements of a rational, scientific case that our influence on the climate will prove dangerous unless the West completes its current self-shutdown?… [How to Convince a Climate Skeptic He’s Wrong,” Watts Up With That, April 9, 2015]

There follows a step-by-step dismantling of Mr. Bailey’s case for alarmism. Lord Monckton ends with this:

[I]f Mr Bailey does me the courtesy of reading the above, he will realize that temperatures are not rising by much, glacial ice-melt (if occurring) is on too small a scale to raise sea level by much, global sea ice extent shows little change in two generations, ditto northern-hemisphere snow cover, there has been little increase in rainfall and (according to the IPCC) little evidence for “stronger rainstorms”, and the ocean warming is so small that it falls within the considerable measurement error.

The evidence he adduces is questionable at best on every count. The Temple of Thermageddon will have to do better than that if it wants to convince us in the teeth of the evidence….

…[N]o rational scientific or economic case can be made for taking any action whatsoever today in a probably futile and certainly cost-ineffective attempt to make global warming that is not happening as predicted today go away the day after tomorrow.

The correct policy to address what is likely to prove a non-problem – and what, even if it were every bit as much of a problem as the tax-gobblers would wish, could not by even their most creative quantitative easing be cost-effectively solved by any attempt at mitigation – is to have the courage to do nothing now and adapt later if necessary.

The question is why, in the teeth of the scientific and economic evidence, nearly all of the global governing class were so easily taken in or bought out or both by the strange coalescence of powerful vested interests who have, until now, profited so monstrously by the biggest fraud in history at such crippling expense in lives and treasure to the rest of us, and at such mortal threat to the integrity and trustworthiness of science itself. [Ibid.]

My own modest effort to quell climate alarmism is summarized in “AGW: The Death Knell.”

*     *     *

Steve Sailer has some fun with the latest bit of experimental hocus-pocus by the intelligence-isn’t-heritable crowd, as interpreted by a reporter for The Washington Post:

In the last few years, there appears to have been a decision to blame racial differences in intelligence on differences in income level, although, of course, that’s not very plausible. That’s what people said way back in 1965, but then the federal Coleman Report of 1966 showed that affluent black students weren’t setting the world on fire academically on average, and vast amounts of data have accumulated validating the Coleman Report ever since.

But a half century later we’re back to asserting the same untested theories as in 1965….

Allow me to point out that a national newspaper has asked a couple of guys who know what they are talking about to punch holes in the latest bit of goodthink and, as of press time, the American public hasn’t dug up Hitler’s DNA and elected it President. So maybe we’re actually mature enough to discuss reality rather than lie all the time?…

Six decades from now, the Education Secretary of the hereditary Bush-Clinton Administration will be declaring the key periods for federal intervention are the eight months and 29 days before birth … but not a day sooner! [Charles Murray and James Thompson Asked Their Opinions in ‘Post’ Article on Brain Size; World Hasn’t Ended, Yet,” The Unz Review, April 15, 2015]

Along the way, Sailer links to Dr. James Thompson’s post about the article in question. There’s a followup post by Thompson, and this one is good, too. See also this post by Sailer.

Gregory Cochran has a related post (“Scanners Live in Vain,” West Hunter, March 31, 2015), where he says this about the paper and the reporting about it:

There is a new paper out in Nature Neuroscience,  mainly by Kimberly Noble, on socioeconomic variables and and brain structure:  Family income, parental education and brain structure in children and adolescents. They found that cortex area went up with income, although more slowly at high incomes.  Judging from their comments to the press, the authors think that being poor shrinks your brain.

Of course, since intelligence is highly heritable, and since people in higher social classes, or with high income, have higher average IQs (although not nearly as high as I would like), you would expect their kids to be, on average, smarter than kids from low-income groups (and have larger brains, since brain size is correlated with IQ) for genetic reasons.  But I guess the authors of this paper have never heard of  any of that – which raises the question, did they scan the brains of the authors?  Because that would have been interesting.  You can actually do microscopic MRI.

Even better, in talking to Nature, another researcher, Martha Farah,  mentions unpublished work that shows that the brain-size correlation with SES  is already there (in African-American kids) by age one month!

Of course, finding that the pattern already exists at the age of one month seriously weakens any idea that being poor shrinks the brain: most of the environmental effects you would consider haven’t even come into play in the first four weeks, when babies drink milk, sleep, and poop. Genetics affecting both parents and their children would make more sense, if the pattern shows up so early (and I’ll bet money that, if real,  it shows up well before one month);  but Martha Farah, and the reporter from Nature, Sara Reardon, ARE TOO FUCKING DUMB to realize this.

And John Ray points to this:

Quick thinkers are born not made, claim scientists.

They have discovered a link between our genes and the ability to remain mentally on the ball in later life.

It is the first time a genetic link has been shown to explain why some people have quick thinking skills.

Researchers identified a common genetic variant – changes in a person’s genetic code – related to how quickly a person is able to process new information. [Jenny Hope, “Quick Thinkers Are Born Not Made: The Speed at Which We Process New Information Is Written in Our Genes,” DailyMail.com, April 16, 2015]

Dr. Ray links to the underlying studies, here.

I’ve probably said more than I should say about the heritability of intelligence in “Race and Reason: The Achievement Gap — Causes and Implications,” “Evolution and Race,” “‘Wading’ into Race, Culture, and IQ,” and “The Harmful Myth of Inherent Equality.”

*     *     *

Speaking of equality, or the lack thereof, Daniel Bier explains “How Piketty Manufactured Rising [Wealth] Inequality in 6 Steps” (Foundation for Economic Education, April 9, 2015):

Piketty’s chart on US wealth inequality displayed a trend that none of its original sources showed. Worst of all, he didn’t tell his readers that he had done any of this, much less explained his reasoning.

But now Magness has deconstructed the chart and shown, step by step, how Piketty tortured his sources into giving him the result he wanted to see….

If your methods can produce opposite results using the same sources, depending entirely on your subjective judgment, you’re not doing science — you’re doing a Choose Your Own Adventure story where you start from the conclusion and work backwards.

Now that you’ve seen how it’s done, you too can “piketty” your data and massage your narrative into selling 1.5 million books — that almost no one will actually read, but will be widely cited as justification for higher taxes nonetheless.

Committed leftists will ignore Piketty’s step back from extreme redistributionism, which I discussed in “Not-So-Random Thoughts (XIII).”

*     *     *

Committed leftists will lament the predicate of “Has Obamacare Turned Voters Against Sharing the Wealth?” (The New York Times, April 15, 2015). The author of the piece, Thomas B. Edsall (formerly of The Washington Post), clearly laments the possibility. (I do not, of course.) Edsall’s article is full of good news (for me); for example:

In 2006, by a margin of more than two to one, 69-28, those surveyed by Gallup said that the federal government should guarantee health care coverage for all citizens of the United States. By late 2014, however, Gallup found that this percentage had fallen 24 points to 45 percent, while the percentage of respondents who said health care is not a federal responsibility nearly doubled to 52 percent.

Edsall’s main worry seems to be how such a mood shift will help Republicans. Evidently, he doesn’t care about taxpayers, people who earn their income, or economic growth, which is inhibited by redistribution from “rich” to “poor.” But what else is new? Edsall is just another representative of the elite punditariat — a member of the “top” part of the left’s “top and bottom” coalition.

Edsall and his ilk should be worried. See, for example, “The Obamacare Effect: Greater Distrust of Government” (the title tells the tale) and “‘Blue Wall’ Hype” which debunks the idea that Democrats have a lock on the presidency.

*     *     *

The question of nature vs. nurture, which I touched on three entries earlier, is closely related to the question of innate ability vs. effort as the key to success in a field of endeavor. “Scott Alexander” of Slate Star Codex has written at length about innate ability vs. effort in two recent posts: “No Clarity Around Growth Mindset…Yet” and “I Will Never Have the Ability to Clearly Explain My Beliefs about Growth Mindset.” (That should be “to explain clearly.”)

This is from the first-linked post:

If you’re not familiar with it, growth mindset is the belief that people who believe ability doesn’t matter and only effort determines success are more resilient, skillful, hard-working, perseverant in the face of failure, and better-in-a-bunch-of-other-ways than people who emphasize the importance of ability. Therefore, we can make everyone better off by telling them ability doesn’t matter and only hard work does.

This is all twaddle, as “Alexander” shows, more or less, in his two very long posts. My essay on the subject is a lot shorter and easier to grasp: “The Harmful Myth of Inherent Equality.”

*     *     *

ENTRIES ADDED 04/19/15:

Obamacare, not unsurprisingly to me, has led to the rationing of health care, according to Bob Unruh’s “Obamacare Blocks Patients Paying for Treatment” (WND, March 6, 2014). And Aleyne Singer delivers “More Proof Obamacare Is Increasing Coverage but Not Access to Health Care” (The Daily Signal, December 9, 2014).

None of this should surprise anyone who thought about the economics of Obamacare, as I did in “Rationing and Health Care,” “The Perils of Nannyism: The Case of Obamacare,” “More about the Perils of Obamacare,” and “Health-Care Reform: The Short of It.”

*     *     *

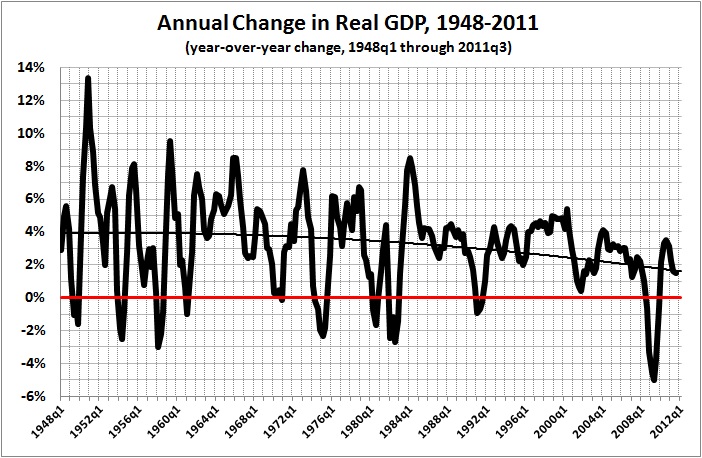
Ben Bernanke asks “Why Are Interest Rates So Low?” (Ben Bernanke’s Blog, March 30, 2015). His answer? In so many words, business is bad, which means that the demand for capital financing is relatively weak. But in a followup post, “Why Are Interest Rates So Low, Part 2: Secular Stagnation” (Ben Bernanke’s Blog, March 31, 2015), Bernanke argues that the problem isn’t secular stagnation.

I agree that interest rates are low because the economy remains weak, despite some recovery from the nadir of the Great Recession. But, unlike Bernanke, I don’t expect the economy to make a full recovery — and I’m talking about real growth, not phony unemployment-rate recovery. Why Not? See “Obamanomics in Action” and “The Rahn Curve Revisited.” The economy will never grow to its potential as long as the dead hand of government continues to press down on it.

Signature

Why Are Interest Rates So Low?

A REISSUE (WITHOUT UPDATES) OF THE ORIGINAL POST DATED DECEMBER 7, 2011

Interest rates reflect the supply of and demand for funds. Money is tighter now than it was in the years immediately before the onset of the Great Recession. Tim Congdon explains:

In the three years to October 2008, the quantity of money soared from $10,032 billion to $14,186 billion, with a compound annual growth rate of just over 12 per cent. The money growth rate in this period was the highest since the early 1970s. Indeed, 1972 and 1973 had many similarities to 2006 and 2007, with bubbling asset markets, buoyant consumer spending and incipient inflationary pressures. On the other hand, in the three years from October 2008 the quantity of money was virtually unchanged. (It stood at $14,340 billion in October 2011.) In other words, in the three years of the Great Recession the quantity of money did not increase at all.

But if money is relatively tight, why are interest rates so low? For example, as of October 2011, year-over-year inflation stood at 3.53 percent (derived from CPI-U estimates, available here). In October, Aaa bond yields averaged 3.98 percent, for a real rate of about 0.4 percent; Baa bond yields averaged 5.37 percent, for a real rate of about 1.8 percent; and conventional mortgages averaged 4.07 percent, for a real rate of about 0.5 percent. By contrast, in 1990-2000, when the CPI-U rose at an annual rate of 3.4 percent, real Aaa, Baa, and conventional mortgage rates hovered in the 4-6 percent range. (Real rates are derived from interest rate statistics available here.)

The reason for these (and other) low rates is that borrowers have become less keen about borrowing; that is, they lack confidence about future prospects for income (in the case of households) and returns on investment (in the case of businesses). Why should that be?

If the post-World War II trend is any indication — and I believe that it is — the American economy is sinking into stagnation. Here is the long view:

  • 1790-1861 — annual growth of 4.1 percent — a booming young economy, probably at its freest
  • 1866-1907 — annual growth of 4.3 percent — a robust economy, fueled by (mostly) laissez-faire policies and the concomitant rise of technological innovation and entrepreneurship
  • 1970-2010 — annual growth of 2.8 percent – sagging under the cumulative weight of “progressivism,” New Deal legislation, LBJ’s “Great Society” (with its legacy of the ever-expanding and oppressive welfare/transfer-payment schemes: Medicare, Medicaid, a more generous package of Social Security benefits), and an ever-growing mountain of regulatory restrictions.

(From this post, as updated in this one.)

And here is the post-World War II view:

Annual change in real GDP 1948-2011

This trend cannot be reversed by infusions of “stimulus spending” or “quantitative easing.” It reflects an underlying problem that cannot be cured by those simplistic macroeconomic “fixes.”

The underlying problem is not “tight money,” it is that American businesses are rightly pessimistic about an economic future that is dominated by a mountain of debt (in the form of promised “entitlements”) and by an ever-growing regulatory burden. Thus business investment has been a decline fraction of private-sector GDP:

Non-household GPDI fraction GDP - G
Derived from Bureau of Economic Analysis, Table 1.1.5. Gross Domestic Product (available here). The numerator is gross private domestic investment (GPDI, line 7) less the residential portion (line 12). The denominator is GDP (line 1) less government consumption expenditures and gross investment (line 21).

As long as business remains (rightly) pessimistic about the twin burdens of debt and regulation, the economy will sink deeper into stagnation. The only way to overcome that pessimism is to scale back “entitlements” and regulations, and to do so promptly and drastically.

In sum, the present focus on — and debate about — conventional macroeconomic “fixes” (fiscal vs. monetary policy) is entirely misguided. Today’s economists and policy-makers should consult Hayek, not Keynes or Friedman or their intellectual descendants. If economists and policy-makers would would read and heed Hayek — the Hayek of 1944 onward, in particular — they would understand that our present and future economic morass is entirely political in origin: Failed government policies have led to more failed government policies, which have shackled both the economy and the people.

Economic and political freedoms are indivisible. It will take the repeal of the regulatory-welfare state to restore prosperity and liberty to the land.

Mr. Greenspan Doth Protest Too Much

UPDATED BELOW

Alan Greenspan, former chairman of the Federal Reserve, disputes the assertion — made by many, including John Taylor of Stanford University — that

had the Federal Reserve from 2003-2005 kept short-term interest rates at the levels implied by [the] “Taylor Rule,” “it would have prevented this housing boom and bust. “

Mr. Greenspan continues:

Given the decoupling of monetary policy from long-term mortgage rates, accelerating the path of monetary tightening that the Fed pursued in 2004-2005 could not have “prevented” the housing bubble. All things considered, I personally prefer Milton Friedman’s performance appraisal of the Federal Reserve. In evaluating the period of 1987 to 2005, he wrote on this page in early 2006: “There is no other period of comparable length in which the Federal Reserve System has performed so well. It is more than a difference of degree; it approaches a difference of kind.”

It is unseemly for Mr. Greenspan to invoke Milton Friedman in this matter, given that Mr. Friedman died in 2006 and, therefore, did not live to see the debacle in the mortgage market.

More to the point, it is impossible to “decouple” financial markets from one another. Imagine trying to decouple the price of gasoline from the price of crude oil. The federal funds rate is determined by the Fed’s open market operations, that is, through the Fed’s expansion or contraction of the money supply. It is true that the only immediate effect of the federal funds rate is on the rate of interest at which banks borrow from and lend to each other. But those rate changes and the underlying changes in the money supply have ripple effects throughout financial markets.

Rates on long-term instruments, such as mortgages, “decouple” from the federal funds rate only when there is a shock to the market for those long-term instruments. The shock, in the case of the mortgage market, was a drop in the value of real-estate, followed by a squeeze on borrowers (primarily on sub-prime borrowers), followed by a jump in the incidence of defaults, followed by a sudden drop in the value of sub-prime mortgages and the derivatives created from them, etc., etc., etc.

But before that shock, the mortgage rate (like the rates of other financial instruments) had tracked the ups and downs of the federal funds rate:

Selected interest rates
Source: Federal Reserve Statistical Release H.15, Selected Interest Rates (annual data)

The recent divergence between the federal funds rate and the mortgage rate did not occur until 2008, that is, until after the collapse of the real-estate bubble — a bubble that was caused in large part by the Fed’s easing of interest rates from January 2001 to June 2004.

UPDATE: For corroboration of my analysis, see Robert Murphy’s “Greenspan’s Bogus Defense” (published April 8, 2009).

UPDATE 2: Now, Secretary of the Treasury Geithner avers that “monetary policy around the world was too loose too long.” Notice how Geithner tries to take the heat off the Fed by focusing on “the world.” But, as the WSJ piece (linked above) points out, Geithner is

still too quick to pass the buck from the Fed to other central banks. The European Central Bank was much tighter than the Fed throughout this period. The Fed was by far the major monetary player because much of the world was on a dollar standard, with its monetary policy linked to the Fed’s. That was true of China, most of Asia and the Middle East.

The Fed’s loose policy from 2003 to 2005 created the commodity and credit bubbles that made these countries flush with dollars. Given their low domestic propensity to consume, these countries then recycled those dollars back into dollar-denominated assets, such as Treasurys and real-estate-related assets such as Fannie Mae securities. The Fed itself had created the surplus dollars that kept long rates low and undermined for a substantial period its belated attempts to tighten.

Mr. Geithner’s concession is important nonetheless because before he moved to Treasury he was vice chairman of the Fed’s Open Market Committee that sets monetary policy. His comments mark a break with the steadfast refusal of Fed Chairmen Alan Greenspan and Ben Bernanke to admit any responsibility. They prefer to blame bankers and what they call the “global savings glut,” as if the Fed had nothing to do with creating that glut.

UPDATE 3: John Taylor links to more evidence for the Fed’s influence on interest rates.