UPDATED 09/15/17, 09/16/17, 09/12/18, 10/10/18, 10/22/19, 11/01/19, and 11/19/19. (Items are added occasionally to the list of related readings at the bottom of the post.)
Yes, hurricanes are bad things when they kill and injure people, destroy property, and saturate the soil with seawater. But hurricanes are in the category of “stuff happens”.
Contrary to the true believers in catastrophic anthropogenic global warming (CAGW), hurricanes are not the fault of human beings. Hurricanes are not nature’s “retribution” for mankind’s “sinful” ways, such as the use of fossil fuels.
How do I know? Because there are people who actually look at the numbers. See, for example, “Hate on Display: Climate Activists Go Bonkers Over #Irma and Nonexistent Climate Connection” by Anthony Watts (Watts Up With That?, September 11, 2017). See also Michel de Rougement’s “Correlation of Accumulated Cyclone Energy and Atlantic Multidecadal Oscillations” (Watts Up With That?, September 4, 2017).
M. de Rougemont’s post addresses accumulated cyclone energy (ACE):
The total energy accumulated each year by tropical storms and hurricanes (ACE) is also showing such a cyclic pattern.
NOAA’s Hurricane Research Division explanations on ACE: “the ACE is calculated by squaring the maximum sustained surface wind in the system every six hours (knots) and summing it up for the season. It is expressed in 104 kt2.” Direct instrumental observations are available as monthly series since 1848. A historic reconstruction since 1851 was done by NOAA (yearly means).

Figure 2 Yearly accumulated cyclone energy (ACE) ACE_7y: centered running average over 7 years
A correlation between ACE and AMO [Atlantic Multidecadal Oscillation] is confirmed by regression analysis.

Figure 3 Correlation ACE=f(AMO), using the running averages over 7 years. AMO: yearly means of the Atlantic Multidecadal Oscillations ACE_7y: yearly observed accumulated cyclone energy ACE_calc: calculated ACE by using the indicated formula.
Regression formula:


Thus, a simple, linear relation ties ACE to AMO, in part directly, and in part with an 18 years delay. The correlation coefficient is astonishingly good.
Anthony Watts adds fuel to this fire (or ice to this cocktail) in “Report: Ocean Cycles, Not Humans, May Be Behind Most Observed Climate Change” (Watts Up With That?, September 15, 2017). There, he discusses a report by Anastosios Tsonis, which I have added to the list of related readings, below:
… Anastasios Tsonis, emeritus distinguished professor of atmospheric sciences at the University of Wisconsin-Milwaukee, describes new and cutting-edge research into natural climatic cycles, including the well known El Nino cycle and the less familiar North Atlantic Oscillation and Pacific Decadal Oscillation.
He shows how interactions between these ocean cycles have been shown to drive changes in the global climate on timescales of several decades.
Professor Tsonis says:
We can show that at the start of the 20th century, the North Atlantic Oscillation pushed the global climate into a warming phase, and in 1940 it pushed it back into cooling mode. The famous “pause” in global warming at the start of the 21st century seems to have been instigated by the North Atlantic Oscillation too.
In fact, most of the changes in the global climate over the period of the instrumental record seem to have their origins in the North Atlantic.
Tsonis’ insights have profound implications for the way we view calls for climate alarm.
It may be that another shift in the North Atlantic could bring about another phase shift in the global climate, leading to renewed cooling or warming for several decades to come.
These climatic cycles are entirely natural, and can tell us nothing about the effect of carbon dioxide emissions. But they should inspire caution over the slowing trajectory of global warming we have seen in recent decades.
As Tsonis puts it:
While humans may play a role in climate change, other natural forces may play important roles too.
There are other reasons to be skeptical of CAGW, and even of AGW. For one thing, temperature records are notoriously unreliable, especially records from land-based thermometers. (See, for example, these two posts at Watt’s Up With That?: “Press Release – Watts at #AGU15 The Quality of Temperature Station Siting Matters for Temperature Trends” by Anthony Watts on December 17, 2015, and “Ooops! Australian BoM Climate Readings May Be invalid Due To Lack of Calibration“, on September 11, 2017.) And when those records aren’t skewed by siting and lack-of-coverage problems, they’re skewed by fudging the numbers to “prove” CAGW. (See my post, “Global-Warming Hype“, August 22, 2017.) Moreover, the models that “prove” CAGW and AGW are terrible, to put it bluntly. (Again, see “Global-Warming Hype“, and also Dr. Tim Ball’s post of September 16, 2017, “Climate Models Can’t Even Approximate Reality Because Atmospheric Structure and Movements are Virtually Unknown” at Watts Up With That?)
It’s certainly doubtful that NOAA’s reconstruction of ACE is accurate and consistent as far back as 1851. I hesitate to give credence to a data series that predates the confluence of satellite observations, ocean-buoys, and specially equipped aircraft. The history of weather satellites casts doubt on the validity of aggregate estimates for any period preceding the early 1960s.
As it happens, the data sets for tropical cyclone activity that are maintained by the Tropical Meteorology Project at Colorado State University cover all six of the relevant ocean basins as far back as 1972. The coverage goes back to 1961 (and beyond) for all but the North Indian Ocean basin — which is by far the least active.
Here is NOAA’s reconstruction of ACE in the North Atlantic basin through November 19, 2019, which, if anything, probably understates ACE before the early 1960s:
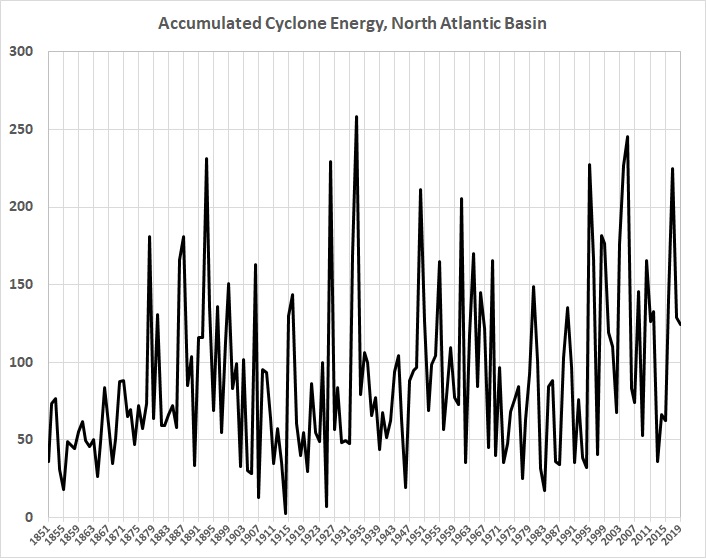
The recent spikes in ACE are not unprecedented. And there are many prominent spikes that predate the late-20th-century temperature rise on which “warmism” is predicated. The trend from the late 1800s to the present is essentially flat. And, again, the numbers before the early 1960s must understate ACE.
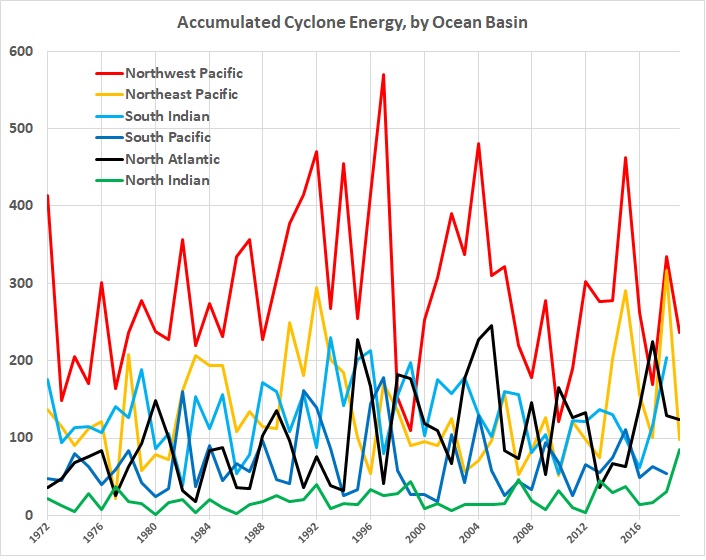
Moreover, the metric of real interest is global cyclone activity; the North Atlantic basin is just a sideshow. Consider this graph of the annual values for each basin from 1972 through November 19, 2019:
Here’s a graph of stacked (cumulative) totals for the same period:
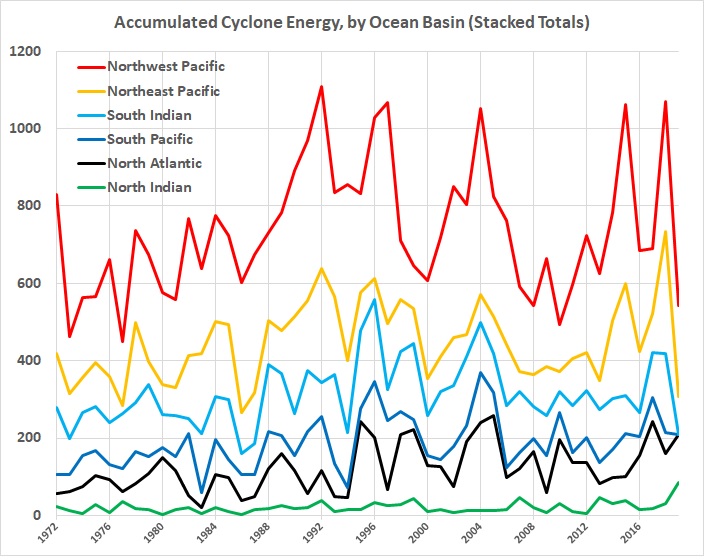
The red line is the sum of ACE for all six basins, including the Northwest Pacific basin; the yellow line in the sum of ACE for the next five basins, including the Northeast Pacific basin; etc.
I have these observations about the numbers represented in the preceding graphs:
- If one is a believer in CAGW (the G stands for global), it is a lie (by glaring omission) to focus on random, land-falling hurricanes hitting the U.S. or other parts of the Western Hemisphere.
- The overall level of activity is practically flat between 1972 and 2019, with the exception of spikes that coincide with strong El Niño events.
- There is nothing in the long-term record for the North Atlantic basin, which is probably understated before the early 1960s, to suggest that global activity in recent decades is unusually high.
I am very sorry for the victims of Michael, Florence, Harvey, Irma, and every weather-related disaster — and every disaster, whether man-made or not. But I am not about to reduce my carbon footprint because of the Luddite hysterics who dominate and cling to the quasi-science of climatology.
Related reading:
Ron Clutz, “Temperatures According to Climate Models“, Science Matters, March 24, 2015
Dr. Tim Ball, “Long-Term Climate Change: What Is a Reasonable Sample Size?“, Watts Up With That?, February 7, 2016
The Global Warming Policy Foundation, Climate Science: Assumptions, Policy Implications, and the Scientific Method, 2017
John Mauer, “Through the Looking Glass with NASA GISS“, Watts Up With That?, February 22, 2017
George White, “A Consensus of Convenience“, Watts Up With That?, August 20, 2017
Jennifer Marohasy, “Most of the Recent Warming Could be Natural“, Jennifer Marohasy, August 21, 2017
Anthony Watts, “What You Need to Know and Are Not Told about Hurricanes“, Watts Up With That?, September 15, 2017
Anastasios Tsonis, The Little Boy: El Niño and Natural Climate Change, Global Warming Policy Foundation, GWPF Report 26, 2017
Anthony Watts, “Pielke Jr. – U.S. Tornado Damage Continues to Fall, 2018 Activity Near Record Lows“, Watts Up With That?, July 25, 2018
Roger Pielke, “No, Hurricanes Are Not Bigger, Stronger and More Dangerous“, Forbes, November 15, 2019
Related page: Climate Change


