Through a painstaking series of adjustments for changes in playing standards and conditions, and for differences among ballparks, I have reassessed the single-season and career batting averages of the American League’s top hitters. The reassessment covers 120 players whose career average in the American League is at least .285 in at least 5,000 plate appearances.
I will devote a future post to a detailed explanation of the adjustments. In this post, I give an overview of the adjustments and present a revised ranking of the 120 players. I also discuss — but do not adjust for — the effects of age on the revised batting averages and relative standing of players.
I make three kinds of adjustments to nominal (official) BA. One adjustment is a time constant, which captures gradual changes from 1901 to the present that have worked against batters. Such changes would be the improvement of fielding gloves (which have made it harder to get hits, while also raising fielding averages), the introduction of night baseball, and the gradual increase in proportion of games played at night.
A second adjustment is an annual factor that captures the up-and-down swings in the relative difficulty of hitting. These swings have occurred because of changes in the ball, the frequency of its replacement, the size of the strike zone, and the height of the pitching mound, and perhaps other factors.
A third adjustment — one that is unique to each team-park combination — reflects the relative ease or difficulty of hitting in the various parks that have been used in the American League. In many cases the adjustment factor for a given park changes during the years of its use because of significant changes in the dimensions of the field.
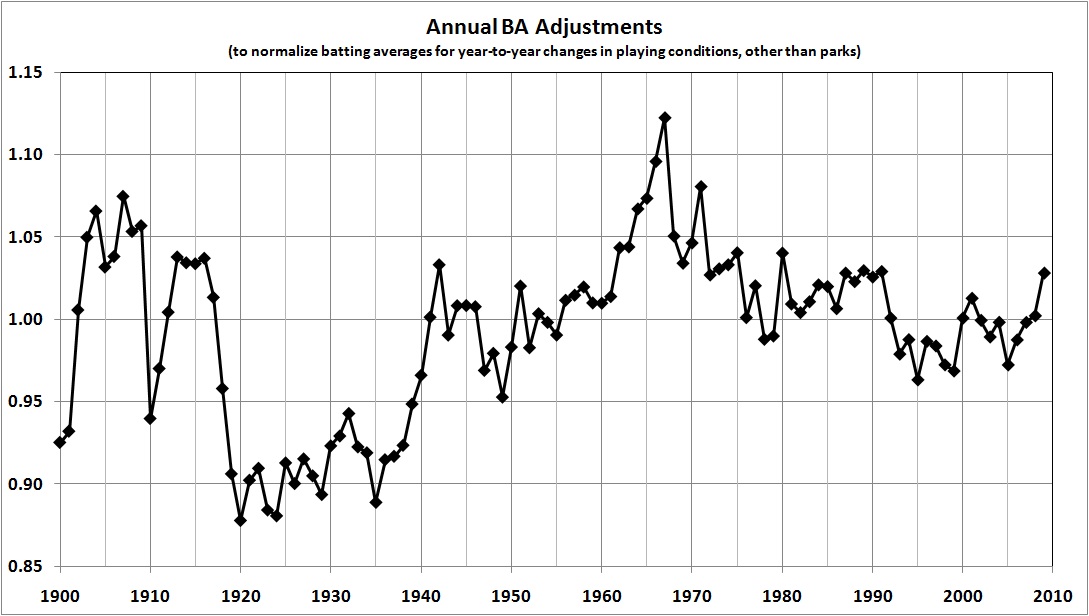
The following graph combines the effects of the first two adjustments into a single number for each season. A value greater than 1 means that each hitter’s nominal average for that season was increased to some degree. A value less than 1 means that each hitter’s average for that season was decreased to some degree.
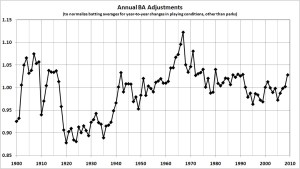
The largest upward adjustments affect averages compiled in the “deadball” years of 1902-1909 and 1913-1916, and in the “era of the pitcher,” from 1962 through 1975. The largest downward adjustments affect averages compiled in the first two years of the AL’s existence and the “lively” ball era, which — judging from the numbers — began in 1919 and lasted through 1938.
The final adjustments — for differences in parks — range widely. For example, Red Sox hiiters (including Ted Williams) suffered a penalty of 5.9 percent for the 1934-2010 seasons, when Fenway Park acquired its present dimensions. By contrast, Yankees who played in the original Yankee Stadium from 1923 through 1973 earned a boost of 4 percent because the original park (despite its short foul lines) was inimical to batters (including Joe DiMaggio).
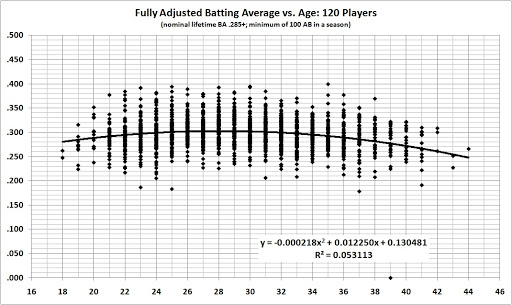
The following graph captures the total effect of the three adjustments. Each point represents one of the 120 hitters.
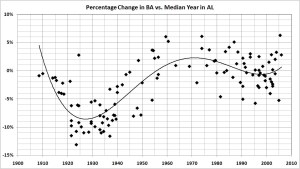 The pattern, which the curved line emphasizes, is consistent with the adjustments summarized in the first graph. The points don’t fall neatly on the curved line for three reasons: (1) variations in the length of players’ careers, (2) variations in the numbers of at-bats across seasons (and thus in the weight attached to a season in compiling a career average), and (3) the park-adjustment factor, which varies widely from park to park and (sometimes) for a particular park, if its configuration changed significantly.
How did the various adjustments affect the rankings? First, as would be expected because of the inflation of batting averages in the 1920s and 1930s, those decades are over-represented among the 120 hitters, as shown in the following table. (“Median year” refers to the decade in which a player’s median year occurs. For example, Ty Cobb’s career spanned 1905-1928, so he is counted as a member of the 1911-1920 decade in the following table and the one after it.)
| Distribution of Hitters, by Decade |
|
|
|
|
|
| Median year |
Number |
Percent |
| 1901-1910 |
2 |
1.7% |
| 1911-1920 |
7 |
5.8% |
| 1921-1930 |
17 |
14.2% |
| 1931-1940 |
21 |
17.5% |
| 1941-1950 |
8 |
6.7% |
| 1951-1960 |
8 |
6.7% |
| 1961-1970 |
3 |
2.5% |
| 1971-1980 |
8 |
6.7% |
| 1981-1990 |
10 |
8.3% |
| 1991-2000 |
22 |
18.3% |
| 2001-2010 |
14 |
11.7% |
|
|
120 |
100% |
The adjustments to nominal batting averages did a good job of rectifying the bias toward players of the 1920s and 1930s:
|
Average Rank, by Decade |
|
| Median year |
Nominal |
Adjusted |
Change* |
| 1901-1910 |
28 |
17 |
11 |
| 1911-1920 |
22 |
23 |
-1 |
| 1921-1930 |
29 |
65 |
-36 |
| 1931-1940 |
44 |
83 |
-39 |
| 1941-1950 |
60 |
63 |
-3 |
| 1951-1960 |
84 |
54 |
30 |
| 1961-1970 |
83 |
43 |
40 |
| 1971-1980 |
86 |
49 |
37 |
| 1981-1990 |
79 |
52 |
27 |
| 1991-2000 |
79 |
64 |
15 |
| 2001-2010 |
58 |
79 |
-21 |
|
| * Positive number represents improvement (higher average rank); negative number represents slippage (lower average rank). |
Until someone convinces me otherwise, I conclude that the top hitters of the “deadball” era really were great by comparison with those who came later. They are not alone at the top, however. Among the top 10 in the following table are a contemporary player (Ichiro Suzuki), a player of recent memory (Rod Carew), and three Yankees who enjoyed great years in the 1920s and 1930s (Babe Ruth, Lou Gehrig, and Joe DiMaggio). Here, then, are all 120 hitters, listed in the order of adjusted rank:
| Adjusted |
Nominal |
Player |
Years in AL |
Batting average |
% change |
# change |
| rank* |
rank |
(all-caps = Hall of Fame; asterisk = |
From |
To |
Nominal |
Adjusted |
in BA |
in rank |
|
|
active) |
|
|
|
|
|
|
| 1 |
12 |
Ichiro Suzuki* |
2001 |
2010 |
.331 |
.353 |
6.2% |
11 |
| 2 |
1 |
TY COBB |
1905 |
1928 |
.366 |
.353 |
-3.9% |
-1 |
| 3 |
2 |
Shoeless Joe Jackson |
1908 |
1920 |
.356 |
.351 |
-1.3% |
-1 |
| 4 |
10 |
NAP LAJOIE |
1901 |
1916 |
.336 |
.333 |
-0.9% |
6 |
| 5 |
3 |
TRIS SPEAKER |
1907 |
1928 |
.345 |
.331 |
-4.0% |
-2 |
| 6 |
16 |
ROD CAREW |
1967 |
1985 |
.328 |
.331 |
0.9% |
10 |
| 7 |
11 |
EDDIE COLLINS |
1906 |
1930 |
.333 |
.326 |
-2.2% |
4 |
| 8 |
6 |
BABE RUTH |
1914 |
1934 |
.343 |
.324 |
-6.1% |
-2 |
| 9 |
8 |
LOU GEHRIG |
1923 |
1939 |
.340 |
.323 |
-5.4% |
-1 |
| 10 |
18 |
JOE DIMAGGIO |
1936 |
1951 |
.325 |
.322 |
-0.7% |
8 |
| 11 |
4 |
TED WILLIAMS |
1939 |
1960 |
.344 |
.319 |
-7.9% |
-7 |
| 12 |
15 |
WADE BOGGS |
1982 |
1999 |
.328 |
.319 |
-2.8% |
3 |
| 13 |
47 |
Don Mattingly |
1982 |
1995 |
.307 |
.318 |
3.3% |
34 |
| 14 |
74 |
MICKEY MANTLE |
1951 |
1968 |
.298 |
.317 |
6.0% |
60 |
| 15 |
7 |
HARRY HEILMANN |
1914 |
1929 |
.342 |
.315 |
-8.9% |
-8 |
| 16 |
30 |
Derek Jeter* |
1995 |
2010 |
.314 |
.314 |
0.1% |
14 |
| 17 |
5 |
GEORGE SISLER |
1915 |
1928 |
.344 |
.313 |
-9.8% |
-12 |
| 18 |
36 |
Edgar Martinez |
1987 |
2004 |
.312 |
.312 |
0.1% |
18 |
| 19 |
25 |
KIRBY PUCKETT |
1984 |
1995 |
.318 |
.311 |
-2.1% |
6 |
| 20 |
89 |
EDDIE MURRAY |
1977 |
1997 |
.295 |
.311 |
5.1% |
69 |
| 21 |
99 |
Thurman Munson |
1969 |
1979 |
.292 |
.310 |
6.1% |
78 |
| 22 |
53 |
PAUL MOLITOR |
1978 |
1998 |
.306 |
.310 |
1.2% |
31 |
| 23 |
35 |
Magglio Ordonez* |
1997 |
2010 |
.312 |
.310 |
-0.6% |
12 |
| 24 |
31 |
Harvey Kuenn |
1952 |
1960 |
.313 |
.309 |
-1.4% |
7 |
| 25 |
44 |
Roberto Alomar |
1991 |
2004 |
.309 |
.308 |
-0.4% |
19 |
| 26 |
9 |
AL SIMMONS |
1924 |
1944 |
.337 |
.308 |
-9.3% |
-17 |
| 27 |
17 |
EARLE COMBS |
1924 |
1935 |
.325 |
.308 |
-5.6% |
-10 |
| 28 |
68 |
Minnie Minoso |
1949 |
1964 |
.300 |
.307 |
2.4% |
40 |
| 29 |
70 |
Joe Judge |
1915 |
1934 |
.299 |
.307 |
2.7% |
41 |
| 30 |
45 |
SAM CRAWFORD |
1903 |
1917 |
.309 |
.307 |
-0.5% |
15 |
| 31 |
55 |
Tony Oliva |
1962 |
1976 |
.304 |
.307 |
0.7% |
24 |
| 32 |
92 |
Mickey Rivers |
1970 |
1984 |
.295 |
.306 |
3.7% |
60 |
| 33 |
38 |
Baby Doll Jacobson |
1915 |
1927 |
.311 |
.305 |
-1.9% |
5 |
| 34 |
83 |
Carl Crawford* |
2002 |
2010 |
.296 |
.305 |
2.8% |
49 |
| 35 |
67 |
Julio Franco |
1983 |
1999 |
.301 |
.304 |
1.3% |
32 |
| 36 |
54 |
GEORGE BRETT |
1973 |
1993 |
.305 |
.304 |
-0.3% |
18 |
| 37 |
56 |
Paul O’Neill |
1993 |
2001 |
.303 |
.304 |
0.1% |
19 |
| 38 |
48 |
HOME RUN BAKER |
1908 |
1922 |
.307 |
.303 |
-1.2% |
10 |
| 39 |
72 |
Cecil Cooper |
1971 |
1987 |
.298 |
.303 |
1.7% |
33 |
| 40 |
20 |
SAM RICE |
1915 |
1934 |
.322 |
.303 |
-6.2% |
-20 |
| 41 |
14 |
HEINIE MANUSH |
1923 |
1936 |
.331 |
.303 |
-9.1% |
-27 |
| 42 |
32 |
BILL DICKEY |
1928 |
1946 |
.313 |
.303 |
-3.3% |
-10 |
| 43 |
101 |
Lou Piniella |
1964 |
1984 |
.291 |
.302 |
3.9% |
58 |
| 44 |
29 |
Cecil Travis |
1933 |
1947 |
.314 |
.302 |
-3.9% |
-15 |
| 45 |
103 |
Carney Lansford |
1978 |
1992 |
.290 |
.302 |
4.1% |
58 |
| 46 |
41 |
LUKE APPLING |
1930 |
1950 |
.310 |
.302 |
-2.8% |
-5 |
| 47 |
50 |
Stuffy McInnis |
1909 |
1922 |
.307 |
.302 |
-1.7% |
3 |
| 48 |
114 |
Bill Skowron |
1954 |
1967 |
.286 |
.301 |
5.2% |
66 |
| 49 |
98 |
Luis Polonia |
1987 |
2000 |
.292 |
.301 |
3.0% |
49 |
| 50 |
84 |
Garret Anderson |
1994 |
2008 |
.296 |
.301 |
1.5% |
34 |
| 51 |
79 |
AL KALINE |
1953 |
1974 |
.297 |
.300 |
0.9% |
28 |
| 52 |
52 |
GEORGE KELL |
1943 |
1957 |
.306 |
.300 |
-2.2% |
0 |
| 53 |
34 |
Manny Ramirez* |
1993 |
2010 |
.312 |
.300 |
-4.1% |
-19 |
| 54 |
81 |
Bernie Williams |
1991 |
2006 |
.297 |
.299 |
0.7% |
27 |
| 55 |
64 |
Frank Thomas |
1990 |
2008 |
.301 |
.299 |
-0.8% |
9 |
| 56 |
13 |
JIMMIE FOXX |
1925 |
1942 |
.331 |
.298 |
-11.1% |
-43 |
| 57 |
97 |
Mike Hargrove |
1974 |
1985 |
.292 |
.298 |
1.8% |
40 |
| 58 |
42 |
Bobby Veach |
1912 |
1925 |
.310 |
.298 |
-4.2% |
-16 |
| 59 |
60 |
Alex Rodriguez* |
1994 |
2010 |
.303 |
.297 |
-2.0% |
1 |
| 60 |
91 |
Kevin Seitzer |
1986 |
1997 |
.295 |
.297 |
0.6% |
31 |
| 61 |
105 |
John Olerud |
1989 |
2005 |
.289 |
.297 |
2.5% |
44 |
| 62 |
102 |
NELLIE FOX |
1947 |
1963 |
.290 |
.297 |
2.2% |
40 |
| 63 |
107 |
Wally Joyner |
1986 |
2001 |
.289 |
.296 |
2.4% |
44 |
| 64 |
104 |
Harold Baines |
1980 |
2001 |
.289 |
.296 |
2.2% |
40 |
| 65 |
112 |
Carlos Guillen* |
1998 |
2010 |
.286 |
.296 |
3.2% |
47 |
| 66 |
116 |
ROBIN YOUNT |
1974 |
1993 |
.285 |
.295 |
3.4% |
50 |
| 67 |
119 |
Gene Woodling |
1946 |
1962 |
.284 |
.295 |
3.6% |
52 |
| 68 |
90 |
LOU BOUDREAU |
1938 |
1952 |
.295 |
.294 |
-0.3% |
22 |
| 69 |
111 |
Raul Ibanez |
1996 |
2008 |
.286 |
.294 |
2.8% |
42 |
| 70 |
120 |
YOGI BERRA |
1946 |
1963 |
.284 |
.294 |
3.5% |
50 |
| 71 |
86 |
Kenny Lofton |
1992 |
2007 |
.296 |
.293 |
-1.0% |
15 |
| 72 |
23 |
HANK GREENBERG |
1930 |
1946 |
.319 |
.293 |
-8.8% |
-49 |
| 73 |
93 |
Albert Belle |
1989 |
2000 |
.295 |
.293 |
-0.8% |
20 |
| 74 |
94 |
Pete Runnels |
1951 |
1962 |
.294 |
.292 |
-0.7% |
20 |
| 75 |
82 |
Shannon Stewart |
1995 |
2008 |
.297 |
.292 |
-1.5% |
7 |
| 76 |
66 |
Ivan Rodriguez |
1991 |
2009 |
.301 |
.292 |
-3.0% |
-10 |
| 77 |
110 |
Mickey Vernon |
1939 |
1958 |
.287 |
.292 |
1.8% |
33 |
| 78 |
95 |
Hal McRae |
1973 |
1987 |
.293 |
.292 |
-0.4% |
17 |
| 79 |
96 |
Tony Fernandez |
1983 |
2001 |
.293 |
.292 |
-0.4% |
17 |
| 80 |
115 |
Miguel Tejada* |
1997 |
2010 |
.286 |
.292 |
2.0% |
35 |
| 81 |
22 |
MICKEY COCHRANE |
1925 |
1937 |
.320 |
.291 |
-10.0% |
-59 |
| 82 |
78 |
Mike Sweeney |
1995 |
2010 |
.298 |
.291 |
-2.4% |
-4 |
| 83 |
21 |
CHARLIE GEHRINGER |
1924 |
1942 |
.320 |
.290 |
-10.5% |
-62 |
| 84 |
80 |
Buddy Lewis |
1935 |
1949 |
.297 |
.290 |
-2.5% |
-4 |
| 85 |
49 |
George Burns |
1914 |
1929 |
.307 |
.289 |
-6.2% |
-36 |
| 86 |
26 |
GOOSE GOSLIN |
1921 |
1938 |
.316 |
.289 |
-9.4% |
-60 |
| 87 |
58 |
Mike Greenwell |
1985 |
1996 |
.303 |
.288 |
-5.1% |
-29 |
| 88 |
51 |
Johnny Pesky |
1942 |
1954 |
.307 |
.287 |
-6.7% |
-37 |
| 89 |
24 |
EARL AVERILL |
1929 |
1940 |
.318 |
.287 |
-10.8% |
-65 |
| 90 |
88 |
Juan Gonzalez |
1989 |
2005 |
.295 |
.287 |
-3.0% |
-2 |
| 91 |
43 |
John Stone |
1928 |
1938 |
.310 |
.287 |
-8.0% |
-48 |
| 92 |
19 |
Ken Williams |
1918 |
1929 |
.324 |
.286 |
-13.1% |
-73 |
| 93 |
100 |
Ken Griffey |
1989 |
2010 |
.291 |
.286 |
-1.8% |
7 |
| 94 |
65 |
Billy Goodman |
1947 |
1961 |
.301 |
.286 |
-5.2% |
-29 |
| 95 |
28 |
Bibb Falk |
1920 |
1931 |
.314 |
.286 |
-10.0% |
-67 |
| 96 |
113 |
Willie Wilson |
1976 |
1992 |
.286 |
.286 |
0.0% |
17 |
| 97 |
108 |
Rafael Palmeiro |
1989 |
2005 |
.288 |
.285 |
-0.8% |
11 |
| 98 |
59 |
Buddy Myer |
1925 |
1941 |
.303 |
.285 |
-6.1% |
-39 |
| 99 |
69 |
Michael Young* |
2000 |
2010 |
.300 |
.285 |
-5.3% |
-30 |
| 100 |
73 |
JIM RICE |
1974 |
1989 |
.298 |
.285 |
-4.6% |
-27 |
| 101 |
39 |
Bob Meusel |
1920 |
1929 |
.311 |
.285 |
-9.2% |
-62 |
| 102 |
46 |
Gee Walker |
1931 |
1941 |
.307 |
.283 |
-8.6% |
-56 |
| 103 |
62 |
Ben Chapman |
1930 |
1941 |
.302 |
.282 |
-7.1% |
-41 |
| 104 |
27 |
Jack Tobin |
1916 |
1927 |
.315 |
.282 |
-11.5% |
-77 |
| 105 |
117 |
Alan Trammell |
1977 |
1996 |
.285 |
.282 |
-1.2% |
12 |
| 106 |
76 |
Mo Vaughn |
1991 |
2000 |
.298 |
.281 |
-5.8% |
-30 |
| 107 |
106 |
Chuck Knoblauch |
1991 |
2002 |
.289 |
.281 |
-2.7% |
-1 |
| 108 |
33 |
JOE SEWELL |
1920 |
1933 |
.312 |
.281 |
-11.0% |
-75 |
| 109 |
37 |
Bing Miller |
1921 |
1936 |
.311 |
.281 |
-10.9% |
-72 |
| 110 |
85 |
Bob Johnson |
1933 |
1945 |
.296 |
.280 |
-6.0% |
-25 |
| 111 |
109 |
Johnny Damon* |
1995 |
2010 |
.287 |
.280 |
-2.8% |
-2 |
| 112 |
118 |
CARL YASTRZEMSKI |
1961 |
1983 |
.285 |
.279 |
-2.2% |
6 |
| 113 |
61 |
Hal Trosky |
1933 |
1946 |
.302 |
.278 |
-8.6% |
-52 |
| 114 |
40 |
Joe Vosmik |
1930 |
1944 |
.311 |
.278 |
-11.6% |
-74 |
| 115 |
71 |
Sam West |
1927 |
1942 |
.299 |
.276 |
-8.2% |
-44 |
| 116 |
77 |
Pete Fox |
1933 |
1945 |
.298 |
.276 |
-8.0% |
-39 |
| 117 |
75 |
Dom DiMaggio |
1940 |
1953 |
.298 |
.276 |
-8.1% |
-42 |
| 118 |
63 |
JOE CRONIN |
1928 |
1945 |
.302 |
.275 |
-9.7% |
-55 |
| 119 |
87 |
Doc Cramer |
1929 |
1948 |
.296 |
.274 |
-7.9% |
-32 |
| 120 |
57 |
Charlie Jamieson |
1915 |
1932 |
.303 |
.274 |
-10.8% |
-63 |
|
|
|
|
|
|
|
|
|
| * The adjusted rank considers only the 120 players listed here. Players not listed could outrank some of the players near the bottom of the list. |
The names of Hall-of-Famers are capitalized to draw your attention to several who were enshrined mainly on the strength of grossly inflated batting averages.
There is more work to be done, especially with respect to age. Consider, for example, Shoeless Joe Jackson, whose career ended at age 30. Had Jackson continued to play until he was 40, say, his career average would have declined, and with it his position on the list.
Ichiro Suzuki didn’t play in the U.S. until he was 27. Would his career average be even higher if he had crossed over the Pacific in his early 20s? He is atop the list because of his post-32 performance, relative to Ty Cobb’s.
Then there is the case of Ted Williams, whose average and ranking slipped markedly because he enjoyed the friendly confines of Fenway Park. But Williams, who also hit well in his “old age,” missed a lot of peak batting time during WWII and the Korean War.
I will end, for now, with this tantalizing comparison of Suzuki, Cobb, Jackson, and Williams:
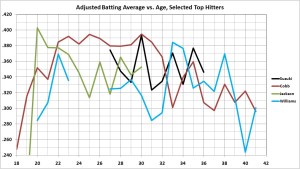
Cobb’s consistent brilliance from age 22 to age 32 borders on the amazing. Williams was a great “old” hitter, as Suzuki is proving to be. It is evident that Jackson, despite the closeness of his average to Cobb’s, probably wouldn’t have caught Cobb, unless he had finished in a Suzuki-like manner.
ADDENDUM:
Final, age-adjusted BA for the top-3 all-time AL hitters:
| Cobb |
0.363919 |
| Suzuki |
0.358241 |
| Jackson |
0.355946 |
Go here for details.
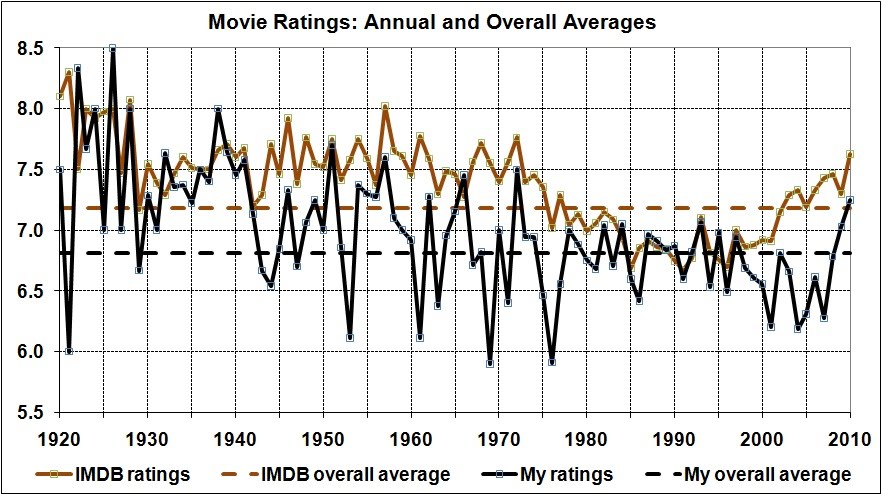
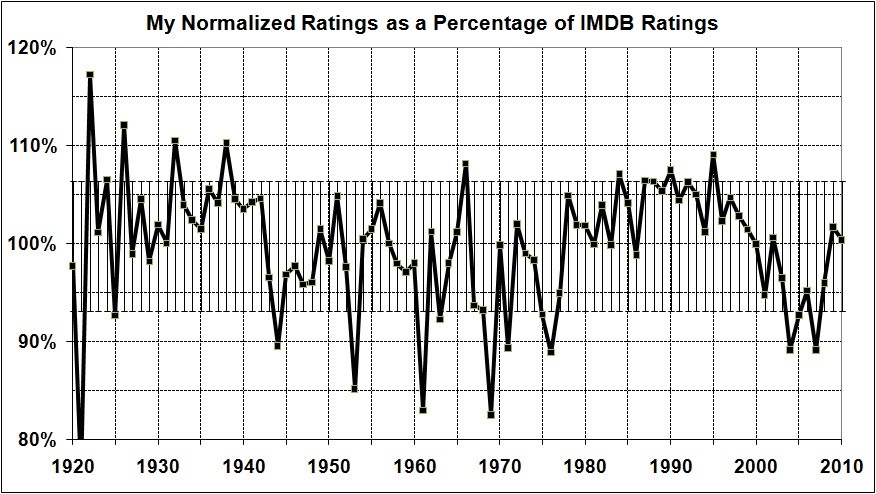
 The blue bars denote the ratings given by IMDb viewers to some 113,000 feature films. The average rating assigned to all of those films is 5.8, in contrast with the 7.1 assigned by IMDb users to films I’ve rated (my average rating, 6.8). The distribution of the red and green bars, relative to the blue ones, attests to my selectivity in choosing films to watch.
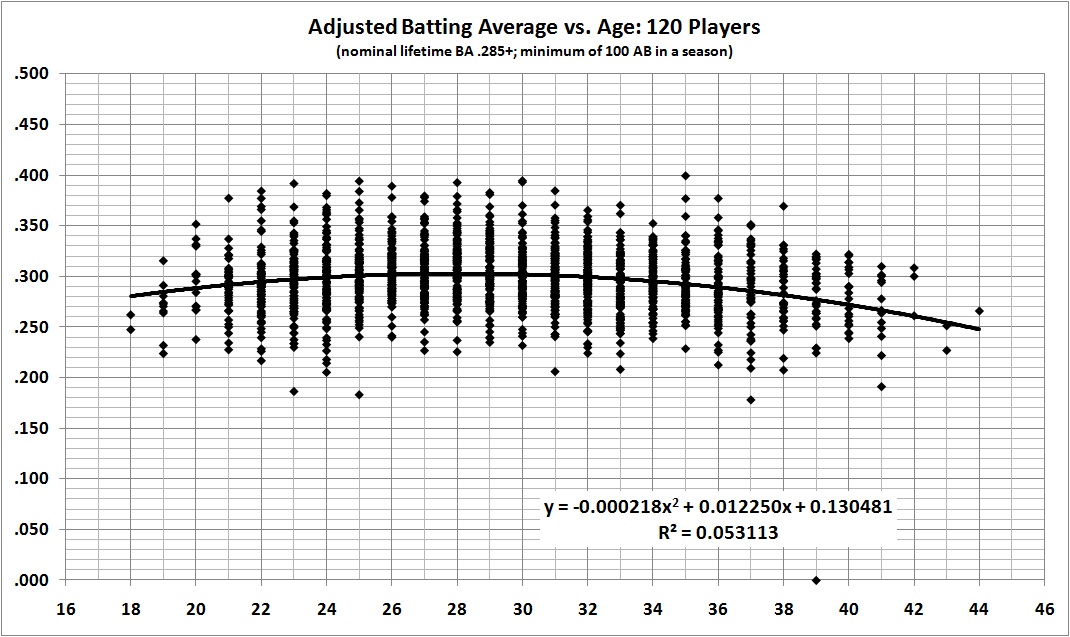


