UPDATED WITH AN ADDENDUM, 09/08/17
I posted “Trump vs. Obama” on August 15. I said (in part) that
Trump’s recent upswing [in popularity] relative to Obama [at the same stage of his presidency] reflects not only a slight softening of opinions about Trump’s presidency, but also the rapid decline in Obama’s popularity in the summer of 2009….
Given the media’s incessant attacks on Trump, it seems unlikely that he’ll ever gain parity with Obama — whose negative ratings were based on his actual (and abysmal) performance.
Then came the riot in Charlottesville and Trump’s politically incorrect (but correct) assignment of blame to “all sides” — including the fascists of the Antifa movement. That episode is now in the distant past, inasmuch as events more than a few days old are ancient history in the media’s view.
At any rate, Trump’s upswing relative to Obama has resumed. Here’s the story:
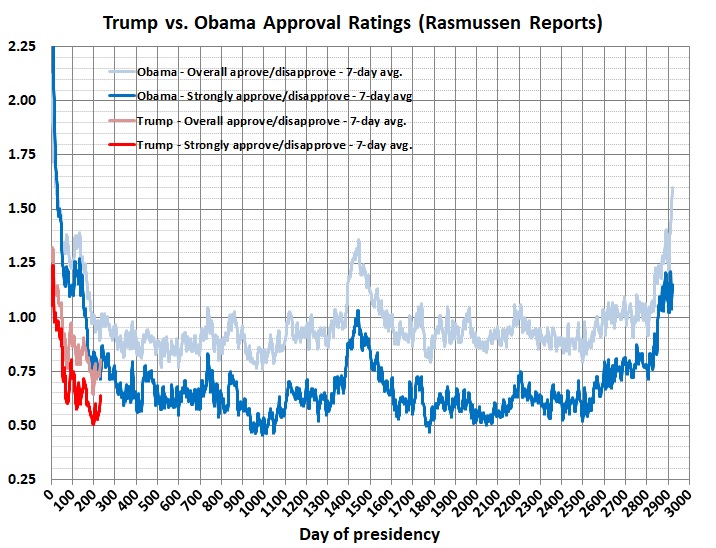
Derived from polling statistics for Obama and Trump published by Rasmussen Reports.
Each line represents the ratio of favorable to unfavorable views. Values above 1 mean that the favorables outweigh the unfavorables; values below 1 mean that the unfavorables outweigh the favorables. The light-blue and light-red lines track the 7-day averages of Obama and Trump’s overall ratings with likely voters. The dark-blue and dark-red lines track the 7-day averages of Obama and Trump’s ratings with likely voters who express strong approval or disapproval.
Trump’s comparative disadvantage continues to shrink. Here are ratios of the ratios plotted in the first graph:
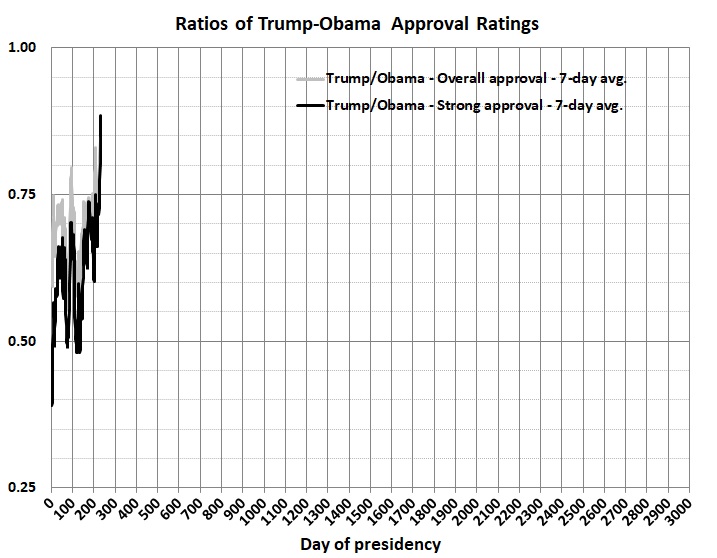
It now seems possible that Trump can become more popular — or less unpopular — than Obama was. Stay tuned.
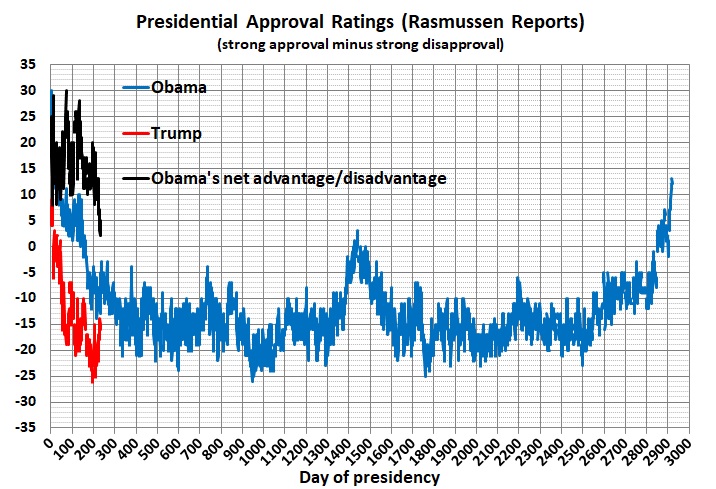
ADDENDUM
Some readers may be uncomfortable with ratios and ratios of ratios, so the graph below plots Rasmussen’s presidential approval ratings for Obama and Trump, and the difference between them. Rasmussen’s presidential approval ratings are simply the arithmetic difference between the percentage of respondents who express strong approval and the percentage who express strong disapproval. Obama’s net advantage/disadvantage is just the arithmetic difference between the ratings for Obama and Trump.
The patterns are the same as those in the preceding graphs. Trump is still underwater but is nevertheless catching up to Obama, who was sinking fast eight years ago.