Links to the other posts in this occasional series may be found at “Favorite Posts,” just below the list of topics.
How Much Are Teachers Worth?
David Harsanyi writes:
“The bottom line,” says the Center for American Progress, “is that mid- and late-career teachers are not earning what they deserve, nor are they able to gain the salaries that support a middle-class existence.”
Alas, neither liberal think tanks nor explainer sites have the capacity to determine the worth of human capital. And contrasting the pay of a person who has a predetermined government salary with the pay earned by someone in a competitive marketplace tells us little. Public-school teachers’ compensation is determined by contracts negotiated long before many of them even decided to teach. These contracts hurt the earning potential of good teachers and undermine the education system. And it has nothing to do with what anyone “deserves.”
So if teachers believe they aren’t making what they’re worth — and they may well be right about that — let’s free them from union constraints and let them find out what the job market has to offer. Until then, we can’t really know. Because a bachelor’s degree isn’t a dispensation from the vagaries of economic reality. And teaching isn’t the first step toward sainthood. Regardless of what you’ve heard. (“Are Teachers Underpaid? Let’s Find Out,” Creators.com, July 25, 2014)
Harsanyi is right, but too kind. Here’s my take, from “The Public-School Swindle“:
[P]ublic “education” — at all levels — is not just a rip-off of taxpayers, it is also an employment scheme for incompetents (especially at the K-12 level) and a paternalistic redirection of resources to second- and third-best uses.
And, to top it off, public education has led to the creation of an army of left-wing zealots who, for many decades, have inculcated America’s children and young adults in the advantages of collective, non-market, anti-libertarian institutions, where paternalistic “empathy” supplants personal responsibility.
Utilitarianism, Once More
EconLog bloggers Bryan Caplan and Scott Sumner are enjoying an esoteric exchange about utilitarianism (samples here and here), which is a kind of cost-benefit calculus in which the calculator presumes to weigh the costs and benefits that accrue to other persons. My take is that utilitarianism borders on psychopathy. In “Utilitarianism and Psychopathy,” I quote myself to this effect:
Here’s the problem with cost-benefit analysis — the problem it shares with utilitarianism: One person’s benefit can’t be compared with another person’s cost. Suppose, for example, the City of Los Angeles were to conduct a cost-benefit analysis that “proved” the wisdom of constructing yet another freeway through the city in order to reduce the commuting time of workers who drive into the city from the suburbs.
Before constructing the freeway, the city would have to take residential and commercial property. The occupants of those homes and owners of those businesses (who, in many cases would be lessees and not landowners) would have to start anew elsewhere. The customers of the affected businesses would have to find alternative sources of goods and services. Compensation under eminent domain can never be adequate to the owners of taken property because the property is taken by force and not sold voluntarily at a true market price. Moreover, others who are also harmed by a taking (lessees and customers in this example) are never compensated for their losses. Now, how can all of this uncompensated cost and inconvenience be “justified” by, say, the greater productivity that might (emphasize might) accrue to those commuters who would benefit from the construction of yet another freeway.
Yet, that is how cost-benefit analysis works. It assumes that group A’s cost can be offset by group B’s benefit: “the greatest amount of happiness altogether.”
America’s Financial Crisis
Timothy Taylor tackles the looming debt crisis:
First, the current high level of government debt, and the projections for the next 25 years, mean that the U.S. government lacks fiscal flexibility….
Second, the current spending patterns of the U.S. government are starting to crowd out everything except health care, Social Security, and interest payments….
Third, large government borrowing means less funding is available for private investment….
…CBO calculates an “alternative fiscal scenario,” in which it sets aside some of these spending and tax changes that are scheduled to take effect in five years or ten years or never…. [T]he extended baseline scenario projected that the debt/GDP ratio would be 106% by 2039. In the alternative fiscal scenario, the debt-GDP ratio is projected to reach 183% of GDP by 2039. As the report notes: “CBO’s extended alternative fiscal scenario is based on the assumptions that certain policies that are now in place but are scheduled to change under current law will be continued and that some provisions of law that might be difficult to sustain for a long period will be modified. The scenario, therefore, captures what some analysts might consider to be current policies, as opposed to current laws.”…
My own judgement is that the path of future budget deficits in the next decade or so is likely to lean toward the alternative fiscal scenario. But long before we reach a debt/GDP ratio of 183%, something is going to give. I don’t know what will change. But as an old-school economist named Herb Stein used to say, “If something can’t go on, it won’t.” (Long Term Budget Deficits,” Conversable Economist, July 24, 2014)
Professional economists are terribly low-key, aren’t they? Here’s the way I see it, in “America’s Financial Crisis Is Now“:
It will not do simply to put an end to the U.S. government’s spending spree; too many State and local governments stand ready to fill the void, and they will do so by raising taxes where they can. As a result, some jurisdictions will fall into California- and Michigan-like death-spirals while jobs and growth migrate to other jurisdictions…. Even if Congress resists the urge to give aid and comfort to profligate States and municipalities at the expense of the taxpayers of fiscally prudent jurisdictions, the high taxes and anti-business regimes of California- and Michigan-like jurisdictions impose deadweight losses on the whole economy….
So, the resistance to economically destructive policies cannot end with efforts to reverse the policies of the federal government. But given the vast destructiveness of those policies — “entitlements” in particular — the resistance must begin there. Every conservative and libertarian voice in the land must be raised in reasoned opposition to the perpetuation of the unsustainable “promises” currently embedded in Social Security, Medicare, and Medicaid — and their expansion through Obamacare. To those voices must be added the voices of “moderates” and “liberals” who see through the proclaimed good intentions of “entitlements” to the economic and libertarian disaster that looms if those “entitlements” are not pared down to their original purpose: providing a safety net for the truly needy.
The alternative to successful resistance is stark: more borrowing, higher interest payments, unsustainable debt, higher taxes, and economic stagnation (at best).
For the gory details about government spending and economic stagnation, see “Estimating the Rahn Curve: Or, How Government Spending Inhibits Economic Growth” and “The True Multiplier.”
Climate Change: More Evidence against the Myth of AGW
There are voices of reason, that is, real scientists doing real science:
Over the 55-years from 1958 to 2012, climate models not only significantly over-predict observed warming in the tropical troposphere, but they represent it in a fundamentally different way than is observed. (Ross McKittrick and Timothy Vogelsang, “Climate models not only significantly over-predict observed warming in the tropical troposphere, but they represent it in a fundamentally different way than is observed,” excerpted at Watt’s Up With That, July 24, 2014)
Since the 1980s anthropogenic aerosols have been considerably reduced in Europe and the Mediterranean area. This decrease is often considered as the likely cause of the brightening effect observed over the same period. This phenomenon is however hardly reproduced by global and regional climate models. Here we use an original approach based on reanalysis-driven coupled regional climate system modelling, to show that aerosol changes explain 81 ± 16 per cent of the brightening and 23 ± 5 per cent of the surface warming simulated for the period 1980–2012 over Europe. The direct aerosol effect is found to dominate in the magnitude of the simulated brightening. The comparison between regional simulations and homogenized ground-based observations reveals that observed surface solar radiation, as well as land and sea surface temperature spatio-temporal variations over the Euro-Mediterranean region are only reproduced when simulations include the realistic aerosol variations. (“New paper finds 23% of warming in Europe since 1980 due to clean air laws reducing sulfur dioxide,” The Hockey Schtick, July 23, 2014)
My (somewhat out-of-date but still useful) roundup of related posts and articles is at “AGW: The Death Knell.”
Crime Explained…
…but not by this simplistic item:
Of all of the notions that have motivated the decades-long rise of incarceration in the United States, this is probably the most basic: When we put people behind bars, they can’t commit crime.
The implied corollary: If we let them out, they will….
Crime trends in a few states that have significantly reduced their prison populations, though, contradict this fear. (Emily Badger, “There’s little evidence that fewer prisoners means more crime,” Wonkblog, The Washington Post, July 21, 2014)
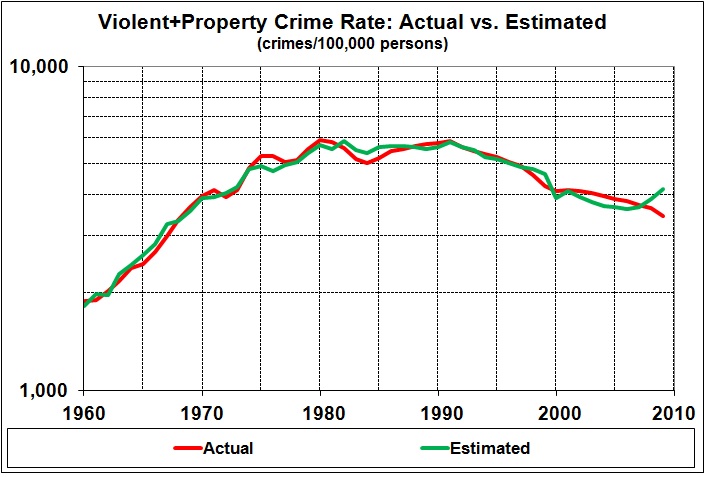
Staring at charts doesn’t yield answers to complex, multivariate questions, such as the causes of crime. Ms. Badger should have extended my work of seven years ago (“Crime, Explained“). Had she, I’m confident that she would have obtained the same result, namely:
VPC (violent+property crimes per 100,000 persons) =
-33174.6
+346837BLK (number of blacks as a decimal fraction of the population)
-3040.46GRO (previous year’s change in real GDP per capita, as a decimal fraction of the base)
-1474741PRS (the number of inmates in federal and State prisons in December of the previous year, as a decimal fraction of the previous year’s population)
The t-statistics on the intercept and coefficients are 19.017, 21.564, 1.210, and 17.253, respectively; the adjusted R-squared is 0.923; the standard error of the estimate/mean value of VPC = 0.076.
The coefficient and t-statistic for PRS mean that incarceration has a strong, statistically significant, negative effect on the violent-property crime rate. In other words, more prisoners = less crime against persons and their property.
The Heritability of Intelligence
Strip away the trappings of culture and what do you find? This:
If a chimpanzee appears unusually intelligent, it probably had bright parents. That’s the message from the first study to check if chimp brain power is heritable.
The discovery could help to tease apart the genes that affect chimp intelligence and to see whether those genes in humans also influence intelligence. It might also help to identify additional genetic factors that give humans the intellectual edge over their non-human-primate cousins.
The researchers estimate that, similar to humans, genetic differences account for about 54 per cent of the range seen in “general intelligence” – dubbed “g” – which is measured via a series of cognitive tests. “Our results in chimps are quite consistent with data from humans, and the human heritability in g,” says William Hopkins of the Yerkes National Primate Research Center in Atlanta, Georgia, who heads the team reporting its findings in Current Biology.
“The historical view is that non-genetic factors dominate animal intelligence, and our findings challenge that view,” says Hopkins. (Andy Coghlan, “Chimpanzee brain power is strongly heritable,” New Scientist, July 10, 2014)
Such findings are consistent with Nicholas Wade’s politically incorrect A Troublesome Inheritance: Genes, Race and Human History. For related readings, see “‘Wading’ into Race, Culture, and IQ’.” For a summary of scholarly evidence about the heritability of intelligence — and its dire implications — see “Race and Reason — The Achievement Gap: Causes and Implications.” John Derbyshire offers an even darker view: “America in 2034” (American Renaissance, June 9, 2014).
The correlation of race and intelligence is, for me, an objective matter, not an emotional one. For evidence of my racial impartiality, see the final item in “My Moral Profile.”


")
