Unsurprising News

John Taylor writes that “New Research Bolsters Policy Link from Uncertainty to Economy“:

Last week a joint Princeton-Stanford conference held in Princeton focused on policy uncertainty and showcased new findings on connections between policy uncertainty and political polarization and on patterns in different states, countries and time periods.

Danny Shoag, for example, presented new work “Uncertainty and the Geography of the Great Recession,” co-authored with Stan Veuger, showing that  policy uncertainty across the United States has been highly and robustly correlated with state unemployment rates. As the authors explain, their “paper serves to counter such claims” as those made by Atif Mian and Amir Sufi that “an increase in business uncertainty at the aggregate level does not explain the stark cross-sectional patterns in employment losses” which had cast doubt on the role of policy uncertainty. Scott Baker, Nick Bloom and Steve Davis had written extensively on this at the national level and also presented new work at the conference.

I’ve written about Baker, Bloom, and Davis’s work here.

Ross Douthat comments about “Diversity and Dishonesty“:

Earlier this year, a column by a Harvard undergraduate named Sandra Y. L. Korn briefly achieved escape velocity from the Ivy League bubble, thanks to its daring view of how universities should approach academic freedom.

Korn proposed that such freedom was dated and destructive, and that a doctrine of “academic justice” should prevail instead. No more, she wrote, should Harvard permit its faculty to engage in “research promoting or justifying oppression” or produce work tainted by “racism, sexism, and heterosexism.” Instead, academic culture should conform to left-wing ideas of the good, beautiful and true, and decline as a matter of principle “to put up with research that counters our goals.”

Which reminds me of the story behind Robert Putnam’s “E Pluribus Unum: Diversity and Community in the Twenty-first Century,” which I recount here. In short, Putnam withheld publication of his paper because it refutes the leftist mantra “diversity is good.”

Finally, we are told by David Z. Hambrick and Christopher Chabris that “Yes, IQ Really Matters“:

The SAT does predict success in college—not perfectly, but relatively well, especially given that it takes just a few hours to administer. And, unlike a “complex portrait” of a student’s life, it can be scored in an objective way…. In a study published in Psychological Science, University of Minnesota researchers Paul Sackett, Nathan Kuncel, and their colleagues investigated the relationship between SAT scores and college grades in a very large sample: nearly 150,000 students from 110 colleges and universities. SAT scores predicted first-year college GPA about as well as high school grades did, and the best prediction was achieved by considering both factors. Botstein, Boylan, and Kolbert are either unaware of this directly relevant, easily accessible, and widely disseminated empirical evidence, or they have decided to ignore it and base their claims on intuition and anecdote—or perhaps on their beliefs about the way the world should be rather than the way it is.

Furthermore, contrary to popular belief, it’s not just first-year college GPA that SAT scores predict. In a four-year study that started with nearly 3,000 college students, a team of Michigan State University researchers led by Neal Schmitt found that test score (SAT or ACT—whichever the student took) correlated strongly with cumulative GPA at the end of the fourth year. If the students were ranked on both their test scores and cumulative GPAs, those who had test scores in the top half (above the 50th percentile, or median) would have had a roughly two-thirds chance of having a cumulative GPA in the top half. By contrast, students with bottom-half SAT scores would be only one-third likely to make it to the top half in GPA….

[I]t is clear that [socioeconomic status] is not what accounts for the fact that SAT scores predict success in college. In the University of Minnesota study, the correlation between high school SAT and college GPA was virtually unchanged after the researchers statistically controlled for the influence of SES. If SAT scores were just a proxy for privilege, then putting SES into the mix should have removed, or at least dramatically decreased, the association between the SAT and college performance….

What this all means is that the SAT measures something—some stable characteristic of high school students other than their parents’ income—that translates into success in college. And what could that characteristic be? General intelligence….

IQ predicts many different measures of success. Exhibit A is evidence from research on job performance by the University of Iowa industrial psychologist Frank Schmidt and his late colleague John Hunter. Synthesizing evidence from nearly a century of empirical studies, Schmidt and Hunter established that general mental ability—the psychological trait that IQ scores reflect—is the single best predictor of job training success, and that it accounts for differences in job performance even in workers with more than a decade of experience. It’s more predictive than interests, personality, reference checks, and interview performance. Smart people don’t just make better mathematicians, as Brooks observed—they make better managers, clerks, salespeople, service workers, vehicle operators, and soldiers.

IQ predicts other things that matter, too, like income, employment, health, and even longevity. In a 2001 study published in the British Medical Journal, Scottish researchers Lawrence Whalley and Ian Deary identified more than 2,000 people who had taken part in the Scottish Mental Survey of 1932, a nationwide assessment of IQ. Remarkably, people with high IQs at age 11 were more considerably more likely to survive to old age than were people with lower IQs. For example, a person with an IQ of 100 (the average for the general population) was 21 percent more likely to live to age 76 than a person with an IQ of 85. And the relationship between IQ and longevity remains statistically significant even after taking SES into account. Perhaps IQ reflects the mental resources—the reasoning and problem-solving skills—that people can bring to bear on maintaining their health and making wise decisions throughout life. This explanation is supported by evidence that higher-IQ individuals engage in more positive health behaviors, such as deciding to quit smoking….

[T]he bottom line is that there are large, measurable differences among people in intellectual ability, and these differences have consequences for people’s lives. Ignoring these facts will only distract us from discovering and implementing wise policies.

Given everything that social scientists have learned about IQ and its broad predictive validity, it is reasonable to make it a factor in decisions such as whom to hire for a particular job or admit to a particular college or university. In fact, disregarding IQ—by admitting students to colleges or hiring people for jobs in which they are very likely to fail—is harmful both to individuals and to society. For example, in occupations where safety is paramount, employers could be incentivized to incorporate measures of cognitive ability into the recruitment process. Above all, the policies of public and private organizations should be based on evidence rather than ideology or wishful thinking.

As I say at the end of this post, “life just isn’t fair, so get over it.”

Governmental Perversity

People are sometimes by harmed natural events such as earthquakes, hurricanes, tornadoes, and floods. Though such events may be exogenous to human activity,they are somewhat predictable, in that people can know (or learn) where and (sometimes) approximately when such events are likely to occur. That knowledge, in turn, allows people to cope with natural events in three ways:

  • Move away from or avoid areas prone to natural disasters, at least during times of heightened risk.
  • Taking physical measures to reduce the damage caused by natural events.
  • Buying insurance to help defray the costs resulting a natural disaster.

Moral hazard enters the picture when government intervenes to encourage people to live in high-risk areas by insuring risks that private insurers will not insure (e.g., floods), by underwriting certain physical measures (e.g., the installation of bulkheads and pumping systems), and by reimbursing losses sustained by persons who insist on living in high-risk areas — as if to do so were a God-given right. Through such actions, government encourages unremunerative risk-taking, and transfers most of the resulting losses to those citizens who choose not to put themselves in harm’s way.

Now, egregious as it is, the moral hazard created by government with respect to natural disasters is nothing compared with the moral hazard created by government with respect to financial disasters. The recent financial crisis-cum-deep recession is but the latest in a long string of government-caused and government-aided economic messes.

In the recent case, the Federal Reserve and pseudo-private arms of the federal government (Freddie Mac and Fannie Mae) loosened the money supply and encouraged lenders to grant loans to marginal borrowers. Financial institutions were further encouraged to take undue risks by having seen, in times past, that there were bailouts at the end of the tunnel. Not all troubled firms were bailed out during the recent financial crisis, but enough of them were to ensure that the hope of being bailed out still shines brightly. Nor were bailouts limited to financial institutions; troubled companies like General Motors, which should have been put out of their misery, were given new life, at a high cost to taxpayers.

And so, thanks to government, people and businesses continue to take undue risks at the expense of their fellow citizens. Meanwhile — through taxes and regulations — government continues to discourage privately financed risk-taking (entrepreneurship) that is essential to economic growth.

Perversity, thy name is government.

*     *     *

Related posts:
The Stagnation Thesis
Taxing the Rich
More about Taxing the Rich
Money, Credit, and Economic Fluctuations
A Keynesian Fantasy Land
The Keynesian Fallacy and Regime Uncertainty
Regime Uncertainty and the Great Recession
Regulation as Wishful Thinking
In Defense of the 1%
Lay My (Regulatory) Burden Down
Economic Growth Since World War II
The Capitalist Paradox Meets the Interest-Group Paradox
Government in Macroeconomic Perspective
The 80-20 Rule, Illustrated
Economics: A Survey (also here)
Why Are Interest Rates So Low?
Vulgar Keynesianism and Capitalism
Estimating the Rahn Curve: Or, How Government Spending Inhibits Economic Growth
America’s Financial Crisis Is Now
Progressive Taxation Is Alive and Well in the U.S. of A.
Some Inconvenient Facts about Income Inequality
Mass (Economic) Hysteria: Income Inequality and Related Themes
The Criminality and Psychopathy of Statism

Mass (Economic) Hysteria: Income Inequality and Related Themes

It seems as though everyone’s talking and writing about stagnant wages, growing income inequality, gender discrimination in pay, concentration of wealth, no/less/too-little upward mobility, shrinking middle class, foreclosure of opportunity, end of the American Dream, higher mortality rates (due to income inequality), and on and on and on. (Insert exclamation marks to heighten the sense of outrage.)

All of these complaints — which emanate from the left and resound loudly in the media — presuppose the existence of several Platonic ideals; for example: correct wage levels, correct degrees of income and wealth inequality, correct rates of upward (and downward) mobility, an actually identifiable and permanent middle class, a measurable and optimum amount of opportunity, a definition of the American Dream that is more than pablum, and on and on.

All such ideals, of course, exist only in the minds of those who complain about stagnant wages, etc. But no matter — any excuse for further government intervention in the economy will do. And further government intervention will only harm those persons whom it is meant to help, by further reducing the rate of economic growth.

But nothing daunts true believers — Paul Krugman, Brad DeLong, Joseph Stiglitz, and their ilk — who always want government to “do something.” Their preachings bolster the pro-government-spending biases of most pundits and a large fraction of politicians. One aim of the true believers is to shape the fickle mood of the general public and garner support for government action.

Anyway, the various manifestations of economic hysteria listed in the opening paragraph can be met with logic and facts — and often are. (See the list of readings at the bottom of this post.) It’s unlikely that logic and facts will sway those who are emotionally committed to the exaction of redistributive justice, and who have no interest in its infeasibility, high costs, and perverse consequences. But until that lucky day when legitimate government is restored to the United States, its defenders must rely on logic and facts.

Consider income inequality. Not only is there inequality — which should be unsurprising, given inequality of ability, ambition, etc. — but there is supposedly a growing gap between America’s “haves” and “have-nots.” A do-gooder would leave it at that. Not being one of them, I’ll ask the questions that they’re unwilling/afraid/too-jejune to ask:

  1. What is a have? Is it someone/a household whose income exceeds the median for all persons/households? Is in the top 20 percent of all such incomes? The top 5 percent? The top 1 percent? The top 0.1 percent? (Pick your favorite point along the continuous curves in the graphs here.)
  2. Or is a have defined by his/her/its wealth? And, if so, how? (See preceding bullet.)
  3. Do haves “rig the game” so that they are, in effect, stealing from have-nots?
  4. If haves are clever and determined enough to do that, isn’t it likely that they’d still be haves without “rigging the game”?
  5. Is one’s economic status a permanent thing, or do people in fact move up and down the economic ladder during their lifetimes?
  6. Are the have-nots of today — who, mostly, aren’t the have-nots of yesteryear — really worse off than their predecessors, or are they really better off?
  7. Are they worse off relatively?
  8. Will tomorrow’s have-nots be better off if the haves are deprived of income/wealth through redistributive actions taken by government?
  9. Or will redistributive actions simply make haves worse off and less likely to do the things that make have-nots better off (e.g., give huge sums to charity, invest in growth-producing investments)?

Questions 1 and 2 are unanswerable; the distinction between a have and a have-not is purely arbitrary. (It has been said, with some accuracy, that a rich person is someone who has more more money than you.) The answers to the other questions are: (3) only to the extent that some of them are aided by government through perverse regulations favored by do-gooders; (4) yes; (5) not permanent, plenty of movement; (6) better-off absolutely than earlier have-nots; (7) probably about the same, relatively, but they’re mostly different people; (8) worse off; (9) yes, redistributive actions make have-nots worse off by hindering economic growth. (For more, see the list of readings, below.)

Before signing off, I want to say a bit more about haves, have-nots, rigging the game, and hypocritical politicians:

Most of the haves — given their ambition, intelligence, and particular skillswould succeed famously, even without rigging the game in their favor. In any event, government does most of the rigging — mainly to “protect” the have-nots from “ruthless” operators. For example, there’s licensing and regulatory barriers to entry to high-paying professions, such as the creation and trading of financial instruments, doctoring, lawyering, and making licensed, patented drugs. The entire left-leaning entertainment industry thrives on government-granted copyrights

In free markets, there would be no rigging, or it wouldn’t last long because the high profits generated by rigging would entice competition. So, if you want to blame rigging for the advantages enjoyed by the haves, blame their cronies in government, many of whom make a career of crying (all the way to the bank) about inequality. (Relevant aside: It is no coincidence that in 2012, five of the top-six counties in median household income were in the D.C. area.)

Isn’t is strange that most of the pissing and moaning about inequality emanates from people who are either in high-income brackets or whose political rank enables them to live as if they were? (Obama, Biden, and members of Congress, I’m looking at you.) Isn’t it evident that the pissing and moaning results mainly from economic illiteracy, guilt, and political opportunism? It should be evident, unless you’re a complete naïf of the kind who still believes in the tooth fairy and free lunches.

I must add that I have yet to meet a pro-equality “liberal” who pays more taxes than demanded of him by the IRS, opens his house to the homeless, or associates with the unwashed masses. As Victor Davis Hanson observes, there are no (true) socialists among the powerful and affluent lefties who spout egalitarian slogans.

I’ve addressed income inequality and related matters in several posts, including “The Last(?) Word about Income Inequality,” “Taxing the Rich,” “More about Taxing the Rich,” “In Defense of the 1%,” and “Progressive Taxation Is Alive and Well in the U.S. of A,” “How High Should Taxes Be?,” and “Some Inconvenient Facts about Income Inequality.” (See also the links embedded in and appended to those posts.)

There’s much more on the web. The following is a small sample of the vast trove of reasoned, fact-filled writings that leftists ignore because they prefer myths to facts.

Income inequality, wealth inequality, and economic mobility
Diana Furchtgott-Roth, “The Myth of Increasing Income Inequality,” The Manhattan Institute, Issues 2012, March 2012
James Pethokoukis, “Obama’s Fact-Challenged Inequality Speech,” AEIdeas, July 26, 2013
James Pethokoukis, “3 Charts That Show What’s Really Going On with Economic Mobility in the U.S.,” AEIdeas, December 12, 2013
James Pethokoukis, “If All You Know about Income Inequality Is This Famous Chart, You Really Don’t Know Much,” AEIdeas, December 23, 2013
Don Boudreaux, “Questions about and for Those People Obsessed with Income Inequality,” Cafe Hayek, December 24, 2013
Raj Chetty, et al., “Is the United States Still a Land of Opportunity? Recent Trends in Intergenerational Mobility,” Working Paper 19844, National Bureau of Economic Research, January 2014 (related: N. Gregory Mankiw, “How Much Income Inequality Is Explained by Varying Parental Resources?,” Greg Mankiw’s Blog, January 24, 2014)
John Goodman, “Myths about Inequality,” John Goodman’s Health Policy Blog, January 15, 2014
Thomas Sowell, “Fact-Free Liberals (parts I, II, and III),” creators.com, January 21, 2014
James Pethokoukis, “Does Obama Know That Wealth Inequality Is Lower Now Than 25 Years Ago?,” AEIdeas, January 21, 2014
Ironman, “Debunking Income Inequality Theory,” Political Calculations, January 23, 2014
David Harsanyi, “State of the Union: Maybe You’re Not As Screwed As They Think You Are,” The Federalist, January 27, 2014
David Henderson, “Why Income Mobility Is Larger in the Middle,” EconLog, February 10, 2014
Linda Gorman, “More Accurate Measures Suggest Declining Income Inequality [not that it matters, one way or the other],” John Goodman’s Health Policy Blog, March 14, 2014
Mark R. Rank, “From Rags to Riches to Rags,” The New York Times, April 18, 2014

Executive pay, the “undeserving” rich, and the “1%”
James Pethokoukis, “Stunning New Study Dismantles Obama’s ‘1% vs. 99%’ Inequality Argument,” AEIdeas, August 16, 2013
James Pethokoukis, “Why Steven Kaplan Says Brad DeLong Is Wrong about CEO Pay, the Superstar Theory, and Income Inequality,” AEIdeas, August 19, 2013
James Pethokoukis, “Why the Much-Hyped Oxfam Study on Global Inequality Is Misleading,” AEIdeas, January 21, 2014
Don Boudreaux, “Deidre McClosky on Oxfam’s Calculation of World Wealth ‘Distribution’,” Cafe Hayek, January 27, 2014
Walter E. Williams, “Politics of Hate and Envy,” creators.com, January 29, 2014
Robert J. Samuelson, “Myth-Making about Economic Inequality,” RealClearPolitics, February 3, 2014
N. Gregory Mankiw, “Yes, the Wealthy Can Be Deserving,” The New York Times, February 15, 2014
N. Gregory Mankiw, “CEO’s Are Paid for Performance,” Greg Mankiw’s Blog, February 17, 2014
Mark J. Perry, “‘Rich America Is Not the ‘Idle Rich’, but rather a Working America, an Educated America, and a Married America,” Carpe Diem, February 19, 2014

Rigging the system: “our” government at work
Bruce Yandle, “Bootleggers and Baptists,” Regulation, May/June 1983
Bruce Yandle “Bootleggers and Baptists in Retrospect,” Regulation, Fall 1999
Richard K. Vedder, “Federal Government Has Declared War on Work,” Commentary Articles, The Independent Institute, January 20, 2014

The effect of assortative mating on household income
Henry Harpending, “Class, Caste, and Genes,” West Hunter, January 13, 2012
Henry Harpending and Gregory Cochran, “Assortative Mating, Class, and Caste,” manuscript, December 1, 2013
Jeremy Greenwood et al., “Marry Your Like: Assortative Mating and Income Inequality,” Population Studies Center, University of Pennsylvania, January 12, 2014
Ironman, “In Which We’re Vindicated. Again.,” Political Calculations, January 28, 2014

The non-war on the middle class, women, and blacks
Mark J. Perry, “Yes, the Middle Class Has Been Disappearing, but They Haven’t Fallen into the Lower Class, They’ve Risen into the Upper Class,” Carpe Diem, July 12, 2013
Steve Sailer, “Breakthrough Study: Poor Blacks Tend to Stay Poor, Black,” Vdare.com, July 24, 2013
John B. Taylor, “The Weak Recovery Explains Rising Inequality, Not Vice Versa,” WSJ.com, September 9, 2013
John B. Taylor, “My Take on the Middle-Out View,” Economics One, September 9, 2013
James Bessen, “No, Technology Isn’t Going to Destroy the Middle Class,” The Washington Post, October 21, 2013
Bryan Caplan, “Is Average Over? Two Equivocal Graphs,” EconLog, January 4, 2014
N. Gregory Mankiw, “Does Income Inequality Increase Mortality?,” Greg Mankiw’s Blog, January 29, 2014
Christina Hoff Sommers, “No, Women Don’t Make Less Money Than Men,” The Daily Beast, February 1, 2014

Modern Liberalism as Wishful Thinking

TheFreedictionary.com defines wishful thinking as “the erroneous belief that one’s wishes are in accordance with reality.” There’s a lot of wishful thinking going on, and it’s harmful to liberty and prosperity. I’m referring to the wishful thinking that characterizes modern liberalism, which is more properly called left-statism verging on despotism.

The dysfunctional manifestations of left-statism are too many to enumerate, let alone to detail in a single post. Obamacare is merely a current dysfunctional manifestation. It has many predecessors and will have many successors, unless constitutional government can somehow be restored in the United States. Some of the manifestations take the form of laws, executive decrees, and judicial holdings. Others reflect “big ideas” that give rise to illogical and ill-founded laws, decrees, and holdings.

Without further ado …

REGULATION WORKS

I wrote an entire post about “Regulation as Wishful Thinking.” The underlying theme is that regulators (and those who support regulation) believe that they can fine-tune economic and social behavior to achieve optimal (or at least better) outcomes than the one produced by free markets. If one paragraph sums up the effects of regulation, it’s this one:

Regulation is counterproductive for several reasons. First, it curtails positive externalities [the satisfaction of consumers’ wants that is forgone due to regulatory restraints on market activity]…. The other reasons, on which I expand below, are that regulation cannot be contained to “good causes,” nor can it be tailored to do good without doing harm. These objections might be dismissed as trivial if regulatory overkill were rare and relatively costless, but it is pervasive, extremely costly its own right, and a major contributor to the economic devastation that has been wrought by the regulatory-welfare state.

Read the whole thing for the details of the argument and the evidence of the devastation. For a jarring example, see John Goodman, “FDA Regulations Kill,” John Goodman’s Health Policy Blog, February 18, 2014.

Wish: Regulation improves social and economic outcomes.

Reality: Regulation restricts the ability of people to pursue their lawful interests, and thereby harms them socially and economically.

Bottom line: Regulation is harmful, because it substitutes the judgments of “technocrats” for the decentralized knowledge of millions of citizens. Its economic cost is more than 10 percent of GDP — and it leads to unnecessary loss of life.
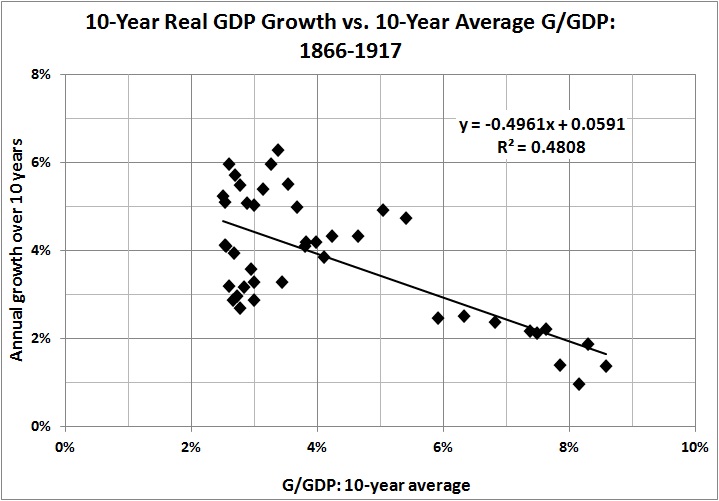
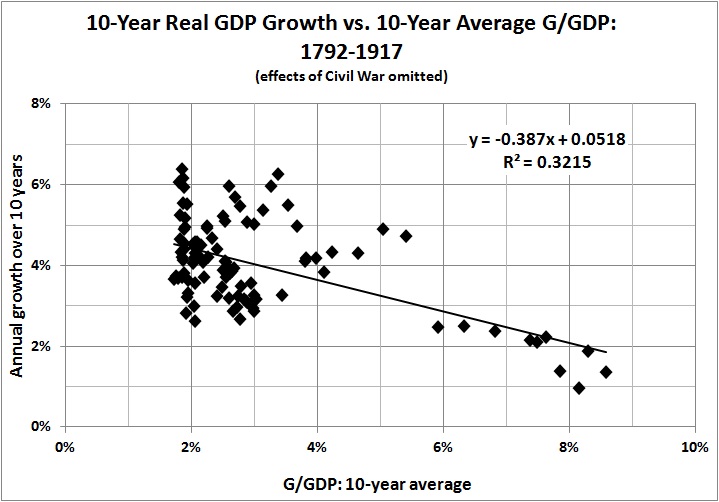
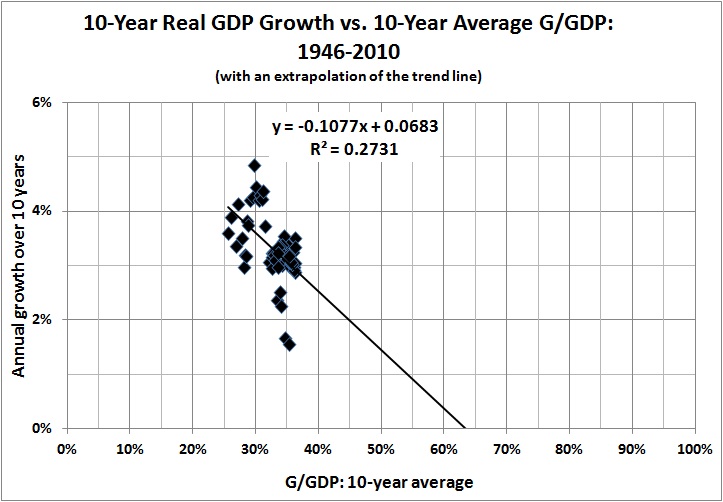
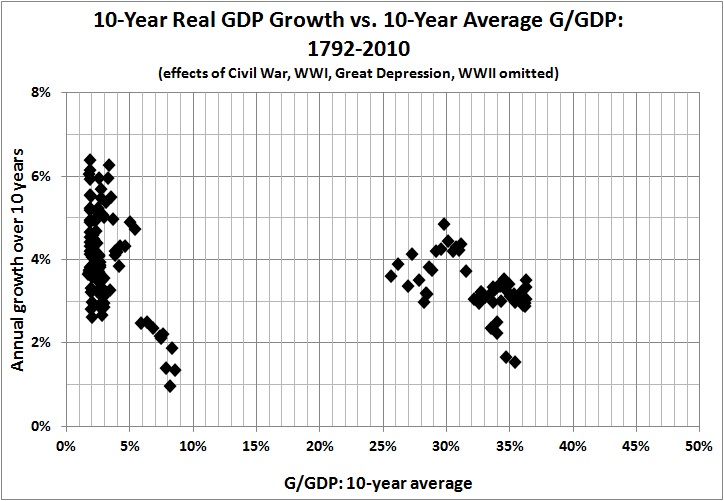
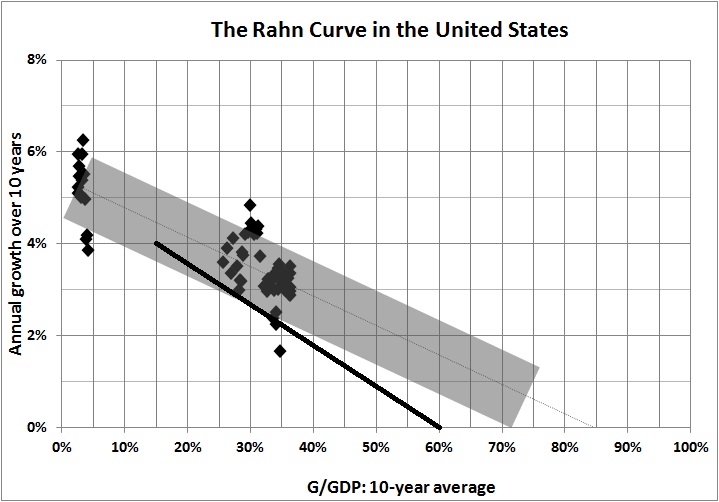
TAXES ARE GOOD

Consider the intuitive and also well-documented relationship between taxes and economic activity. See, for example, Christina D. and David H. Romer, “The Macroeconomic Effects of Tax Changes: Estimates Based on a New Measure of Fiscal Shocks,”  Working Paper 13264, National Bureau of Economic Research, July 2007; and William McBride, “What Is the Evidence on Taxes and Growth?,” Tax Foundation, December 18, 2012. One must bend over backward to concoct a theory which says that a rise in taxes will not reduce the rate of economic output or the growth of that rate. But such theories are propounded because their proponents favor higher taxes for two closely related reasons: more taxes enable more government spending, and more government spending usually means “social” spending. (One reason that “liberals” are against defense spending — or more of it — is that it absorbs money that could go into “social” programs.)

Wish: Higher taxes don’t reduce GDP or the rate of economic growth.

Reality: Higher taxes do reduce GDP and the rate of economic growth.

Bottom line: Higher taxes (and more government) actually harm the poor (among others) by reducing economic activity and, thereby, reducing employment. As it turns out, the effect is substantial.

THE MINIMUM WAGE HELPS LOW-SKILL WORKERS

There are economists who support the minimum wage, not necessarily because of the economic soundness of the minimum wage, but because they just like the idea that (some) low-wage workers will make more because of it. Some of those economists have even produced studies which purport to show that a minimum wage has a “small” effect on the employment of low-wage workers. As if “small” were of no consequence to those who are unable to find and keep low-wage jobs because of the minimum wage. Well, the minimum wage — and its more overtly political twin, the “living wage” — do harm low-wage workers. And that’s that. See Linda Gorman, “Minimum Wages,” The Concise Encyclopedia of Economics at The Library of Economics and Liberty. For the latest, see James Pethokoukis, “CBO: The $10.10 Minimum Wage Would Cost 500,000 Jobs, With Most Benefits Going to Non-Poor,” AEIdeas, February 18, 2014.

Wish: Government can help low-skill workers by forcing employers to pay them more.

Reality: Minimum wages and “living wages” result in less employment among low-wage workers.

Bottom line: Those who are in most need of employment, and for whom the private sector would provide employment (other things being the same), are deprived of employment by well-meaning but economically wrong-headed minimum-wage and “living wage” laws.

CAPITAL PUNISHMENT DOESN’T DETER MURDER

What about capital punishment? A paper from 1973, just a year after the U.S. Supreme Court’s decision in Furman v. Georgia effectively outlawed capital punishment, offers an exhaustive statistical analysis of the deterrent effect of capital punishment. See Isaac Ehrlich, “The Deterrent Effect of Capital Punishment: A Question of Life and Death,” Working Paper No. 18, Center for Economic Analysis of Human Institutions, National Bureau of Economic Analysis, November 1973. The author’s conclusion:

[A]n additional execution per year over the period in question [1933-1969] may have resulted, on average, in 7 or 8 fewer murders.

Later:

Previous investigations … have developed evidence used to unequivocally deny the existence of any deterrent or preventive effects of capital punishment. This evidence stems by and large from what amounts to informal tests of the sign of the simple correlation between the legal status of the death penalty and the murder rate across states and over time in a few states. Studies performing these tests have not considered systematically the actual enforcement of the death penalty, which may be a far more important factor affecting offenders’ behavior than the legal status of the penalty. Moreover, these studies have generally ignored other parameters characterizing law enforcement activity against murder, such as the probabilities o± apprehension and conviction, which appear to be systematically related to the probability of punishment by execution.

In my words:

Capital punishment is the capstone of a system of justice that used to work quite well in this country because it was certain and harsh. There must be a hierarchy of certain penalties for crime, and that hierarchy must culminate in the ultimate penalty if criminals and potential criminals are to believe that crime will be punished.

Since the reinstatement of the death penalty in 1976 (Gregg v. Georgia), with restrictions, capital punishment has become less swift and less sure than it had been. There were 1,359 executions in 1976-2013, an average of 36 a year, as against 4,863 in 1930-1972, an average of 113 a year. That is, the rate of executions has dropped by two-thirds from its pre-Furman rate. The drop in the execution rate notwithstanding, the deterrent effect of capital punishment remained strong, at least through 2000. See Hashem Dezhbaksh, Paul Robin, and Joanna Shepherd, “Does capital punishment have a deterrent effect? New evidence from post-moratorium panel data,” American Law and Economics Review 5(2): 344–376 (available in pdf format here. The authors argue that each execution deters eighteen murders, a number that reflects the larger population of the U.S. during the period covered by their analysis. It’s hard to read the two papers cited here and believe that capital punishment doesn’t deter homicide — unless you want to believe it.

Altogether, the more “humane” treatment of murderers since 1976 has cost 600 to 1,400 lives every year, or 23,000 to 53,000 lives in the past 38 years.

Wish: Capital-punishment is nothing more than murder by the state, and (non sequitur) it doesn’t deter murder, anyway.

Reality: Capital punishment is punishment, and when it is administered surely and swiftly it does deter murder.

Bottom line: Perhaps more than 50,000 murders would have been prevented if the rate of executions hadn’t been slowed drastically following the 1972-1976 moratorium on capital punishment.

MORE GUNS MEAN MORE CRIME

There’s a twisted consistency between opposition to capital punishment and support of stringent measures to control the availability of firearms. Both positions tip the scales in favor of predators and away from peaceful citizens.

To favor gun control is to engage in wishful thinking at its best (or worst). Why? Because to favor gun control is to favor the criminal over the law-abiding citizen. But according to wishful thinkers, stringent gun control would lead to a reduction violent crimes. As with the other kinds of wishful thinking addressed here, it just ain’t so.

John Lott‘s More Guns, Less Crime is the elephant in the room, and can’t be ignored. In that book, the article on which it’s based, and other books, Lott argues that allowing adults to own or carry guns leads to a significant reduction in crime. Lott’s work was controversial — some called it incendiary. Not surprisingly, many academics opened fire on it, picking and poking at Lott’s data and methods. I say not surprisingly because — in case it has escaped your attention — academics tend to be (wishful-thinking) leftists.

To save time and space, I fast-forward to a paper by Don B. Kates and Gary Mauser, “Would Banning Firearms Reduce Murder and Suicide?,” first published in Harvard’s Journal of Public Law and Policy (Vol. 30, No. 2, 2007, pp. 649-694). Here are some relevant excerpts:

There are now 40 states where qualified citizens can obtain such a handgun permit.28 As a result, the number of U.S. citizens allowed to carry concealed handguns in shopping malls, on the street, and in their cars has grown to 3.5 million men and women.29 Economists John Lott and David Mustard have suggested that these new laws contributed to the drop in homicide and violent crime rates. Based on 25 years of correlated statistics from all of the more than 3,000 American counties, Lott and Mustard conclude that adoption of these statutes has deterred criminals from confrontation crime and caused murder and violent crime to fall faster in states that adopted this policy than in states that did not.30 (op. cit., p. 658)

Footnote 30 reads, in relevant part:

This conclusion is vehemently rejected by antigun advocates and academics who oppose armed self‐defense. See, e.g., Albert W. Alschuler, Two Guns, Four Guns, Six Guns, More Guns: Does Arming the Public Reduce Crime?, 31 VAL. U. L. REV. 365, 366 (1997); Ian Ayres & John J. Donohue III, Shooting Down the ‘More Guns, Less Crime’ Hypothesis, 55 STAN. L. REV. 1193, 1197 (2003); Dan A. Black & Daniel S. Nagin, Do Right‐to‐Carry Laws Deter Violent Crime?, 27 J. LEGAL STUD. 209, 209 (1998); Franklin Zimring & Gordon Hawkins, Concealed Handguns: The Counterfeit Deterrent, RESPONSIVE COMMUNITY, Spring 1997, at 46; Daniel W. Webster, The Claims That Right‐to‐Carry Laws Reduce Violent Crime Are Unsubstantiated (Johns Hopkins Center for Gun Policy and Research, 1997). Several critics have now replicated Lott’s work using additional or different data, additional control variables, or new or different statistical techniques they deem superior to those Lott used. Interestingly, the replications all confirm Lott’s general conclusions; some even find that Lott underestimated the crime‐reductive effects of allowing good citizens to carry concealed guns. See Jeffrey A. Miron, Violence, Guns, and Drugs: A Cross‐Country Analysis, 44 J.L. & ECON. 615 (2001); David B. Mustard, The Impact of Gun Laws on Police Deaths, 44 J.L. & ECON. 635 (2001); John R. Lott, Jr. & John E. Whitley, Safe‐Storage Gun Laws: Accidental Deaths, Suicides, and Crime, 44 J.L. & ECON. 659 (2001); Thomas B. Marvell, The Impact of Banning Juvenile Gun Possession, 44 J.L. & ECON. 691 (2001); Jeffrey S. Parker, Guns, Crime, and Academics: Some Reflections on the Gun Control Debate, 44 J.L. & ECON. 715 (2001); Bruce L. Benson & Brent D. Mast, Privately Produced General Deterrence, 44 J.L. & ECON. 725 (2001); David E. Olson & Michael D. Maltz, Right‐to‐Carry Concealed Weapon Laws and Homicide in Large U.S. Counties: The Effect on Weapon Types, Victim Characteristics, and Victim‐Offender Relationships, 44 J.L. & ECON. 747 (2001); Florenz Plassmann & T. Nicolaus Tideman, Does the Right to Carry Concealed Handguns Deter Countable Crimes? Only a Count Analysis Can Say, 44 J.L. & ECON. 771 (2001); Carlisle E. Moody, Testing for the Effects of Concealed Weapons Laws: Specification Errors and Robustness, 44 J.L. & ECON. 799 (2001); see also Florenz Plassman & John Whitley, Confirming ‘More Guns, Less Crime,’ 55 STAN. L. REV. 1313, 1316 (2003). In 2003, Lott reiterated and extended his findings, which were subsequently endorsed by three Nobel laureates. See JOHN R. LOTT, JR., THE BIAS AGAINST GUNS (2003). (op. cit., pp. 658-9, emphasis added)

There are so many gems in the article that it is hard to stop quoting it. I should say “read the whole thing,” but I’ll succumb to temptation and quote a few choice passages here, and many more in the note at the bottom of this post (footnote numbers omitted for ease of reading):

[A study by Hans Toch and Alan J. Lizotte shows that] “data on firearms ownership by constabulary area in England,” like data from the United States, show “a negative correlation,” that is, “where firearms are most dense violent crime rates are lowest, and where guns are least dense violent crime rates are highest.” (p. 653)

A second misconception about the relationship between firearms and violence attributes Europe’s generally low homicide rates to stringent gun control. That attribution cannot be accurate since murder in Europe was at an all‐time low before the gun controls were introduced. (p. 653-4)

[T]wo recent studies are pertinent. In 2004, the U.S. National Academy of Sciences released its evaluation from a review of 253 journal articles, 99 books, 43 government publications, and some original empirical research. It failed to identify any gun control that had reduced violent crime, suicide, or gun accidents. The same conclusion was reached in 2003 by the U.S. Centers for Disease Control’s review of then extant studies. (p. 654)

In the late 1990s, England moved from stringent controls to a complete ban of all handguns and many types of long guns. Hundreds of thousands of guns were confiscated from those owners law‐abiding enough to turn them in to authorities. Without suggesting this caused violence, the ban’s ineffectiveness was such that by the year 2000 violent crime had so increased that England and Wales had Europe’s highest violent crime rate, far surpassing even the United States. (p. 655)

[A]doption of state laws permitting millions of qualified citizens to carry guns has not resulted in more murder or violent crime in these states. Rather, adoption of these statutes has been followed by very significant reductions in murder and violence in these states. (p. 659)

[T]he determinants of murder and suicide are basic social, economic, and cultural factors, not the prevalence of some form of deadly mechanism. In this connection, recall that the American jurisdictions which have the highest violent crime rates are precisely those with the most stringent gun controls. (p. 663)

More than 100 million handguns are owned in the United States84 primarily for self‐defense, and 3.5 million people have permits to carry concealed handguns for protection. Recent analysis reveals “a great deal of self‐defensive use of firearms” in the United States, “in fact, more defensive gun uses [by victims] than crimes committed with firearms.” It is little wonder that the

National Institute of Justice surveys among prison inmates find that large percentages report that their fear that a victim might be armed deterred them from confrontation crimes. “[T]he felons most frightened ‘about confronting an armed victim’ were those from states with the greatest relative number of privately owned firearms.” Conversely, robbery
is highest in states that most restrict gun ownership.

Concomitantly, a series of studies by John Lott and his coauthor David Mustard conclude that the issuance of millions of permits to carry concealed handguns is associated with drastic declines in American homicide rates. (p. 671)

Per capita, African‐American murder rates are much higher than the murder rate for whites. If more guns equal more death, and fewer guns equal less, one might assume gun ownership is higher among African‐ Americans than among whites, but in fact African‐ American gun ownership is markedly lower than white gun ownership. (p. 676)

The reason fewer guns among ordinary African‐Americans does not lead to fewer murders is because that paucity does not translate to fewer guns for the aberrant minority who do murder. The correlation of very high murder rates with low gun ownership in African‐American communities simply does not bear out the notion that disarming the populace as a whole will disarm and prevent murder by potential murderers. (p. 678)

In sum, the data for the decades since the end of World War II also fails to bear out the more guns equal more death mantra. The per capita accumulated stock of guns has increased, yet there has been no correspondingly consistent increase in either total violence or gun violence. The evidence is consistent with the hypothesis that gun possession levels have little impact on violence rates. (p. 685)

Wish: Gun-control (or confiscation) will reduce violent crime.

Reality: More guns, no more crime. Crime is a product of underlying social and economic factors that vary from nation to nation, region to region, and socio-economic group to socio-economic group.

Bottom line: The desire to limit or eliminate private ownership of firearms reflects a distaste for weapons and an irrational reaction to relatively rare but horrific instances of gun violence. But the effect of limiting or eliminating private ownership is to disarm law-abiding citizens and encourage crime against them.

THE LIST GOES ON …

If the list of leftist delusions isn’t infinite, it’s certainly very long. For example, there’s wishful thinking about peace, about gender discrimination, about racial equality, about crime, about income inequality, about society, about social welfare, and about the pseudo-scientific religion of global warming.

Why so many delusions? To those who believe — despite the evidence — that persons of the “liberal” (i.e., left-statist) persuasion are smarter or more rational than persons of the right, I commend my own best-selling post, “Intelligence, Personality, Politics, and Happiness,” and two articles by James Lindgren, “Who Fears Science?“and “Who Believes That Astrology Is Scientific?” (The answers may surprise you, though they shouldn’t, now that you’ve read this far.)

To wrap up this long post, I simply urge you to peruse some of my “Favorite Posts,” especially the posts under these headings:

It’s best to start with the newer posts at the bottom of each section, and work up to earlier ones, which often are referenced or incorporated in later posts.

__________
More quotations from “Would Banning Firearms Reduce Murder and Suicide?.”

Since at least 1965, the false assertion that the United States has the industrialized world’s highest murder rate has been an artifact of politically motivated Soviet minimization designed to hide the true homicide rates. Since well before that date, the Soviet Union possessed extremely stringent gun controls that were effectuated by a police state apparatus providing stringent enforcement. So successful was that regime that few Russian civilians now have firearms and very few murders involve them. Yet, manifest success in keeping its people disarmed did not prevent the Soviet Union from having far and away the highest murder rate in the developed world.6 (pp. 650-1)

Luxembourg, where handguns are totally banned and ownership of any kind of gun is minimal, had a murder rate nine times higher than Germany [with 30 guns per 100 persons] in 2002. (p. 652)

[D]espite constant and substantially increasing gun ownership, the United States saw progressive and dramatic reductions in criminal violence in the 1990s. On the other hand, the same time period in the United Kingdom saw a constant and dramatic increase in violent crime to which England’s response was ever‐more drastic gun control including, eventually, banning and confiscating all handguns and many types of long guns. Nevertheless, criminal violence rampantly increased so that by 2000 England surpassed the United States to become one of the developed world’s most violence‐ridden nations. (p. 656)

[V]iolent crime, and homicide in particular, has plummeted in the United States over the past 15 years. The fall in the American crime rate is even more impressive when compared with the rest of the world. In 18 of the 25 countries surveyed by the British Home Office, violent crime increased during the 1990s. This contrast should induce thoughtful people to wonder what happened in those nations, and to question policies based on the notion that introducing increasingly more restrictive firearm ownership laws reduces violent crime. (p. 660)

The “more guns equal more death” mantra seems plausible only when viewed through the rubric that murders mostly involve ordinary people who kill because they have access to a firearm when they get angry. If this were true, murder might well increase where people have ready access to firearms, but the available data provides no such correlation. Nations and areas with more guns per capita do not have higher murder rates than those with fewer guns per capita. (pp. 665-6)

[R]educing gun ownership by the law‐abiding citizenry— the only ones who obey gun laws—does not reduce violence or murder. The result is that high crime nations that ban guns to reduce crime end up having both high crime and stringent gun laws, while it appears that low crime nations that do not significantly restrict guns continue to have low violence rates. (p. 672)

A recent study of all counties in the United States has again demonstrated the lack of relationship between the prevalence of firearms and homicide. (p. 686)

Some Inconvenient Facts about Income Inequality

Follow these three links at Census.gov and you’ll find Table P-28, Educational Attainment—Workers 18 Years Old and Over by Mean Earnings, Age and Sex. (Similar tables are available, but the numbers reported in P-28 are based on a consistent definition of educational attainment.) Drawing on Table P-28, I constructed the following statistics for 1992 and 2012, which are years with similar rates of growth in GDP per capita (2.19 percent and 2.05 percent, respectively):

Employment earnings and 20-year changes in earnings

Men and women are separated because it’s a fact of life that — on average — they don’t earn the same incomes. This isn’t a matter of discrimination, but of differences in education (discipline as well as level of attainment), occupation, experience, and hours worked. (See, for example, “No, Women Don’t Make Less Money Than Men,” The Daily Beast, February 2, 2014.)

Tables 1, 2, 4, and 5 show something that should surprise no one: income rises with age (a proxy for experience) and level of education. This is a key fact that is never mentioned in the usual blather about income inequality. (There is, of course, a drop in real earnings among persons 65 and older, which reflects the fact that most persons in that age bracket have retired or shifted to part-time work.)

Tables 3 and 6 are especially interesting for what they reveal about changes in real income between 1992 and 2012 for cohorts at various levels of educational attainment. For example, the real earnings of men with a 9th grade education who were 18-24 years old in 1992 had risen by 94 percent 20 years later, when they were in the 35-44 age bracket.

Among the male cohorts under the age of 65 in 2012, only one (of  24) experienced a decline in real earnings. Male cohorts in the 35-54 age range show impressive rises in real income between 1992 and 2012. Among women, no cohort below age 65 experienced a drop in real income between 1992 and 2012; and most experienced a healthy increase.

Of course, some persons who worked full-time in 2012 earned less in that year than they did as full-time workers in 1992. But it’s evident that those 20 years were good for almost everyone. Otherwise, the numbers wouldn’t look as good as they do. In addition to the evidence of tables 3 and 6, consider this:  average real earnings rose by 24 percent between 1992 and 2012. (So much for wage stagnation.)

Tables 3 and 6 indicate that persons high levels of educational attainment have done better than persons at the low end of the educational ladder. That’s simply a fact of economic life, not the result of a conspiracy. It reflects the ever-increasing demand for highly technical goods and services — from nanosurgery to Google glass. In 2012, there were 1.7 million, 8.3 million, and 17.1 million persons in the top 1-, 5-, and 10-percent income brackets. Such large numbers are hardly the stuff of conspiracies.

What about the distribution of incomes? (Note to the uninitiated: Incomes aren’t “distributed,” they’re earned. “Distribution,” in this context, is shorthand for frequency distribution, a statistical term. Unfortunately, too many people interpret “distribution” as a reference to a mysterious and conspiratorial doling out of a big pie in the sky.) Taking into account the number of persons represented in each age-education group, I constructed these distributions for 1992 and 2012:

Mean income by percentile, 2012 vs 1992

The two curves have almost the same Gini coefficient: 0.239 for 1992, 0.242 for 2012. That is to say, the distribution of average incomes (taking men and women together) wasn’t any less equal in 2012 than it was in 1992.

The details for 2012 are in the next table. (Professional degrees include MD, JD, DDS, DVM, and similarly occupation-specific advanced degrees; doctorates include PhD and EdD.) The mean is $46,615; the median, $42,250.

Mean income by percentile, sex, education, age - 2012

And don’t forget, these numbers include part-timers as well as full-timers; college students as well as high-school dropouts; and a large contingent of under-educated (and probably not very bright) oldsters. These numbers don’t include the many sources of income and income-in-kind represented in the “social safety net”: unemployment compensation, disability benefits, survivors’ benefits, food stamps, Social Security, Medicare, Medicaid, and on and on.

Note to Obama and friends: Go peddle your phony stories about income inequality where they’ll be appreciated — Tsarist Russia, for example.

*     *      *

Related posts:
Why We Deserve What We Earn
Who Decides Who’s Deserving?
The Main Causes of Prosperity
Why Class Warfare Is Bad for Everyone
Fighting Myths with Facts
Debunking More Myths of Income Inequality
Ten Commandments of Economics
More Commandments of Economics
On Income Inequality
The Causes of Economic Growth
The Last(?) Word about Income Inequality
Status, Spite, Envy, and Income Redistribution
The Causes of Economic Growth
A Short Course in Economics
Addendum to a Short Course in Economics
The Price of Government
Does the Minimum Wage Increase Unemployment?
The Price of Government Redux
The Mega-Depression
The Real Burden of Government
Toward a Risk-Free Economy
Enough of “Social Welfare”
A True Flat Tax
Taxing the Rich
More about Taxing the Rich
In Defense of the 1%
Lay My (Regulatory) Burden Down
The Burden of Government
How High Should Taxes Be?
The 80-20 Rule, Illustrated
Economics: A Survey (also here)
Estimating the Rahn Curve: Or, How Government Spending Inhibits Economic Growth
Progressive Taxation Is Alive and Well in the U.S. of A.

Discounting in the Public Sector

This post is an adaptation of an article that I wrote 25 years ago. It appeared in the May-June 1989 issue of Program Manager, a magazine published in 1972-2003 by the Defense Systems Management College and its successor, the Defense Acquisition University. Several years before the article appeared, I had begun to question the soundness of the federal government’s official policy about discounting. which is stated in Circular A-94, issued by the Office of Management and Budget, Executive Office of the President.

The point of this post is to refute the case for discounting in benefit-cost or cost-effectiveness analyses of government projects. Part of my argument against discounting is made in “Discounting and ‘Libertarian Paternalism’.” This post makes a more complete case against the use of discounting in analyses of government projects.

DISCOUNTING: WHY AND WHY NOT

Discounting is a valid exercise in the evaluation of personal and business alternatives. A business, for example, will use discounting to compare alternative investments in new equipment; for example:

Implementation of project A will cost $1 million a year in years 1-5; project A will yield an annual net cash flow of $1 million in years 6-15.

Implementation of B will cost $1.5 million a year in years 1-4; B will yield $1.1 million a year in years 5-15.

Instead of undertaking either project, the firm could purchase equally risky bonds with a yield of 5 percent.

Should the firm undertake project A or project B? Discounting reveals the answer (though, for the sake of simplicity, I’m omitting risk, uncertainty, taxes, and inflation): The net present value of A, discounted at 5 percent, is $1.72 million; of B, $4.34 million. B is the preferred alternative, all other things being equal.

This result would seem backwards to a person who is used to thinking in terms of gross numbers, irrespective of the timing of outlays and returns. For example, A costs $5 million and returns $1 million a year (20 percent) when it’s up and running; whereas, B costs $6 million and returns $1.1 million a year (18.33 percent) when it’s up and running. Thus an analysis that omits timing would favor project A. But timing is important. Even though B costs more than A, B yields a greater return, and sooner (by a year). Over the relevant time span, the extra year and extra annual return of $0.1 million make B the more profitable alternative.

However, the result is sensitive to the selection of a discount rate and time horizon, both of which are judgment calls. A range of discount rates and time horizons would be chosen, to see if the preference for B is robust or weak. If A is judged less risky than B, it would be appropriate to apply a lower discount rate to A than to B. If A is likely to have a longer productive life than B (less likely to become obsolete, for example), the time horizon for A would be longer than for B.

Discounting makes sense in the private sector, despite the sensitivity of results to changes in assumptions about costs, returns, discount rate, and time horizon. For one thing, the discount rate — however uncertain — is relevant to the decision-maker; it represents the rate of return that the decision-maker could earn if he chose not to undertake project A or project B. It is his discount rate, not one chosen arbitrarily for him by someone else. For another thing, the returns (such as they turn out to be) belong to the decision-maker. When all is said and done, he (or the principal for whom he is acting) will choose a course of action that is meant to maximize his wealth or his profits. Accordingly, different decision-makers, in different circumstances, will use discount rates and time horizons appropriate to their circumstances. Discounting isn’t a one-size-fits-all procedure.

That said, it doesn’t make sense if to discount if you’re analyzing alternative projects for a government decision-maker. Why not?

1. Government is funded (ultimately) by taxes. Taxpayers have myriad discount rates. The use of a particular rate to represent a (fictional) “social” rate amounts to gross presumption.

2. Further, there’s usually a misalignment of costs and benefits. Those who bear the costs (taxpayers) aren’t likely to reap the benefits in proportion to the costs they bear. Discounting doesn’t apply when X bears the costs and Y reaps the benefits.

3. Given (1) and (2), the proponent of discounting will resort to the use of an internal rate of return (e.g., cost reductions generated by maintenance projects that can then be applied to investments in new weapon systems). The use of an internal rate of return turns out to be a horse-before-the cart proposition: the correct choice determines the discount rate; the discount rate doesn’t determine the correct choice.

Now, for the details.

THE FICTIONAL “SOCIAL” DISCOUNT RATE

The academic justification for discounting the costs of alternative government projects goes like this:

The appropriate rate of discount for public projects is one which measures the social opportunity cost. The decision to devote resources to investment in a public project means … that these resources will become unavailable for use by the private sector. And this transfer should be undertaken whenever a potential project available to the government offers social benefits greater than the loss sustained by removing these resources from the private sector. The social rate of discount, then, must be chosen in such a way that it leads to a positive number for the evaluated net benefits of a public project if and only if its gross benefits exceed its opportunity costs in the private sector. (William J. Baumol, “On the Social Rate of Discount,” American Economic Review, September 1968, pp. 789-90)

In mathematical notation:

[NPV(public benefits) > NPV(private costs)] → Undertake public project

In the next section I’ll address the almost-certain misalignment of benefits and costs.  Here, I’ll assume for the sake of argument that benefits flow only to those taxpayers who foot the bill for a public (i.e., government) project, and do so in perfect proportion to the taxes levied on each of them. Would that unlikely condition justify the public project?

Consider this example:

There is a two-person economy consisting of Adam and Eve.

If a public project is undertaken, both will be taxed the same amount and both will receive the same benefits.

Taxes are levied in year 1; benefits are received in year 2.

Adam’s discount rate is 5 percent; Eve’s discount rate is 10 percent. That is, Eve has a “high” time-preference, relative to Adam; she places more emphasis on the present, as against the future.

The public decision-maker uses a discount rate of 7.5 percent.

The dollar value of the benefits accruing to Adam and Eve can be estimated.

The net present value of the sum of those benefits exceeds the net present value of the sum of the costs borne by Adam and Eve.

Nevertheless, Eve is probably made worse off by the undertaking of the public project. Adam is probably made better off, but at Eve’s expense. Why? Let’s say that Adam and Eve each pay $100 in taxes in year 1, and that the public project breaks even (returns exactly 7.5 percent), so that each of them receives $107.50 worth of benefits in year 2. Adam, given his 5 percent discount rate, would have been made whole with benefits of $105 in year 2, so he gains $2.50. Eve, on the other hand, would have been made whole with benefits of $110 in year 2, so she loses $2.50.

All of that assumes, of course, that both Adam and Eve place any value on the benefits delivered by the public project, let alone the same value. How does the government decision-maker know what value Adam and Eve place on the benefits delivered by his project? He doesn’t; he’s just a presumptuous fellow who wants to spend Adam and Eve’s money to satisfy his own sense of how things should be.

THE MISALIGNMENT OF COSTS AND BENEFITS

Professor Baumol admits that “no optimal [social discount] rate exists” (op. cit., p. 798). Actually, no “social” discount rate exists, except in the minds of arrogant economists and government officials.

How does “society” benefit if Adam is made happy at Eve’s expense? It doesn’t, because there’s no such thing as a social-welfare function, that is, a collective degree of happiness (or unhappiness) in which Adam’s gain somehow cancels Eve’s loss.

It only gets worse in the usual case, where the benefits from a government program do not flow to taxpayers in proportion to the taxes that they pay. It would be a major miracle if benefits were somehow aligned perfectly or even passably well with tax payments, especially given progressive tax rates and deliberately regressive benefit payments (e.g., Social Security, Medicare, Medicaid, housing subsidies, food stamps).

With millions of taxpayers and non-taxpayers in the mix — each with his own discount rate, and each receiving benefits (or not) that are disproportionate to the taxes that he pays — how can anyone say with a straight face that any government project can be justified by applying a “social” discount rate to its benefits and costs?

THE IRRELEVANT INTERNAL RATE OF RETURN

Given the foregoing, insurmountable objections, the die-hard defender of public-sector discounting hops on his deus ex machina: the internal rate of return. One such die-hard is Richard Thaler (also a notorious paternalist and purported libertarian), who essayed his views in “Discounting and Fiscal Constraints: Why Discounting is Always Right” (Center for Naval Analyses, Professional Paper 257, August 1979).

In Thaler’s simplified version of reality, a government decision-maker (manager) faces a choice between two projects that would deliver equal effectiveness (benefits). Specifically, the manager must choose between project A, at a cost of $200 in year 1, and equally-effective project B, at a cost of $205 in year 2 (op. cit., pp. 1-2). Thaler continues:

A [government] manager . . . cannot earn bank interest on funds withheld for a year. . . .  However, there will generally exist other ways for the manager to “invest” funds which are available. Examples include cost-saving expenditures, conservation measures, and preventive maintenance. These kinds of expenditures, if they have positive rates of return, permit a manager to invest money just as if he were putting the money in a savings account.

. . . Suppose a thorough analysis of cost-saving alternatives reveals that [in year 2] a maintenance project will be required at a cost of $215. Call this project D. Alternatively the project can be done [in year 1] (at the same level of effectiveness) for only $200. Call this project C. All of the options are displayed in table 1.

Discounting in the public sector_table 1

(op. cit., pp. 3-4)

Thaler believes that his example clinches the argument for discounting because the choice of project B (an expenditure of $205 in year 2) enables the manager to undertake project C in year 1, and thereby to “save” $10 in year 2.

Thaler’s “proof” is deeply flawed, as discussed in “Discounting and ‘Libertarian Paternalism’.” I’ll focus here on the essential emptiness of Thaler’s argument:

1. Even granting the availability of cost-reduction measures, their payoffs will vary widely. Thaler conveniently conjures projects C and D, with costs of $200 and $215 in years 1 and 2, respectively. He could just have well conjured a project D with a cost of $205 in year 2 — throwing A + D into a tie with B + C — or a project D with a cost of $203 in year 2 — causing A + D to look better than B + C.

2. In other words, the “correct” discount rate depends on the options available to a specific manager of a specific government activity. Yet Thaler insists on the application of a uniform discount rate by all government managers (op. cit., p. 6). By Thaler’s own example, such a practice could lead a manager to choose the wrong option.

3. To put it another way, the analyst should consider the specific options that are available to a specific manager, by constructing packages of projects that would cost the about the same in every year. Having done so (and assuming away a great deal of uncertainty about the costs and benefits of the options), the manager can then choose the package that delivers the most bang for the buck — when the bang is needed, in his judgment. There is no need to apply a discount rate. The relevant (and idiosyncratic) “discount rate” is a product of the correct choice, not a determinant of it.

FINAL WORDS ABOUT THE FUTILITY OF DISCOUNTING FOR GOVERNMENT DECISION-MAKING

Even if there were such a thing as a “social” discount rate, and even if the costs and benefits of government programs were well aligned, discounting would be an inadvisable practice in analysis for government decision-making. If a decision is to depend on the application of a particular discount rate, there must be great certainty about the future costs and benefits of alternative courses of action. But there seldom is (see “Analysis for Government Decision-Making: Demi-Science, Hemi-Demi-Science, and Sophistry“). The practice of discounting simply fosters an illusion of certainty — a potentially dangerous illusion, in the case of national defense.

The Fall and Rise of American Empire

Most Americans don’t like the idea of empire. It smacks of power, which is comforting and enriching when you have it, though few like to admit it. In short, empire can be a good thing. Lawrence W. Reed opens “The Fall of the Republic” with this:

For nearly five centuries, Res Publica Romana—the Roman Republic—bestowed upon the world a previously unseen degree of respect for individual rights and the rule of law. When the republic expired, the world would not see those wondrous achievements again on a comparable scale for a thousand years.

Reed summarizes the decline and fall of Rome:

The Roman Republic died a death of a thousand cuts. Or, to borrow from another, well-known parable: The heat below the pot in which the proverbial frog was boiled started out as a mere flicker of a flame, then rose gradually until it was too late for the frog to escape. Indeed, for a brief time, he enjoyed a nice warm bath….

Writers from the first centuries B.C. and A.D. offered useful insights to the decline. Polybius predicted that politicians would pander to the masses, leading to the mob rule of an unrestrained democracy. The constitution, he surmised, could not survive when that happened. Sallust bemoaned the erosion of morals and character and the rise of personal power lust. Livy, Plutarch, and Cato expressed similar sentiments. To the moment of his assassination, Cicero defended the Republic against the assaults of the early dictators because he knew they would transform Rome into a tyrannical despotism.

Ultimately, the collapse of the political order of republican Rome has its origins in three developments that took root in the second century B.C., then blossomed by the end of the first. One was foreign adventure. The second was the welfare state. The third was a sacrifice of constitutional norms and the rule of law to the demands of the other two.

The American equivalent of the Roman Republic didn’t last nearly as long — only about a century, from the Spanish-American War of 1898 through 1991, which marked the end of the Cold War and victory in the Gulf War. The relative peace and prosperity of the next several years masked America’s underlying decline, which has since became evident in the military, political, and economic events of the 21st century.

The causes and symptoms of America’s decline bear a strong resemblance to the decline of Rome. Let’s start with foreign adventure. By the end of 1991, America’s influence in the world seemed assured, given collapse of the USSR and the easy victory over Iraq in response to Saddam Hussein’s grab of Kuwait. But those two events proved to be the American Empire’s last gasp.

The dust had barely settled on the Gulf War when Somalia joined the list of post-World War II military misadventures, namely, the Korean War, the Vietnam War, the lame response to the bombing of Marine barracks in Lebanon, and the jurisprudential reaction to the 1993 bombing of the World Trade Center. (Some would argue that America’s entry into World War I was also a misadventure because of the imperial origins and tragic aftermath of the peace, namely, the rise of totalitarianism. But, at least, World War I ended decisively and in a clear-cut victory for America’s side — a victory that wouldn’t have been possible without the intervention of American forces.) The seeming disinclination of American leaders to stay the course and to wreak vengeance was duly noted in Osama bin Laden’s 1996 fatwa against the United States. As if to endorse that view, the 1998 bombings of U.S. embassies in Africa were met with ineffectual missile strikes.

And then came 9/11, and in its wake the wars in Afghanistan and Iraq. Both were cast in the mold of Korea and Vietnam: not enough firepower, not enough willpower. Barack Obama’s subsequent foreign policy misadventures and general retreat from effective leadership have only cemented America’s place as a declining, feckless, no-longer-fearsome power. Whence Obama’s fecklessness? Some argue that it is evidence of a deliberate effort to debase the United States.

So much for military misadventures. Let us turn to the growth of the welfare state and the sacrifice of constitutional norms. These go hand-in-hand, and both began before America’s military misadventures after World War II.

Consider the judicial betrayal of the constitutional scheme of limited government, and of order and traditional morality. There is no way, in the course of a blog post, to assess the full scope of the betrayal, in which the U.S. Supreme Court was a willing co-conspirator. Some examples will have to do:

Home Building & Loan Association v. Blaisdell (1933) allowed governmental suspension of creditors’ remedies (i.e., foreclosure), thus undermining contractual relationships.

National Labor Relations Board v. Jones & Laughlin Steel Corporation (1937) validated the Wagner Act, which vastly expanded the ability of labor unions to extort employers, to restrict commerce, and to fatten the paychecks of union members at the expense of everyone else.

Helvering v. Davis (1937) found Social Security to be constitutional, despite the plain words of Article I, Section 8 (the enumerated powers of Congress).

Wickard v. Filburn (1942) gave Congress unlimited power to regulate anything remotely connected with interstate commerce.

Miranda v. Arizona (1966) stigmatized and hindered the efforts of police to protect the public. On the basis of “intuitive empiricism” (i.e., judicial guesswork), Miranda imposed an overly broad interpretation of the Fifth Amendment. (A subsequent empirical analysis suggests that Miranda was unwisely decided.)

Griggs v. Duke Power Company (1971) enshrined disparate impact as evidence of racial discrimination, and put the burden of proof on the accused employer.

Lemon v. Kurtzman (1971) gave judges an easy way (the “Lemon test”) to rule against any government action that might incidentally benefit religion.

Roe v. Wade (1973) authorized murder in the name of privacy.

Goss v. Lopez (1975) made it more difficult for school authorities to discipline disruptive and destructive behavior, and (in my view) established — beyond hope of reversal — the interference of the central government in matters that ought to be handled and disposed of locally.

Coker v. Georgia (1977) outlawed the death penalty in cases of rape, thus contributing to the erosion of the death penalty as a serious deterrent to the commission of heinous crimes and a just penalty for same.

Tennessee Valley authority v. Hill (1978) gave the snail darter — and as a result, all kinds of critters — precedence over human beings, under the Endangered Species Act.

Chevron U.S.A., Inc. v. Natural Resources Defense Council, Inc. (1984) vastly increased the power of regulatory agencies by decreeing “deference” toward rules made in the absence of specific congressional authorization, as long as the rules are “reasonable.”

Garcia v. San Antonio Metropolitan Transit Authority (1985) confirmed the hollowness of the Tenth Amendment and the States’ ability to exercise any power without the permission of the central government.

Kelo v. City of New London (2005) affirmed the right of any government in the United States to seize anyone’s property, at any time, for any use — even non-governmental.

National Federation of Independent Business v. Sebelius (2012) granted the federal government power to tax anyone for any purpose, even for not doing something.

Hollingsworth v. Perry (2013) left standing a federal district court judge’s self-serving declaration that California’s duly adopted ban on same-sex “marriage” was unconstitutional, thus opening the door to similar holdings by other federal judges about other States’ duly adopted bans on same-sex “marriage.”

The judiciary didn’t instigate the vast expansion of the regulatory-welfare state and the overthrow of social norms, but the judiciary abetted them.

What does the regulatory-welfare state amount to? Huge federal welfare schemes, including but not limited to Social Security, Medicare, and Medicaid; the addition of nine cabinet-level departments to the executive branch in the preceding 100 years; the creation of the cabinet-level Environmental Protection Agency (EPA); the delegation of legislative power to the EPA and other federal agencies, and ensuing accretion of rules made and enforced by those agencies; and the pervasive centralization of power in Washington, “thanks” to judicial misfeasance of the kinds listed above, and to political sleight-of-hand (e.g., “cooperative” federal-State programs like Medicare, and grants of “federal” money — i.e., taxpayers’ money — to State and local governments).

As for constitutional norms, the courts of the United States have become perversely “libertarian.” They seem driven to overturn long-standing, time-tested behavioral norms that guide individuals toward peaceful, constructive coexistence with their compatriots. Thus the “right” to an abortion in the first trimester, based on a non-existent general right of privacy, has become the right to kill a nearly born and newly born child. The “right” to practice sodomy has become an obligation to purvey goods and services to those who practice sodomy, regardless of one’s personal views about the practice. The “right” of a male student of confused gender to use the girl’s bathroom in a Maine school threatens to evolve into the “right” to walk into any damn bathroom at any time, regardless of one’s actual gender. And on and on, down the slippery slope and into unreason, barbarity, and oppression.

Where stands the Empire today? Clearly, America has less influence in the world than it had just after World War II and even after the Gulf War. What a joke it is when the American president must be rescued from the consequences of his own (possibly deliberate) haplessness by Russia’s leader, when Iran plays rope-a-dope with Obama in the matter of nuclear weapons, and when China flexes its new-found and growing military muscle without drawing a serious response from the U.S.

American power abroad could be restored in fairly short order, given the will to do so. But the hollowing out of America’s liberty and prosperity — which began in earnest with the New Deal — threatens to be permanent, given the decades-long transformation of the nation’s legal and bureaucratic infrastructure. Government — mainly the central government — now exerts financial control over 40 percent of the economy (here, see first graph), and arguably exerts regulatory control over almost all of it.

That control has long since passed from the elected “representatives” of the people to technocrats who are bent on dictating how Americans’ conduct their lives and earn their livelihoods. Thus:

In an FDA office building in suburban Maryland, the bureaucrats gather over coffee to draft rules meant to squeeze the trans fat out of snack foods.

Four blocks from the White House, in an EPA conference room: more bureaucrats, more meetings, more drafting of rules, these aimed at forcing industrialists to spend billions cutting carbon to fend off global warming.

Congress? Who needs Congress?

Americans heard President Barack Obama declare this week that he intends to bypass the gridlocked Hill to get things done on his own. What they didn’t hear: just how far he’s actually pushing his executive authority.

An in-depth examination of the administration’s actions and plans, agency by agency, regulation by regulation, reveals an executive power play that’s broad and bold — and intensely ambitious. Far more than he let on in the State of the Union, the president has marshaled the tools of his office to advance policies, many unabashedly liberal, that push deep into everyday life for tens of millions of Americans.

He wants to change how power plants operate. And what we buy for lunch. How we travel to work. And how our kids learn math. How our gasoline is formulated. How we light our aquariums.

Already, the president’s team has enacted 300 economically significant regulations, far more than Bill Clinton, George W. Bush or Ronald Reagan did in comparable periods. Some of those rules are driven by the Affordable Care Act and Dodd-Frank banking reform, the two big laws Obama pushed through Congress early in his first term, when he had Democratic majorities in both houses. But there is far more.

Follow the link and read the rest, if you have the stomach for it.

The Empire lives, but it’s a different Empire than the one that enjoyed its last hurrah in the early 1990s. The Empire now exists not to make Americans safe and prosperous, but to dominate Americans in the name of overblown and non-existent threats (e.g., sexism, racism, endangered species, global warming), out of ersatz compassion, and with the aim of attaining the impossible: equality for all. Well, equality for all but that minority of minorities — the hard-working, tax-paying, straight, white person of European or Asian descent who minds his own business and not everyone else’s. If you are one of those, and religious as well, you are a particular object of persecution and prosecution.

In sum, a new Empire has arisen on America’s shores. If it had a motto, it would be* “trillions for the regulatory-welfare state and its clients, but not enough for defense.”

*     *     *

Related reading:
Bill Gertz, “Putin’s July 4th Message,” The Washington Free Beacon, July 6, 2012
Dean Cheng, “South China Sea: China Drops a Bombshell,” The Foundry, July 7, 2012
Walter Russell Mead and staff, “Putin Tells His Ambassadors: The West Is All Washed Up,” The American Interest, July 9, 2012
Erica Ritz, “Troubling? Putin Oversees Largest Nuclear Tests since the Cold War,” The Blaze, October 20, 2012
Norman Podhoretz, “Obama’s Successful Foreign Failure,” WSJ.com, September 8, 2013
Melanie Phillips, “Putin Checkmates America,” Melanie’s Blog, September 15, 2013
Walter Russell Mead (and staff), “Mixed Messages from Washington Confuse Allies,” The American Interest, December 3, 2013
Lawrence W. Reed, “The Fall of the Republic,” The Freeman, January 8, 2014
doriangrey1, “The Iranian Rope-a-Dope,” The Wilderness of Mirrors, January 20, 2014
Bill Vallicella, “The Decline of the West: How Long Can We Last?,” Maverick Philosopher, January 21, 2014
Adam Garfinkle, “Obama’s Middle East Recessional” in four parts (here, here, here, here), The American Interest, January 21, 2014
Victor Davis Hanson, “Obama’s Recessional,” RealClearPolitics, January 22, 2014
Elise Cooper, “Barack Obama’s Foreign Policy: An Utter Failure,” American Thinker, January 26, 2014
Dan Roberts, “White House Warns Obama Ready to ‘Bypass on 2014 Agenda,” The Guardian, January 26, 2014
Alexander Boltin, “Cruz: Putin Plays Chess, Obama Plays Checkers on Foreign Policy,” The Hill, January 28, 2014
Stephanie Simon, “Obama’s Power Play,” Politico, January 31, 2014
Tom Blumer, “Is It Over and We Just Don’t Know It? Have We Lost Our Founders’ Government?,” PJ Media, February 10, 2014
Victor Davis Hanson, “An Orwellian Nation of Obamathink,” Jewish World Review, February 13, 2014
Angelo M. Codevilla, “Do We Deserve the Constitution of 2014?,” Library of Law and Liberty, February 16, 2014
Richard Winchester, “Left-Wing Totalitarianism in America,” American Thinker, February 17, 2014

Related posts:
The Near-Victory of Communism
Tocqueville’s Prescience
The Left
Our Enemy, the State
“Intellectuals and Society”: A Review
The Left’s Agenda
Rating America’s Wars
Transnationalism and National Defense
The Left and Its Delusions
The Destruction of Society in the Name of “Society”
September 20, 2001: Hillary Clinton Signals the End of “Unity”
The War on Terror, As It Should Have Been Fought
The Spoiled Children of Capitalism
Politics, Sophistry, and the Academy
Subsidizing the Enemies of Liberty
Well-Founded Pessimism
Defense as an Investment in Liberty and Prosperity
Liberty and Society
Tolerance on the Left
America: Past, Present, and Future
The Barbarians within and the State of the Union
Estimating the Rahn Curve: Or, How Government Spending Inhibits Economic Growth
America’s Financial Crisis Is Now
The World Turned Upside Down
“We the People” and Big Government
The Culture War
Defense Spending: One More Time
Parsing Political Philosophy (II)
__________
* A mockery of the words of Robert Goodloe Harper, who as a member of the U.S. House of Representatives in 1797, said “Millions for defense, but not one cent for tribute.” The remark was occasioned by a demand from France for tribute (a bribe) in exchange for the release of American ships that had been seized by the French.

The True Multiplier

Incorporated in this page.

Prescience about Obamacare

The estimable Charles Krauthammer writes about Obamacare:

Obamacare was sold as simply a refinement of the current system, retaining competition among independent insurers but making things more efficient, fair and generous. Free contraceptives for Sandra Fluke. Free mammograms and checkups for you and me. Free (or subsidized) insurance for some 30 million uninsured. And, mirabile dictu, not costing the government a dime….

That was a fraud from the very beginning. The law was designed to throw people off their private plans and into government-run exchanges where they would be made to overpay — forced to purchase government-mandated services they don’t need — as a way to subsidize others. (That’s how you get to the ostensible free lunch.) …

Three years ago I predicted that Obamacare would turn insurers into the lapdog equivalent of utility companies. I undershot. They are being treated as wholly owned subsidiaries. Take the phrase “strongly encouraging.” Sweet persuasion? In reality, these are offers insurers can’t refuse. Disappoint your federal master and he has the power to kick you off the federal exchanges, where the health insurance business of the future is supposed to be conducted.

Moreover, if adverse selection drives insurers into a financial death spiral — too few healthy young people to offset more costly, sicker, older folks — their only recourse will be a government bailout. Do they really want to get on the wrong side of the White House, their only lifeline when facing insolvency?

Obamacare posed as a free-market alternative to a British-style single-payer system. Then, during congressional debate, the White House ostentatiously rejected the so-called “public option.” But that’s irrelevant. The whole damn thing is the public option. The federal government now runs the insurance market, dictating deadlines, procedures, rates, risk assessments and coverage requirements. It’s gotten so cocky it’s now telling insurers to cover the claims that, by law, they are not required to.

Welcome 2014, our first taste of nationalized health care.

I must say, in all modesty, that I (and others) predicted the shape of the future more than four years ago,  well before Obamacare became “the law of the land.” See, for example, my posts dated July 27, September 12, October 9, and October 18, 2009:

Rationing and Health Care
The Perils of Nannyism: The Case of Obamacare
More about the Perils of Obamacare
Health-Care Reform: The Short of It

Other related posts:
The Unconstitutionality of the Individual Mandate
Does the Power to Tax Give Congress Unlimited Power?
Does Congress Have the Power to Regulate Inactivity?
Obamacare: Neither Necessary nor Proper
Obamacare, Slopes, Ratchets, and the Death-Spiral of Liberty
Another Thought or Two about the Obamacare Decision
Obamacare and Zones of Liberty
“Social Insurance” Isn’t Insurance — Nor Is Obamacare

The Keynesian Multiplier: Phony Math

Incorporated in this page.

“Social Insurance” Isn’t Insurance — Nor Is Obamacare

Social Security, Medicare, and Medicaid (as revised and expanded by Obamacare) are by far the costliest forms of “social insurance” in the United States. According to estimates prepared by the Congressional Budget Office, those programs (including ancillary activities, such as insurance subsidies) will cost $3.3 trillion in 2023. However, the feds will collect only $1.6 trillion in “social insurance” taxes in 2023. That’s a $1 trillion increase in the “social insurance” deficit from its level in 2013. (Derived from Summary Table 1, Table 1-1, and Table 1-3 of “The Budget and Fiscal Outlook: Fiscal Years 2013 to 2023,” February 2013.)

I put quotation marks around “social insurance” because it isn’t insurance, for the reasons discussed in this post. What is it? Just another set of programs designed to redistribute income, mainly from those who’ve earned it to those who haven’t. “Social insurance” is a trickle-down transfer-payment scheme, wherein some of the money reaches its intended targets after passing through the sticky fingers of the overpaid bureaucrats who live in and around Washington, D.C.

What’s the difference between “social insurance” and real insurance? Insurance — to be insurance and not merely a subsidy — must have the following characteristics:

  • It must apply to defined, undesirable events that might befall any person or business in the insured group.
  • The group will be defined by specific characteristics (e.g., age range, gender, medical history, location relative to a known hazard such as forest fires).
  • The probability of occurrence (frequency) of a particular event can be estimated with some accuracy, for the group as a whole.
  • There is no way to predict the timing or frequency with which the event will befall a particular member of the group.
  • In exchange for a specified premium, an insurer agrees to pay each member of the group a specified amount should an insured event befall that member during a specified time period.
  • The insurer will periodically revise his estimate of the probability of the occurrence of various events and the costs of insuring against those those events, and may accordingly change the terms on which he offers insurance (e.g., covered events, premium, amount to be reimbursed, conditions for insurance eligibility).
  • Insurance should be self-sustaining. The insurer, taking into account risk and uncertainty, will strive for a situation where, in most years, premiums cover payouts plus administrative expenses and enough profit to keep the insurer from moving his capital to other, more-rewarding ventures.
  • But insurance cannot be sustained by force — through taxes levied on taxpayers at large to provide benefits to certain classes of persons, for example. Any such program fails to meet the criteria listed above, and is nothing more than a subsidy.

“Social insurance” isn’t insurance because it fails on all counts.

Consider Social Security. Retirement is not an undesirable event that might occur; it is a desirable event toward which almost everyone strives. Social Security is merely a government-imposed substitute for the prudent act of saving toward one’s retirement and then drawing on the accumulated nest-egg to finance that retirement. The usual excuse for Social Security is that a lot of people, especially low-income persons, can’t or won’t save enough to maintain some (arbitrary) standard of living during retirement. In other words, Social Security isn’t insurance against an unpredictable event, it’s a mechanism for subsidizing low-income and imprudent persons at the expense of their opposites.

The same analysis applies to Medicare, Medicaid, and other forms of federal and State “social insurance.” The risk pools are huge and ill-defined. The premiums are either nominal (Medicare) or non-existent (Medicaid and other programs). All such programs are nothing more than non-contractual “promises” to pay certain amounts for certain events, regardless of the probability of those events and their associated costs.

Even programs that mimic insurance — unemployment benefits and workers’ compensation, for example — are really subsidies because of their all-encompassing nature and the forcible extraction of “premiums” from employers. Those who are at risk for unemployment and on-the-job injuries have no say in the matter of how much insurance they wish to purchase and how much they are willing to pay for it. Unemployment “insurance” is an especially weird kind of “insurance,” in that the benefits expand and contract according to the whims of government actors.

Enough said about “social insurance” as insurance. It simply isn’t insurance. And thanks largely to Obamacare, health insurance is going the way of “social insurance.”

Health insurance, despite heavy regulation and the distortions produced by tax breaks, has until recently retained the characteristics of true insurance. Now comes Obamacare, the point of which is to move toward universal, government-controlled health care under the guise of “insuring” a larger fraction of Americans. What Obamacare really does, of course, is to force Americans, as consumers and taxpayers, to buy and subsidize “insurance” that covers events that aren’t health risks; for example: so-called preventive care, the use of contraceptives, abortion, various kinds of maternity and pediatric care, and the coverage of “children” up to the age of 26.

What about mandatory coverage of pre-existing conditions? Here’s Greg Mankiw on the subject:

A large part of the motivation of the Affordable Care Act is to provide insurance to those with pre-existing conditions. Under the law, insurance is offered to everyone at a price based on overall community risk, not the risk estimated by the insurance company based on a person’s particular characteristics. That has been deemed “fair” by advocates of the law.

I wonder whether advocates of this view are concerned with other insurance markets.  Teenage drivers pay a lot more for auto insurance. The old pay a lot more for life insurance.  Life insurance companies require health screening before granting a policy. Is this a problem, or the natural and desirable functioning of markets?

The answer to Mankiw’s question is that advocates of Obamacare aren’t really trying to insure anyone, they’re trying (successfully) to ram socialized medicine down the throats of Americans. Obamacare is a step in exactly the wrong direction. It’s an effort to emulate the long-discredited nationalized health-care systems of Canada and Britain (small sample here), complete with death panels. And sure enough, they’re already here, in Oregon.

I was prompted to write this post because I happened on a piece by Scott Gallipo, writing at The American [Pseudo-] Conservative. In a patent attempt to defend Obamacare, Gallipo begs real conservatives to “Stop Comparing Health Insurance to Car Insurance.” Gallipo’s “argument” is fatally confused; for example:

It’s helpful to step back and remind ourselves why we ask doctors to perform “preventative maintenance” on our bodies. If diseases are caught early, they’re often cheaper to treat or cure. If we stay in good physical shape, we reduce the chances of developing many diseases in the first place. When we preventatively maintain our cars, however, we are merely forestalling problems that we would have to pay out-of-pocket for anyway. If you don’t change your oil, your car insurance plan isn’t going to cover the cost of fixing a seized engine.

Gallipo is trying to distinguish preventive health care from preventive auto care, but he fails to do so. For one thing, he wrongly asserts that preventive maintenance forestalls problems that would have to be paid for out-of-pocket. Not necessarily. That’s why warranties (insurance) and their cost (premiums in disguise) are baked into the price of new autos. And that’s why many auto buyers obtain extended warranties. As it happens, I obtained my extended warranty from GEICO. It’s additional coverage under my auto policy, and it commands an additional premium And what does GEICO call my extended warranty? Mechanical breakdown coverage (i.e., insurance).

More fundamentally, Gallipo makes some heroic assumptions about preventive care. Yes, routine tests will sometimes result in the detection and treatment of conditions that would otherwise be detected at a later stage. But the cost of checkups and lab tests, when ordered wholesale by doctors because they’re “free,” far exceeds the benefits. (See this, this, this, and this, for example.)

Most fundamentally, Gallipo begs the question. In his (incorrect) view, preventive “care” on a massive scale is a “good thing.” Therefore, it should be covered by insurance. But the massive overuse of “free” checkups and lab tests has nothing to do with insurance, and everything to do with the nationalization of health care. Those “free” checkups and tests will not be paid for by risk-related premiums; they will be paid for by taxpayers and the millions of Americans whose Obamacare “premiums” are really “contributions” to an open-ended national health-care plan.

*     *     *

Related posts:
Rationing and Health Care
The Perils of Nannyism: The Case of Obamacare
More about the Perils of Obamacare
Health-Care Reform: The Short of It
Toward a Risk-Free Economy
Enough of “Social Welfare”
Points of Agreement and Reinforcement
Death Panels
Government Failure Comes as a Shock to Liberals
The View from Here
Another Obama Lie, and a Rant

Progressive Taxation Is Alive and Well in The U.S. of A.

THIS IS A RE-POSTING OF THE ORIGINAL, WHICH APPEARED ON JULY 20, 2012

Will Wilkinson, in the course of a good post about Obama’s big lie, writes:

I’d like to thank my colleague [a blogger who goes by D.R.] for helping me see how to make my case stronger. Of the comprehensive American tax system, he writes:

The fact of the matter is that the American tax code as a whole is almost perfectly flat. The bottom 20% of earners make 3% of the income and pay 2% of the taxes; the middle 20% make 11% and pay 10%; and the top 1% make 21% and pay 22%. Steve Forbes couldn’t have drawn it up any better.

I happen to agree with Steve Forbes that a flat tax best reflects our intuitions about proportionality and fairness, so I’m tickled to see that our system is so fair!

The link attached to “almost perfectly flat” leads to this:

The source is a “sister organization” of the union-dominated lobbying organization, Citizens for Tax Justice, which is responsible for a graph that I reproduced in “Elizabeth Warren Is All Wet“:

As I said in “Elizabeth Warren…,” Citizens for Justice

acknowledges (backhandedly) that “the rich” pay their “fair share” of all taxes — federal, State, and local….

[G]iven the source, this [graph] can be taken as a “worst case” depiction of the distribution of the total tax burden. “The rich” are paying their “fair share,” and then some, unless you believe (as leftists seem to believe) that  “the rich” are supposed to take care of everyone else.

Not surprisingly, the statistics for 2011 yield a graph that looks much like the one just above:

What puzzled me, briefly, is why the Citizens for Tax Justice and Institute for Taxation and Economic Policy split the top quintile into chunks. Then it occurred to me that those left-wing outfits are trying to suppress the fact that taxpayers in the top quintile pay a disproportionate share of all taxes. Thus:

Further, the effective tax rate isn’t quite as flat as the left-wing outfits would like gullible readers to believe. Thus:

If that isn’t the picture of a progressive tax structure, I’ll eat my external hard drive.

The innumerate reader might say something like “Gee willikers, people who make more ought to pay more in taxes.” Think about it for a minute. If someone earning $100,000 pays taxes at the same rate as someone earning $10,000, the person earning $100,000 does pay more in taxes. For example: $100,000 times a tax rate of 15 percent is greater than $10,000 times a tax rate of 15 percent — 10 times greater, to be precise. Raise to 30 percent the tax rate on the person making $100,000 and, voila, his tax bill is 20 times greater than that of the person making $10,000.

A progressive tax structure penalizes success, which inhibits economic growth, which means fewer jobs and lower incomes for the low-income persons who are the supposed beneficiaries of progressive taxation. I say “supposed” because the “house” (high-paid office holders and bureaucrats, all with cushy health insurance and pension plans) takes its very large cut before any of the money extorted from those who earn it trickles down to those who don’t earn it.

Related reading:
Greg Mankiw, “The Progressivity of Taxes and Transfers
Steve Landsburg, “Charting the Tax Plans

Related posts:
A True Flat Tax
Taxing the Rich
More about Taxing the Rich
In Defense of the 1%
The Burden of Government
Economic Growth Since World War II
Economics: A Survey
The Barbarians Within and the State of the Union
Why Are Interest Rates So Low?
Estimating the Rahn Curve: Or, How Government Spending Inhibits Economic Growth
America’s Financial Crisis Is Now

Obamanomics: A Report Card (Updated)

See this post.


The Obama Effect: Disguised Unemployment (Updated)

Here.

The View from Here

You know what happens when a law is enacted to protect a “minority,” don’t you? The minority acquires privileged status in the eyes of the law. Any action that is claimed to deprive the “minority” of its rights brings the wrath of the state down on the purported offender. And the same law enables members of the “minority” to attain jobs, promotions, and university admissions for which they are otherwise unqualified.

My opening paragraph is prompted by the likely passage of a “gay rights in workplace” bill by the U.S. Senate. The bill is unlikely to be approved soon by the U.S. House of Representatives, but I won’t say “never.” Many members of the GOP are eager to seem “nice,” and enough of them might vote with Democrats to pass the bill and send it to B.O. for signature. Such an act of appeasement will, of course, go unrewarded by voters of the left. But panicked lawmakers are immune to logic, and devoid of principles.

The “gay rights” issue is only a symptom of America’s decay. The official elevation of gays to privileged status is of a piece with several other developments: the very possible failure of efforts to derail death-dealing Obamacare, the equally likely failure of efforts to curb murderous abortion (the gateway to involuntary euthanasia), the ever-growing dependence of Americans on an unaffordable welfare state, an unchecked regulatory apparatus, feminized and gutted defenses, groveling before enemies, and the suppression of dissent in the name of “rights,” “social justice,” “equal protection,” and other Orwellian catch-phrases.

It is altogether evident that America soon will be an irreversibly effete, statist, inhumane, and appeasing realm. In it, every truly beneficial impulse — like those that energized America’s revolution against Britain, the framing of a Constitution that promised the preservation of liberty, the defeat of oppressive regimes in wars hot and cold, and the creation of the world’s most dynamic and productive economy — will be squelched.

The barbarians within, and their willing dupes, are in the saddle. It can happen here, and it is happening here. America is about to become the land of the unfree and the home of the weak-kneed.

*     *     *

Related reading: Joe Herring, “I Am Now a Dissident (and You Should Be Too!),” American Thinker, November 6, 2013

Related posts:
Diversity
Putting Hate Crimes in Perspective
The Cost of Affirmative Action
Why Not Just Use SAT Scores?
The Face of America
Affirmative Action: A Modest Proposal
Race, Intelligence, and Affirmative Action
Affirmative Action: Two Views from the Academy
Affirmative Action, One More Time
Libertarianism, Marriage, and the True Meaning of Family Values
Same-Sex Marriage
“Equal Protection” and Homosexual Marriage
The Course of the Mainstream
A Contrarian View of Segregation
Much Food for Thought
Guilty Until Proven Innocent
After the Bell Curve
A Footnote . . .
Schelling and Segregation
Law, Liberty, and Abortion
Black Terrorists and “White Flight”
Positive Rights and Cosmic Justice: Part IV (with links to earlier parts of the series)
Timely Material
Affirmative Action: Two Views from the Academy, Revisited
It’s the Little Things That Count
A Footnote to a Footnote
Let Me Be Perfectly Clear…
FDR and Fascism
An FDR Reader
“Family Values,” Liberty, and the State
Is There Such a Thing as Society
The People’s Romance
Intellectuals and Capitalism
Fascism
Conspicuous Consumption and Race
An Honest Woman Speaks Out
Fascism with a “Friendly” Face
The Interest-Group Paradox
Parsing Political Philosophy
Is Statism Inevitable?
Inventing “Liberalism”
Civil Society and Homosexual “Marriage”
A New, New Constitution
Fascism and the Future of America
The Indivisibility of Economic and Social Liberty
Rights, Liberty, the Golden Rule, and the Legitimate State
The Perils of Nannyism: The Case of Obamacare
More about the Perils of Obamacare
Health-Care Reform: The Short of It
The Real Constitution and Civil Disobedience
The Near-Victory of Communism
Tocqueville’s Prescience
First Principles
The Shape of Things to Come
Accountants of the Soul
Invoking Hitler
Is Liberty Possible?
The Left
Perry v. Schwarzenegger, Due Process, and Equal Protection
The Constitution: Original Meaning, Corruption, and Restoration
Rationalism, Social Norms, and Same-Sex “Marriage”
A Moral Dilemma
A Conversation with Uncle Sam
Society and the State
I Want My Country Back
The “Forthcoming Financial Collapse”
Undermining the Free Society
Our Enemy, the State
Pseudo-Libertarian Sophistry vs. True Libertarianism
“Intellectuals and Society”: A Review
Government vs. Community
The Evil That Is Done with Good Intentions
The Destruction of Society in the Name of “Society”
About Democracy
Externalities and Statism
Taxes: Theft or Duty?
Bounded Liberty: A Thought Experiment
More Pseudo-Libertarianism
The Meaning of Liberty
The Left’s Agenda
Substantive Due Process and the Limits of Privacy
In Defense of Marriage
The Left and Its Delusions
The Destruction of Society in the Name of “Society”
A Declaration of Civil Disobedience
Crimes against Humanity
Abortion and Logic
The Myth That Same-Sex “Marriage” Causes No Harm
The Spoiled Children of Capitalism
Politics, Sophistry, and the Academy
Subsidizing the Enemies of Liberty
Society and the State
Are You in the Bubble?
Defense as an Investment in Liberty and Prosperity
Our Perfect, Perfect Constitution
Abortion, Doublethink, and Left-Wing Blather
Race and Reason: The Derbyshire Debacle
Race and Reason: The Victims of Affirmative Action
Not-So-Random Thoughts (III)
Race and Reason: The Achievement Gap — Causes and Implications
Don’t Use the “S” Word When the “F” Word Will Do
Liberty and Society
Tolerance on the Left
The Eclipse of “Old America”
The Capitalist Paradox Meets the Interest-Group Paradox
Genetic Kinship and Society
How Not to Cope with Government Failure
Riots, Culture, and the Final Showdown (revisited)
Where We Are, Economically
The Economic Outlook in Brief
Is Taxation Slavery?
Obamanomics: A Report Card
Well-Founded Pessimism
A Declaration of Independence
The 80-20 Rule, Illustrated
America: Past, Present, and Future
Defending Liberty against (Pseudo) Libertarians
America: Past, Present, and Future
Restoring Constitutional Government: The Way Ahead
Economic Horror Stories: The Great “Demancipation” and Economic Stagnation
The Fallacy of the Reverse-Mussolini Fallacy
“Conversing” about Race
Economics: A Survey
IQ, Political Correctness, and America’s Present Condition
The Barbarians Within and the State of the Union
Why Are Interest Rates So Low?
Estimating the Rahn Curve: Or, How Government Spending Inhibits Economic Growth
America’s Financial Crisis Is Now
The World Turned Upside Down
“We the People” and Big Government: Part I
“We the People” and Big Government: Part I (continued)
“We the People” and Big Government: Part II (first installment)

The Obama Effect: Disguised Unemployment (Updated)

Here.

Are You Happy?

A RERUN OF A POST AT MY OLD BLOG, FROM MAY 6, 2008

Justin Wolfers (Freakonomics blog) has completed a series of six posts about the economics of happiness (here, here, here, here, here, and here). The bottom line, according to Wolfers:

1) Rich people are happier than poor people.
2) Richer countries are happier than poorer countries.
3) As countries get richer, they tend to get happier.

All of which should come as no surprise to anyone, without the benefit of “happiness research.” Regarding which, I agree with Arnold Kling, who says:

My view is that happiness research implies Nothing. Zero. Zilch. Nada. I believe that you do not learn about economic behavior by watching what people say in response to a survey.

You learn about economic behavior by watching what people actually do.

And…you consult your “priors.” It is axiomatic that individuals prefer more to less; that is, more income yields more satisfaction because it affords access to goods and services of greater variety and higher quality. Moreover, income and the wealth that flows from it are valued for their own sake by most individuals. (That they might be valued because they enable philanthropic endeavors is a case in point.)

It is reasonable to conclude, therefore, that the “law” of diminishing marginal utility, which may apply to particular goods and services, does not generally apply to income or wealth in the aggregate. But, in any event, given that Wolfers’s first conclusion is self-evidently true, the second and third conclusions follow. And they follow logically, not from “happiness research.”

America’s Financial Crisis Is Now

A REISSUE (WITHOUT UPDATES) OF THE ORIGINAL POST DATED MAY 1, 2011

*     *     *

INTRODUCTION

Three Economic Charts That Will BLOW YOUR MIND,” at RightWing News, offers some tantalizing statistics about the relationship between federal tax receipts and GDP. The bottom line:

The key thing to take away from this is that the amount of revenue the government can bring in via the income tax is, for whatever reason, more inelastic than most people think. That’s yet another reason to put more emphasis on balancing the budget via spending cuts as opposed to trying to fix the problem with tax increases.

Now, if Hauser’s law is as spot-on as it has been in the past … it’s going to be difficult to raise the government’s revenue level much beyond the 20% mark….

I have no quibble with the proposition that the U.S. government has made unaffordable, unilateral “promises” about Social Security, Medicare, and Medicaid benefits. But I must take issue with the focus on the income tax and Hauser’s law, which is

the proposition that, in the United States, federal tax revenues since World War II have always been approximately equal to 19.5% of GDP, regardless of wide fluctuations in the marginal tax rate.

It is necessary to step back from a myopic focus on the federal government and look at all government receipts and expenditures in the United States. The need to do so arises from two facts: (1) State and local spending is substantial, and (2) federal, State, and local finances have become tightly bound together since the advent of revenue sharing and block grants, and with the explosion of federal statutory and regulatory commands to the States.

I begin by looking at the historical record of government income and outgo. That leads me to the future, in which “entitlements” loom unaffordably large . There are three broad paths along which to proceed: cut “entitlements,” borrow considerably more, or tax considerably more. I explain why the second and third options are untenable and economically destructive. The only viable alternative is to cut “entitlements,” and to begin cutting now.

GOVERNMENT SPENDING AND RECEIPTS: THE HISTORICAL RECORD

Here is how State and local spending stacks up against federal spending:

Federal vs state and local spending pct GDP
Sources: Derived from U.S. Department of Commerce, Bureau of Economic Analysis (BEA), National Income and Product Accounts (NIPA) Tables: Table 3.2 Federal Government Current Receipts and Expenditures (lines 26 and 40-45) and Table 3.3 State and Local Government Current Receipts and Expenditures (line 33).

State and local spending is not insubstantial, and has risen in recent decades, with a lot of help from the federal government. Federal grants to State and local governments have risen steadily from almost zero in 1929 to upwards of 4 percent of GDP in recent years. (I have excluded those grants from federal spending to avoid double-counting.)

Here is an aggregate picture of federal, State, and local spending and receipts.

Combined government spending and receipts
Source: Derived from NIPA Table 3.1 Government Current Receipts and Expenditures (lines 7, 19, 30, and 33-39).

Despite Hauser’s “law,” government receipts, as a percentage of GDP, rose steadily from 1929 until 2000, peaking at 32 percent. The post-2000 decline can be attributed to slow economic growth (capped by the recession of 2008-2010) and the so-called Bush tax cuts (which Congress approved initially and again in 2010). I have nothing against the tax cuts, except for the fact that they were not matched by spending cuts. The real burden of government is measured by spending, which diverts resources from productive uses to ones that are less-productive (e.g., public education), counter-productive (e.g., regulation), and downright destructive (i.e., growth-retarding and inflationary). The fact that lenders have increasingly borne the monetary cost of the burden of government has not offset its egregious economic effects. And, as I discuss below, without drastic spending cuts (relative to GDP) there will come a day when lenders will shrug off the burden or demand a much higher price for bearing it.

In any event, regardless of generally diminishing receipts in the first decade of the 21st century, government spending rose as a percentage of GDP, for several reasons. First, there was (and is) slower economic growth, due in no small part to the preceding decades of governmental interference in economic affairs. On top of that, there was Obama’s “stimulus package,” which was meant to end the recession of 2008-2010 but did not (because it could not); the recession ended in the normal way, through the recovery of “animal spirits” and consumer confidence. Then there was (and is) a growing population of persons eligible for Social Security, Medicare (supplemented by “free” or “cheap” prescription drugs), and Medicaid — a population made all the more eager to claim its “entitlements,” given the state of the economy. Finally, and almost incidentally, two foreign wars were fought simultaneously (though with varying degrees of intensity) throughout the decade.

To focus only on federal spending, as I say, is myopic because State and local governments have a habit of raising State and local taxes when so-called federal grants are cut back. (I say “so-called” because the money for those grants is provided largely by taxpayers who are, of course, denizens of the States and their political subdivisions.) In addition to the possibility of higher State and local spending in reaction to cuts in federal largesse, taxpayers — not public-sector unions — should be up in arms about the above-market compensation of government employees. A significant portion of that above-market compensation comes in the form of cushy pension plans, which allow “public servants” to receive high fractions of their salary (sometimes as much as 100 percent) for life, and to begin receiving those payments when they are in their 40s and 50s, after having held a government job for 20 years or so. As a result of these obligations and other undisciplined spending habits, State and local governments have liabilities of more than $7 trillion.

Which brings me to the 500-pound gorilla: the federal government.

“ENTITLEMENTS”: THE SOURCE OF OUR PRESENT AND PROSPECTIVE WOES

Perhaps the most interesting lines in the second graph (above) are the three at the bottom. The gap between the cost of social programs (green line) and “contributions” to those programs (gold line) has risen markedly since the late 1990s. By 2010, the size of that gap — 8.5 percent of GDP — accounted for most deficit spending (red line) — 10.6 percent of GDP. And that is but a hint of things to come. The internet abounds with graphs and tables that depict future federal spending and revenues under various assumptions. They all point to the same conclusion: Spending “commitments” must be cut — and cut drastically — in order to avoid (a) economically disabling tax increases and (b) a day of reckoning in credit markets.

The online offerings include these from the Congressional Budget Office (CBO): “Impact of the President’s Proposals on the Budget Outlook” (blog summary), and “Long Term Analysis of a Budget Proposal by Chairman Ryan” (blog summary). The CBO analyses are somewhat dense and must be read in juxtaposition. They are neatly conjoined by the Committee for a Responsible Federal Budget’s “Analyzing the President’s New Budget Framework.” Here is an informative graphic from that analysis:

Debt projections under various fiscal reform plans

Obama’s “framework,” as the report emphasizes, is short on details. It is obviously a slap-dash response to Paul Ryan’s detailed plan (labelled “House Republicans” in the graphic), which is a serious proposal for long-term deficit reduction. To understand the bankruptcy of Obama’s actual budget and current law, which are about the same, one must look beyond 2021.

Drawing on CBO’s work, Cato Institute’s Michael Tanner take the long view in “Bankrupt: Entitlements and the Federal Budget.” Tanner leads off with this:

The U.S. government is about to exceed its statutory debt limit of $14.3 trillion. But that actually underestimates the size of the fiscal time bomb that this country is facing. If one considers the unfunded liabilities of programs such as Medicare and Social Security, the true national debt could run as high as $119.5 trillion.

Moreover, to focus solely on debt is to treat a symptom rather than the underlying disease. We face a debt crisis not because taxes are too low but because government is too big. If there is no change to current policies, by 2050 federal government spending will exceed 42 percent of GDP. Adding in state and local spending, government at all levels will consume nearly 60 percent of everything produced in this country. Whether financed through debt or taxes, government that large would be a crushing burden to our economy and our liberties. (p. 1)

Government spending now consumes almost 40 percent of everything produced in this country. Imagine the lives of your children and their children if and when government spending consumes almost 60 percent of everything produced in this country. But wait — it can get worse. Here, Tanner projects federal spending under current law, through 2080:

Long-term spending projections (Tanner)

Add State and local spending and, by 2080, you have an economy whose entire output is claimed by government entities. Some of that output would be directed to individuals for their sustenance, of course. But the form of that sustenance — along with everything else — would be dictated and allocated by politicians and bureaucrats. They — and their favored intellectuals, artists, and athletes — would live reasonably well (though not nearly as well as they could in a free-market system), while the proles would lead lives of hard work, hard drink, and hard deaths. It would be the USSR all over again. And, as with the USSR, the misdirection of economic activity by politicians and bureaucrats would ensure economic stagnation.

It may not come to that, if there are enough voters who understand the consequences of unbridled government spending, and who put liberty and true prosperity above the illusory promises of security offered by the big-government crowd. But as time goes by and more voters become accustomed to handouts, they will become “European” in their embrace of the welfare state. Slippery slopes and death-spirals lead to the same slough of despond (second definition).

That said, is there a way to have “our” cake and eat it, too? Can the U.S. government raise enough money through borrowing or taxation to fend off the day of reckoning and attain the left’s dream of attaining “Europeanism”?

BORROWING A SEA OF TROUBLES

In fact, financial markets may help to reign in government spending by sending signals that cannot be ignored — if the U.S. government borrows money from willing lenders instead of just printing it. (Economist Karl Smith explains why printing money — deliberate inflation — is an unlikely course of action. He refers to “structured default,” which is explained here.) As government spending rises, and as voters and politicians (in the main) reject significant tax increases, government debt will rise to unprecedented heights. Here, from The Heritage Foundation’s 2011 Budget Chart Book, is a retrospective and prospective look at the size of the federal government’s debt in relation to GDP:

National debt set to skyrocket

Financial markets will reject U.S. government debt — or charge a lot for carrying it — long before it reaches the levels shown above. The events of year ago, when Greece’s financial bind came to a head, gave a hint of the likely reaction of markets to continued fiscal profligacy. Then, earlier this month, there was a sharp, brief stock-market sell off in response to an announcement by Standard & Poor’s about U.S. government debt (“‘AAA/A-1+’ Rating On United States of America Affirmed; Outlook Revised To Negative“):

  • We have affirmed our ‘AAA/A-1+’ sovereign credit ratings on the United States of America.
  • The economy of the U.S. is flexible and highly diversified, the country’s effective monetary policies have supported output growth while containing inflationary pressures, and a consistent global preference for the U.S. dollar over all other currencies gives the country unique external liquidity.
  • Because the U.S. has, relative to its ‘AAA’ peers, what we consider to be very large budget deficits and rising government indebtedness and the path to addressing these is not clear to us, we have revised our outlook on the long-term rating to negative from stable.
  • We believe there is a material risk that U.S. policymakers might not reach an agreement on how to address medium- and long-term budgetary challenges by 2013; if an agreement is not reached and meaningful implementation is not begun by then, this would in our view render the U.S. fiscal profile meaningfully weaker than that of peer ‘AAA’ sovereigns.

If there is no serious effort to control the growth of the U.S. government’s debt by scaling back “entitlements,” two things will happen: Interest rates will rise, thus compounding the problem, and lenders will back away. Megan McArdle outlines a plausible scenario:

Right now, when Treasury goes to sell new bonds, it enters a fairly robust market, with not just the Fed but a bunch of fairly price-inelastic Asian central banks who are willing to take on our bonds at whatever the market offers. If China exits the market, we will either need to borrow less, or attract new lenders by offering higher interest rates. Even a noticeable decrease in volume would force us to pay more for our deficits….

… A lot of people tend to assume that there will be warning signs telling us that we need to get our fiscal house in order: China will slow down its bond purchases, interest rates will gradually rise. But in fact, the lesson of fiscal crises is that the “warning signs” we’re watching for often are the crisis. Unless interest rates increase (or debt buying decrease–which is really the same thing) in a very gradual, orderly fashion, then by the time your interest rates rise, it is already too late to do anything easy; your debt service burden forces you into dramatic fiscal measures, or default.

According to economist Carmen Reinhart, who has made an intensive study of crises, there’s no reason to expect the change to be orderly and gradual. She says the lesson of history is pretty unequivocal: interest rates are not a good predictor of who is about to tip into a crisis. People are willing to lend at decent rates, until suddenly they’re barely willing to lend at all.

When you look at how much of our debt comes due by the end of 2012, it’s easy to see how fast higher interest rates could turn into a real problem for us. To be sure, we’re no Japan–but that’s not necessarily a happy thought, because Japan finances something like 95% of its debt from its pool of thrifty (and nationalistic) savers. Their stock of lenders probably isn’t going anywhere. Ours might.

Lawrence Kotlikoff agrees:

…CBO’s baseline budget updates suggest the date for reaching what Carmen Reinhart, Kenneth Rogoff and other prominent economists believe is a critical insolvency threshold — a 90 percent ratio of federal debt held by the public to gross domestic product — has moved four years closer, in just nine months!…

And if foreigners balk at buying U.S. debt, why would Americans fill the breach? Is there a patriotic duty to finance socialism?

In summary, it seems unlikely that the U.S. can erect a full-blown welfare state on the backs of lenders. Can it be done on backs of taxpayers?

TAXING “THE RICH” — AND A LOT OF OTHERS, TOO?

The short answer to the preceding question is “no.” In evidence, I return to Michael Tanner’s “Bankrupt: Entitlements and the Federal Budget“:

Many observers suggest that we can simply tax the rich. For example, the Center for American Progress has recommended, among other things, imposing a 5–7 percent surtax on households with incomes above $500,000 per year, eliminating the cap on Social Security payroll taxes, increasing the estate tax, and raising the top marginal tax rate on capital gains and dividends.60 That would potentially raise the total marginal tax burden on some people to well above 50 percent.

Setting aside the simple immorality of government taking such an enormous portion of anyone’s income, there are many reasons to be skeptical of such an approach, starting with the fact that it may not actually generate any additional revenue….

…[I]ncentives matter. At some point taxes become high enough to discourage economic activity and therefore produce less revenue than would be predicted under a more static analysis….

But even if one assumes that taxes can be raised without having any impact on economic growth, taxing the rich still wouldn’t get us out of our budget hole—because the hole is quite simply bigger than the amount of revenue we could raise from taxing the rich even if there were no disincentives. To put it in admittedly oversimplified perspective: our current obligations, including both implicit and explicit debt, total more than 900 percent of GDP. The combined wealth of everyone in the United States who earns at least $1 million per year equals roughly 100 percent of GDP…. Therefore, you could confiscate the entire wealth of every millionaire in the United States and still barely make a dent in the amount we will owe.

Clearly, therefore, any tax increases would have to extend well beyond “the rich.” In fact, the Congressional Budget Office said in 2008 that in order to pay for all currently scheduled federal spending both the corporate tax rate and top income tax rate would have to be raised from their current 35 percent to 88 percent, the current 25 percent tax rate for middle-income workers to 63 percent, and the 10 percent tax bracket for low-income workers to 25 percent. It is likely, given increased spending since then, that the required tax levels would be even higher today.

Regardless of how one feels about taxing the rich, taxes at those levels would be devastating to future economic growth.

Harvard economist Martin Feldstein points out that the actual loss from tax increases to the private sector is a combination of the confiscated revenue as well as a hidden cost of the actual increase, known as deadweight loss. This hidden cost can be very expensive. Feldstein calculates that “the total cost per incremental dollar of government spending, including the revenue and the deadweight loss, is . . . a very high $2.65. Equivalently, it implies that the marginal excess burden per dollar of revenue is $1.65.” This means that for every 1 percent of GDP needed to be raised in revenue, the equivalent of 2.65 percent of GDP needs to be extracted from the private sector first.

Clearly, tax increases required to finance an increase in spending of more than 40 percent of GDP would place an impossible burden on the private economy. (pp. 13-4, source notation omitted)

One more thing (from Table 1 of the Tax Foundation’s “Fiscal Facts“): For 2008, federal income tax returns with adjusted gross incomes in the top 1 percent accounted for 38 percent of income taxes; the top 5 percent, 59 percent; the top 10 percent, 70 percent; the top 25 percent, 86 percent; and the top 50 percent, 97 percent. Not only that, but the top 10 percent of American taxpayers is taxed more heavily than the top 10 percent in other developed countries, including those “advanced” European countries that American leftists would like to emulate. (See “No Country Leans on Upper-Income Households as Much as U.S.” at the Tax Foundation’s Tax Policy Blog.) And the left has the gall to claim that America’s “rich” aren’t paying enough taxes!

VIVE LA RÉSISTANCE

It will not do simply to put an end to the U.S. government’s spending spree; too many State and local governments stand ready to fill the void, and they will do so by raising taxes where they can. As a result, some jurisdictions will fall into California- and Michigan-like death-spirals while jobs and growth migrate to other jurisdictions. Contemporary mercantilists to the contrary, the “winners” are “losers,” too. Even if Congress resists the urge to give aid and comfort to profligate States and municipalities at the expense of the taxpayers of fiscally prudent jurisdictions, the high taxes and anti-business regimes of California- and Michigan-like jurisdictions impose deadweight losses on the whole economy. If you believe otherwise, you believe in the broken-window fallacy, wherein an economically destructive force (natural or governmental) is credited with creating jobs and wealth because it leads to the visible expenditure of effort and resources.

So, the resistance to economically destructive policies cannot end with efforts to reverse the policies of the federal government. But given the vast destructiveness of those policies — “entitlements” in particular — the resistance must begin there. Every conservative and libertarian voice in the land must be raised in reasoned opposition to the perpetuation of the unsustainable “promises” currently embedded in Social Security, Medicare, and Medicaid — and their expansion through Obamacare. To those voices must be added the voices of “moderates” and “liberals” who see through the proclaimed good intentions of “entitlements” to the economic and libertarian disaster that looms if those “entitlements” are not pared down to their original purpose: providing a safety net for the truly needy.

The alternative to successful resistance is stark: more borrowing, higher interest payments, unsustainable debt, higher taxes, and economic stagnation (at best).

Estimating the Rahn Curve: Or, How Government Inhibits Economic Growth

UPDATED 12/13/14 — This update consists of a comment about my estimate of the Rahn curve. I have just published a much better estimate of the curve for the post-World War II era.

UPDATED 12/28/11 — This update incorporates GDP and government spending statistics for 2010 and corrects a minor discrepancy in the estimation of government spending. Also, there are new, easier-to-read graphs. The bottom line is the same as before: Government spending and everything that goes with it (including regulation) is destructive of economic growth.

UPDATED 09/19/13 — This version incorporates two later posts “Estimating the Rahn Curve: A Sequel” (01/24/12) and “More Evidence for the Rahn Curve” (05/27/12).

*     *     *

The theory behind the Rahn Curve is simple — but not simplistic. A relatively small government with powers limited mainly to the protection of citizens and their property is worth more than its cost to taxpayers because it fosters productive economic activity (not to mention liberty). But additional government spending hinders productive activity in many ways, which are discussed in Daniel Mitchell’s paper, “The Impact of Government Spending on Economic Growth.” (I would add to Mitchell’s list the burden of regulatory activity, which accumulates with the size of government.)

What does the Rahn Curve look like? Daniel Mitchell estimates this relationship between government spending and economic growth:

Rahn curve (2)

The curve is dashed rather than solid at low values of government spending because it has been decades since the governments of developed nations have spent as little as 20 percent of GDP. But as Mitchell and others note, the combined spending of governments in the U.S. was 10 percent (and less) until the eve of the Great Depression. And it was in the low-spending, laissez-faire era from the end of the Civil War to the early 1900s that the U.S. enjoyed its highest sustained rate of economic growth.

Here is a graphic look at the historical relationship between government spending and GDP growth:

(Source notes for this graph and those that follow are at the bottom of this post.)

The regression lines are there simply to emphasize the long-term trends. The relationship between government spending as a percentage of GDP (G/GDP) and real GDP growth will emerge from the following graphs. There are chronological gaps because the Civil War, WWI, the Great Depression, and WWII distorted the relationship between G/GDP and economic growth. Large wars inflate government spending and GDP. The Great Depression saw a large rise in G/GDP, by pre-Depression standards, even as the economy shrank and then sputtered to a less-than-full recovery before the onset of WWII.

Est Rahn curve 1792 1861

Est Rahn curve 1866 1917

Est Rahn curve 1792 1917

Est Rahn curve 1946-2010

The graphs paint a consistent picture: Higher G/GDP means lower growth. There is one inconsistency, however, and that is the persistence of growth in the range of 2 to 4 percent during the post-WWII era, despite G/GDP in the range of 25-45 percent. That is not the kind of growth one would expect, given the relationships that obtain in the earlier eras. (The extrapolated trend line for 1946-2009 comes into use below.)

There are at least five plausible — and not mutually exclusive — explanations for the discrepancy. First, there is the difficulty of estimating GDP for years long past. Second, it is almost impossible to generate a consistent estimate of real GDP spanning two centuries; current economic output is vastly greater in volume and variety than it was in the early days of the Republic. Third, productivity gains (advances in technology, management techniques, and workers’ skills) may offset the growth-inhibiting effects of government spending, to some extent. Fourth, government regulations and active interventions (e.g., antitrust activity, the income tax) have a cumulative effect that operates independently of G/GDP. Regulations and interventions may have had an especially strong effect in the early 1900s (see the second graph in this post). The effects of regulations and interventions may diminish with time because of  adaptive behavior (e.g., “capture” of regulatory bodies).

Finally, and perhaps most importantly, there is the shifting composition of government spending. At relatively low levels of G/GDP, G consists largely of government programs that usurp and interfere with private-sector functions by diverting resources from productive uses to uses favored by politicians, bureaucrats, and their patrons. Higher levels of G/GDP — such as those we in the United States have known since the end of WWII — are reached by the expansion of the welfare state. Government spending (at all levels) on so-called social benefits accounted for only 7 percent of G and 0.8 percent of GDP in 1929; in 2009, it accounted for 36 percent of G and 15 percent of GDP. The provision of “social benefits” brings government into the business of redistributing income, which discourages work, saving, and capital formation to some extent, but doesn’t impinge directly on commerce. Therefore, I would expect G to be less damaging to GDP growth at higher levels of G/GDP — which is the message to be found in the contrast between the experience of 1946-2009 and the experience of earlier periods.

With those thoughts in mind, I present this empirical picture of the relationship between G/GDP and GDP growth in the United States:

Est Rahn curve 1792-2010

The intermediate points, unfortunately, are missing because of the chronological gaps mentioned above. But, as indicated by the five earlier graphs, it is entirely reasonable to infer from the preceding graph a strong relationship between GDP growth and changes in G/GDP throughout the history of the Republic.

It is possible to obtain a rough estimate of the downward sloping portion of the Rahn curve by focusing on two eras: the post-Civil War years 1866-1890 — before the onset of “progressivism,” with its immediate and strong negative effects — and the post-WWII years 1946-2009. Thus:

Est Rahn curve rough sketch

My rough estimate is appropriately “fuzzy” and somewhat more generous than Daniel Mitchell’s, which is indicated by the heavy black line. In light of my discussion of the shifting composition of G as G/GDP becomes relatively large, I  have followed the slope of the trend line for 1792-2010; that is, every 1 percentage-point increase in G/GDP yields a decrease in the growth rate of about 0.07 percent. That seemingly small effect becomes a huge one when G/GDP rises over a long period of time (as has been the case for more than a century, with no end in sight).

For the record, the best fit through the “fuzzy” area is:

Annual rate of growth = -0.066(G/GDP) + 0.054.

[A revised and more realistic estimate for the post-World War II era is

Real rate of growth = -0.372(G/GDP) + 0.067(BA/GDP) + 0.080 ,

where the real rate of growth is the annualized rate over a 10-year period, G/GDP is the fraction of GDP spent by government (including social transfers) over the preceding 10-year period, and BA/GDP represents business assets as a fraction of GDP for the preceding 10-year period.]

Again, it’s the annualized rate of growth over a 10-year span, as a function of G/GDP (fraction of GDP spent by governments at all levels) in the preceding 10 years. The new term, BA/GDP, represents the constant-dollar value of private nonresidential assets (i.e., business assets) as a fraction of GDP, averaged over the preceding 10 years. The idea is to capture the effect of capital accumulation on economic growth, which I didn’t do in the earlier analysis.

Maximum GDP growth seems to occur when G/GDP is 2-4  percent. That is somewhat less than the 7-percent share of GDP that was spent on national defense, public order, and safety in 2010. The excess represents additional “insurance” against predators, foreign and domestic. (The effectiveness of the additional “insurance” is a separate question, though I am inclined to err on the side of caution when it comes to defense and law enforcement. Those functions are not responsible for the economic woes facing America’s taxpayers.)

If G/GDP reaches 55 percent — which it will if present entitlement “commitments” are not curtailed — the “baseline” rate of growth will shrink further: probably to less than 2 percent. And thus America will remain mired in its Mega-Depression.

*     *     *

Source notes:

Estimates of real and nominal GDP, back to 1790, come from the feature “What Was the U.S GDP Then?” at MeasuringWorth.com.

Estimates of government spending (federal, State, and local) come from USgovernmentspending.com; Statistical Abstracts of the United States, Colonial Times to 1970: Part 2. Series Y 533-566. Federal, State, and Local Government Expenditures, by Function; and the Bureau of Economic Analysis (BEA), Table 3.1. Government Current Receipts and Expenditures (lines 34, 35).

I found the amount spent by governments (federal, State, and local) on national defense and public order and safety by consulting BEA Table 3.17. Selected Government Current and Capital Expenditures by Function.

The BEA tables cited above are available here.

*     *     *

ADDENDUM: THE RAHN CURVE: A SEQUEL

In the original post (above) I note that maximum GDP growth occurs when government spends two to four percent of GDP. The two-to-four percent range represents the share of GDP claimed by American governments (federal, State, and local) throughout most of the 19th century, when government spending exceeded five percent of GDP only during the Civil War.

Of course, until the early part of the 20th century, when Progressivism began to make itself felt in Americans’ tax bills, governments restricted themselves (in the main) to the functions of national defense, public order, and safety — the terms used in national-income accounting. It is those functions — hereinafter called defense and justice — that foster liberty and economic growth because they protect peaceful, voluntary activity. Effective protection probably would cost more than four percent of GDP in these parlous times. But an adequate figure, except in the rare event of a major war, is probably no more than seven percent of GDP — the value for 2010, which includes the cost of fighting in Iraq and Afghanistan.

In any event, government spending — even on defense and justice — is impossible without private economic activity. It is that activity which yields the wherewithal for the provision of defense and justice. Once those things have been provided, the further diversion of resources by government is economically destructive. Specifically, from “Estimating the Rahn Curve” (above):

It is possible to obtain a rough estimate of the downward sloping portion of the Rahn curve by focusing on two eras: the post-Civil War years 1866-1890 — before the onset of “progressivism,” with its immediate and strong negative effects — and the post-WWII years 1946-2009. Thus:

Est Rahn curve rough sketch

My rough estimate is appropriately “fuzzy” and somewhat more generous than Daniel Mitchell’s [in “The Impact of Government Spending on Economic Growth”], which is indicated by the heavy black line. In light of my discussion of the shifting composition of G as G/GDP becomes relatively large, I  have followed the slope of the trend line for 1792-2010; that is, every 1 percentage-point increase in G/GDP yields a decrease in the growth rate of about 0.06 percent. That seemingly small effect becomes a huge one when G/GDP rises over a long period of time (as has been the case for more than a century, with no end in sight).

The following graphs offer another view of the devastation wrought by the growth of government spending — and regulation. (Sources are given in “Estimating the Rahn Curve.”) I begin with the share of GDP which is not spent by government:

Est Rahn curve sequel_priv GDP as pct total GDP

A note about my measure of government spending is in order. National-income accounting purists would insist that transfer payments (mainly Social Security, Medicare, and Medicaid) should not count as spending, even though I count them as such. But what does it matter whether money is taken from taxpayers and given to retired persons (as Social Security) or to government employees (as salary and benefits) or contractors (as reimbursement for products and services delivered to government)? All government spending represents the transfer of claims on resources from persons who earned those claims to other persons, who either did something of questionable value for the money (government employees and contractors) or nothing (e.g., retirees).

In any event, it is obvious that Americans enjoyed minimal government until the early 1900s, and have since “enjoyed” a vast expansion of government. Here is a closer look at the trend from 1900 onward:

Est Rahn curve sequel_private GDP pct total GDP since 1900

This is a good point at which to note that the expansion of government is understated by the growth of government spending, which only imperfectly captures the effects of the rapidly growing regulatory burden on America’s economy. The combined effects of government spending and regulation can be seen in this “before” and “after” depiction of growth rates:

Est Rahn curve sequel_growth rate of private GDP

(I omitted the major wars and the Great Depression because their inclusion would give an exaggerated view of economic growth in the aftermath of abnormally suppressed private economic activity.)

The marked diminution of growth  after 1900 has led to what I call America’s Mega-Depression. Note the similarity between the downward path of private sector GDP (two graphs earlier) and the downward path of the Mega-Depression in the following graph:

Est Rahn curve sequel_mega-depression

What is the Mega-Depression? It is a measure of the degree to which real GDP has fallen below what it would have been had economic growth continued at its post-Civil War pace. As I explain here, the Mega-Depression began in the early 1900s, when the economy began to sag under the weight of Progressivism (e.g., trust-busting, regulation, the income tax, the Fed). Then came the New Deal, whose interventions provoked and prolonged the Great Depression (see, for example, this, and this). From the New Deal and the Great Society arose the massive anti-market/initiative-draining/dependency-promoting schemes known as Social Security, Medicare, and Medicaid. The extension and expansion of those and other intrusive government programs has continued unto the present day (e.g., Obamacare), with the result that our lives and livelihoods are hemmed in by mountains of regulatory restrictions.

Regulation aside, government spending — except for defense and justice — is counterproductive. Not only does it fail to stimulate the economy in the short run, but it also robs the economy of the investments that are needed for long-run growth.

*     *     *

ADDENDUM: MORE EVIDENCE FOR THE RAHN CURVE

Here:

[W]e have some new research from the United Kingdom. The Centre for Policy Studies has released a new study, authored by Ryan Bourne and Thomas Oechsle, examining the relationship between economic growth and the size of the public sector.

The chart above compares growth rates for nations with big governments and small governments over the past two decades. The difference is significant, but that’s just the tip of the iceberg. The most important findings of the report are the estimates showing how more spending and more taxes are associated with weaker performance.

Here are some key passages from the study.

Using tax to GDP and spending to GDP ratios as a proxy for size of government, regression analysis can be used to estimate the effect of government size on GDP growth in a set of countries defined as advanced by the IMF between 1965 and 2010. …As supply-side economists would expect, the coefficients on the tax revenue to GDP and government spending to GDP ratios are negative and statistically significant. This suggests that, ceteris paribus, a larger tax burden results in a slower annual growth of real GDP per capita. Though it is unlikely that this effect would be linear (we might expect the effect to be larger for countries with huge tax burdens), the regressions suggest that an increase in the tax revenue to GDP ratio by 10 percentage points will, if the other variables do not change, lead to a decrease in the rate of economic growth per capita by 1.2 percentage points. The result is very similar for government outlays to GDP, where an increase by 10 percentage points is associated with a fall in the economic growth rate of 1.1 percentage points. This is in line with other findings in the academic literature. …The two small government economies with the lowest marginal tax rates, Singapore and Hong Kong, were also those which experienced the fastest average real GDP growth.

My own estimate (see above) for the United States, is that

every 1 percentage-point increase in G/GDP yields a decrease in the growth rate of about 0.07 percent. That seemingly small effect becomes a huge one when G/GDP rises over a long period of time (as has been the case for more than a century, with no end in sight).

In other words, every 10 percentage-point increase in the ratio of government spending to GDP causes a not-insignificant drop of 0.7 percentage points in the rate of growth. That is somewhat below the estimate quoted above (1.1 percentage points), but surely it is within the range of uncertainty that surrounds the estimate.