Robert Shiller‘s most famous (or infamous) book, is Irrational Exuberance (2000). According to the Wikipedia article about the book,
the text put forth several arguments demonstrating how the stock markets were overvalued at the time. The stock market collapse of 2000 happened the exact month of the book’s publication.
The second edition of Irrational Exuberance was published in 2005 and was updated to cover the housing bubble. Shiller wrote that the real estate bubble might soon burst, and he supported his claim by showing that median home prices were six to nine times greater than median income in some areas of the country. He also showed that home prices, when adjusted for inflation, have produced very modest returns of less than 1% per year. Housing prices peaked in 2006 and the housing bubble burst in 2007 and 2008, an event partially responsible for the Worldwide recession of 2008-2009.
However, as the Wikipedia article notes,
some economists … challenge the predictive power of Shiller’s publication. Eugene Fama, the Robert R. McCormick Distinguished Service Professor of Finance at The University of Chicago and co-recipient with Shiller of the 2013 Nobel Prize in Economics, has written that Shiller “has been consistently pessimistic about prices,”[ so given a long enough horizon, Shiller is bound to be able to claim that he has foreseen any given crisis.
(A stopped watch is right twice a day, but wrong 99.9 percent of the time if read to the nearest minute. I also predicted the collapse of 2000, but four years too soon.)
One of the tools used by Shiller is a cyclically-adjusted price-to-earnings ratio known as CAPE-10 . It is
a valuation measure usually applied to the US S&P 500 equity market. It is defined as price divided by the average of ten [previous] years of earnings … , adjusted for inflation. As such, it is principally used to assess likely future returns from equities over timescales of 10 to 20 years, with higher than average CAPE values implying lower than average long-term annual average returns.
CAPE-10, like other economic indicators of which I know, is a crude tool:

For example, the annualized real rate of price growth for the S&P Composite Index from October 2003 to October 2018 was 4.6 percent. The value of CAPE-10 in October 2003 was 25.68. According to the equation in the graph (which includes the period from October 2003 through October 2018), the real rate of price growth should have been -0.6 percent. The actual rate is at the upper end of the wide range of uncertainty around the estimate.
Even a seemingly more robust relationship yields poor results. Consider this one:
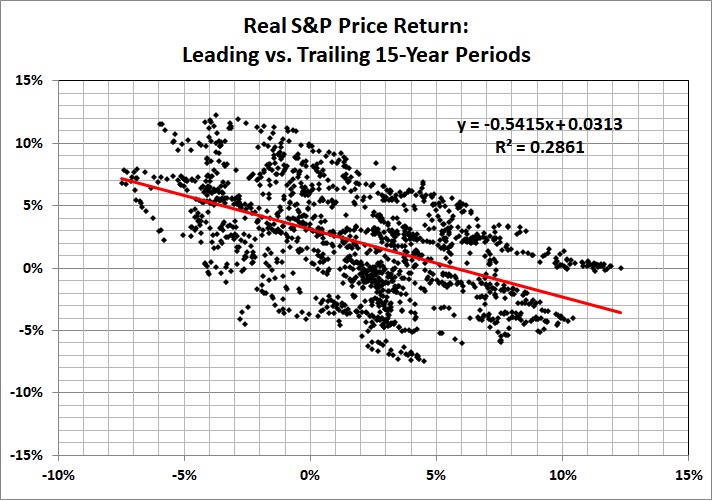
The equation in this graph produces a slightly better but still terrible estimate: price growth of -0.2 percent over the 15 years ending in October 2018.
If you put stock (pun intended) in the kinds of relationships depicted above, you should expect real growth in the S&P Composite Index to be zero for the next 15 years — plus or minus about 6 percentage points. It’s the plus or minus that matters — a lot — and the equations don’t help you one bit.
As the Danish proverb says, it is difficult to make predictions, especially about the future.
