Today’s trading on U.S. stock markets left the Wilshire 5000 Total Market Full-Cap index 17 percent below its September high. How low will the market go? When will it bounce back? There’s no way to know, which is the main message of “Shiller’s Folly” and “More Stock-Market Analysis“.
Herewith are three relevant exhibits based on the S&P Composite index as reconstructed by Robert Shiller (commentary follows):
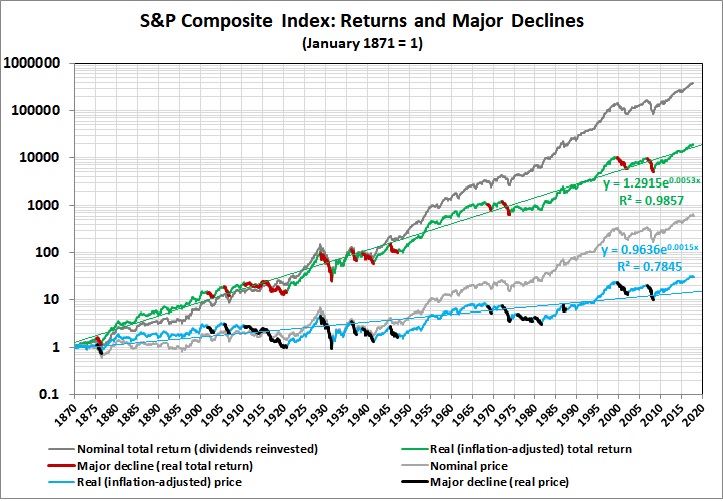

In the following notes, price refers to the value of the index; real price is the inflation-adjusted value of the index; total return is the value with dividends reinvested; real total return is the inflation-adjusted value of total return.
- The real price trend represents an annualized gain of 1.8 percent (through November 2018).
- The real total return trend represents an annualized gain of 6.5 percent (through September 2018).
- In month-to-month changes, real price has gone up 56 percent of the time; real total return has gone up 61 percent of the time.
- Real price has been in a major decline about 24 percent of the time, where a major decline is defined as a real price drop of more than 25 percent over a span of at least 6 months.
- The picture is a bit less bleak for total returns (about 20 percent of the time) because the reinvestment of dividends somewhat offsets price drops.
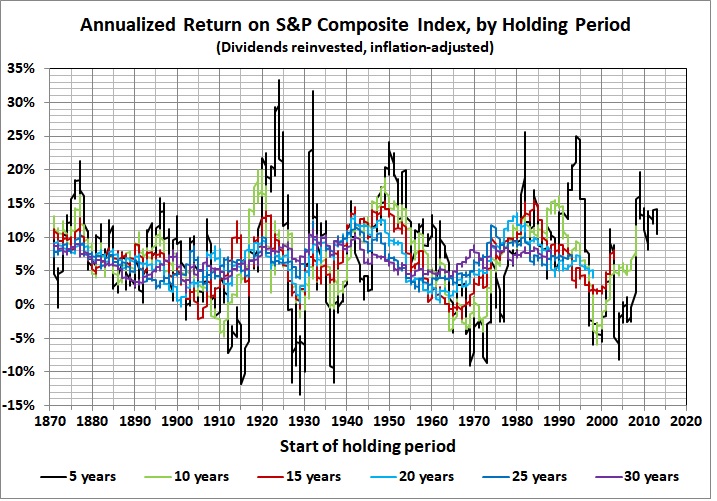
- Holding a broad-market index fund is never a sure thing. Returns fluctuate wildly. Impressive real returns (e.g., 20 percent and higher) are possible in the shorter run (e.g., 5-10 years), but so are significantly negative returns. Holding a fund longer reduces the risk of a negative return while also suppressing potential gains.
- Long-run real returns of greater than 5 percent a year are not to be scoffed at. It takes a lot of research, patience, and luck to do better than that with individual stocks and specialized mutual funds.
